

Dental practices are swimming in a sea of data every single day – everything from appointments and treatments to billing and marketing. The problem is that most of that data is scattered all over the place, in different systems and siloes, which makes it a real pain to get a clear picture of how the business is doing. Without a clear view, decisions get made on pretty flimsy information or wild guesses.
As a business intelligence consultancy, we specialise in building custom dashboards using Power BI, Tableau and Looker Studio, and we’ve seen firsthand the difference it can make for healthcare and multi-location businesses. We’re talking about integrating complex data sources, designing dashboards that actually get used, and helping teams turn raw data into real insights that drive daily and strategic decisions.
In this article, we’re going to explain how Dental Business Intelligence works, what kind of dashboards you’ll see in leading practices, and how a custom BI implementation can really boost profitability, operations, and patient experience.
Dental Business Intelligence (Dental BI) is actually pretty simple: it’s taking data from your dental practice and turning it into clear, usable insights that help drive daily operations and long-term decisions. It’s all about bringing together data from systems like practice management software, imaging tools, billing platforms, and marketing channels, and making sense of it all in one place. No more relying on scattered reports or intuition – with Dental BI, you get a real-time view of what’s happening and can act on it with confidence.
Now, Dental BI is more than just creating business intelligence dashboards to report basic numbers. It’s about taking a deep look at clinical, operational, and financial data, and seeing the whole picture in one place. This makes it a whole lot easier to spot trends across patient care, revenue, and team performance – which is tough to do with standard reports alone.
In practice, Dental BI works by pulling data from systems like Dentrix, Open Dental, Eaglesoft, and cloud-based practice management platforms, and then consolidating it into a BI tool like Power BI healthcare dashboards or an embedded analytics layer within an ERP. The data gets cleaned up and structured, and turned into KPIs and visual dashboards that make it easy to track performance, spot trends, and drill down into specific issues.
For example, a good Dental BI dashboard might show that hygiene chairs are under-utilised on Fridays, and that implant consults have a lower case acceptance rate than aligners. It might also reveal that a particular marketing channel drives high-value patients, but has a longer conversion cycle – which is useful to know when refining budget allocation.
The thing is, Dental BI isn’t just for big practices or DSOs – it’s an essential part of small business data analytics. Dental Business Intelligence is just as relevant for single-location practices looking to optimise scheduling and treatment mix as it is for bigger operations looking to standardise reporting and compare performance across locations.
So, how does Dental business intelligence actually work in a modern practice? Well, it’s all about setting up a business intelligence architecture that connects all the key systems into one smooth flow. Data gets automatically extracted from practice management software, HR tools, accounting systems, and marketing platforms, then gets cleaned, standardised, and analysed. The final step is data visualization dashboards, where this data gets displayed in dashboards and automated reports that update in real time or on a schedule.
Once the pipeline is up and running, the focus shifts to dashboards that reflect how the practice really operates day to day. These dashboards bring together the most important KPIs in one place, so owners, office managers, and clinicians can see performance without having to jump between systems.
Typical Dental BI dashboards include metrics like daily production versus target, collection ratio, and new patients per month. They also track operational indicators like no-show rate, chair utilisation, and provider performance across treatments and revenue. And because they update in near real time, teams get a current view of performance and can act quickly on gaps or opportunities.
A custom Dental BI project takes decision-making to a whole new level by turning fragmented practice data into clear, actionable insights. No more relying on static reports or disconnected systems – with custom BI, practices get a unified view of performance that supports faster and more confident decisions.
And here’s the thing: the value of a custom BI implementation really adds up in four key areas: higher revenue and profitability, smoother operations, improved patient experience, and stronger compliance and audit readiness.
Custom business intelligence (BI) dashboards track exactly what drives revenue, like how much production happens per patient, per hour, or how collections are going, and the number of write-offs or how often new cases are accepted. These metrics are all tailored to how the practice operates, which lets owners spot revenue leaks and make the most of their scheduling, pricing, and treatment mix.
For instance, one of our clients at Vidi Corp was able to make decisions 40% faster after introducing real-time dashboards. This meant they could take action on performance trends much quicker, and that kind of visibility usually leads to improvements like a 5 – 15% increase in collections over the next 6-12 months.
Data analytics implementations reveal bottlenecks in scheduling, staffing, and chair usage. This means practices can reduce overtime, make better use of staff, get patients in quicker, and avoid last-minute gaps in the schedule.
One project we did was able to cut the reporting time from over 50% by automating the dashboards – that’s a huge chunk of time back for a practice to focus on making things run more smoothly, and making decisions about scheduling and resource allocation much faster.
Practices can use custom BI solutions to track patient outcomes and experience over time. That includes things like how often patients need to come back in for procedures like root canals, whether they follow up after surgery, and how happy they are, as reported by text or email.
With this kind of tracking, practices can get a grip on providing consistent quality of care, see where things are going wrong, and make sure they’re communicating with patients in a way that really helps.
BI projects pull all the data together from clinical, financial, and operational systems into one place, giving you a solid, auditable reporting layer. This cuts down on manual errors, makes data more accurate and ensures reports are always in line with what the business is doing.
One of our clients, for example, was able to reduce manual data consolidation by 95% and got data accuracy up to 99.7% by using automated data pipelines and centralised dashboards.
Back office Dental BI is about the non-clinical processes that are driving profitability and scalability in the practice – that’s finances, staffing, inventory, scheduling and marketing performance. While clinical systems look at the treatments themselves, BI connects the business side of the practice and shows you just how efficiently it’s running.
In a lot of dental groups across North America and Europe, BI has been integrated directly into their ERP and financial systems. This gives them one place to look at all their accounting, payroll, and practice management data – which can be a huge headache otherwise.
The examples below show real solutions that we’ve delivered through our custom Power BI implementation projects. Each dashboard is built from the ground up with the client’s specific systems, data structure, and business questions in mind, rather than using generic templates.
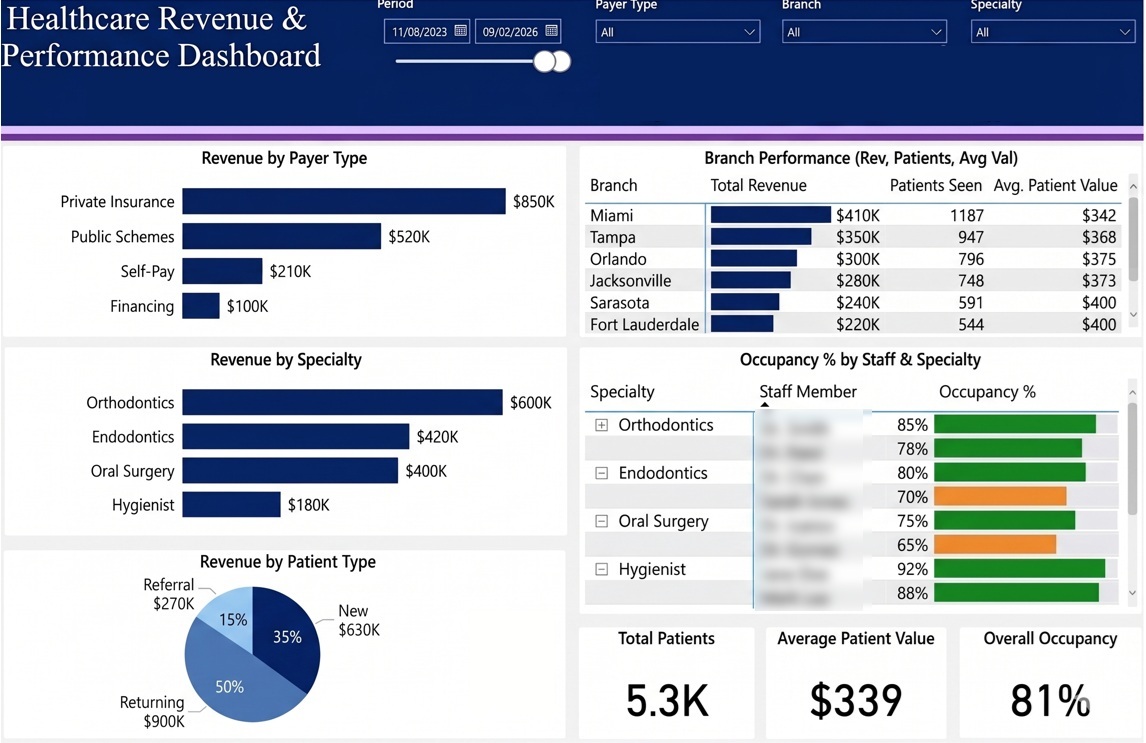
Financial BI dashboards are used by practice owners, finance managers and group leadership teams to see just how revenue translates into profitability across different providers and locations. They’re especially useful for multi-location practices and DSOs that need to see the same financial picture across different branches, specialities, and payer types. The end goal is to link production, collections, adjustments and operational capacity into one single decision-ready view.
One example is a custom financial Power BI dashboard we built for a dental practice in Florida to get a detailed view of their financial performance. The dashboard breaks down revenue by payer type – including private insurance, public schemes, self-pay and financing – to show just how reimbursement structures are impacting the practice. It also breaks down revenue by speciality, such as orthodontics, oral surgery and hygiene, as well as patient categories like new, returning and referral patients. At the structural level, it compares revenue across different branches and includes staff occupancy metrics for each provider, with filters and drill downs to look at performance by location, speciality, and time period.
This setup lets management see financial performance as a combination of revenue mix, patient flow and resource utilisation. It helps them make decisions on pricing, payer strategy and service focus by showing where revenue is coming from, and how efficiently resources are being used. It also helps identify underperforming locations or specialities and ensures staffing levels are in line with demand across the practice.
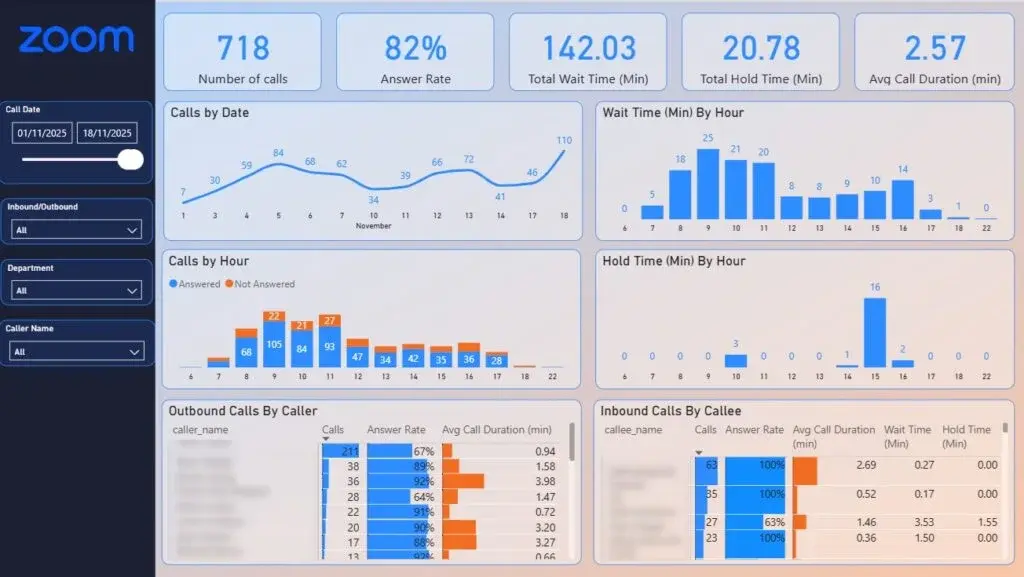
Scheduling dashboards for dental businesses are a game-changer for practice managers, front desk teams, and operations leads – they’re a vital tool for optimising appointment flow, cutting down on no-shows and maximising chair utilisation. They’re especially crucial for multi-provider practices where scheduling inefficiencies will directly hit the bottom line and patient experience.
The goal’s simple: get patient demand in sync with staff availability, and make sure every single chair hour is being used to its fullest potential.
We built a custom Power BI KPI dashboard for one of our dental clients, pulling data from their Zoom Phone system and analysing appointment and call activity side-by-side. The dashboard tracks all sorts of key metrics – number of inbound calls, answer rate, missed calls, wait time, hold time, and average call duration – and it’s all laid out in a way that’s really easy to follow. We’ve even included a time-based view so practices can identify when missed calls are most likely to happen, by hour of the day, which is super helpful for spotting peak periods where more front desk staff are needed.
We’ve also included an agent-level analysis, showing call answer rates and average wait times per staff member, as well as hourly breakdowns of hold time. And if you want to take a closer look at individual call details, we’ve included drill-down tooltips that let you do just that.
This zoom analytics dashboard is a real game-changer for dental practices – it helps them improve their scheduling by making sure patient enquiries are captured and converted into appointments. It also supports staffing decisions by highlighting when demand exceeds capacity and showing performance gaps at the individual staff level. As a result, practices can reduce missed calls, shorten wait times and minimise gaps in the schedule by getting their front desk operations in sync with patient demand.
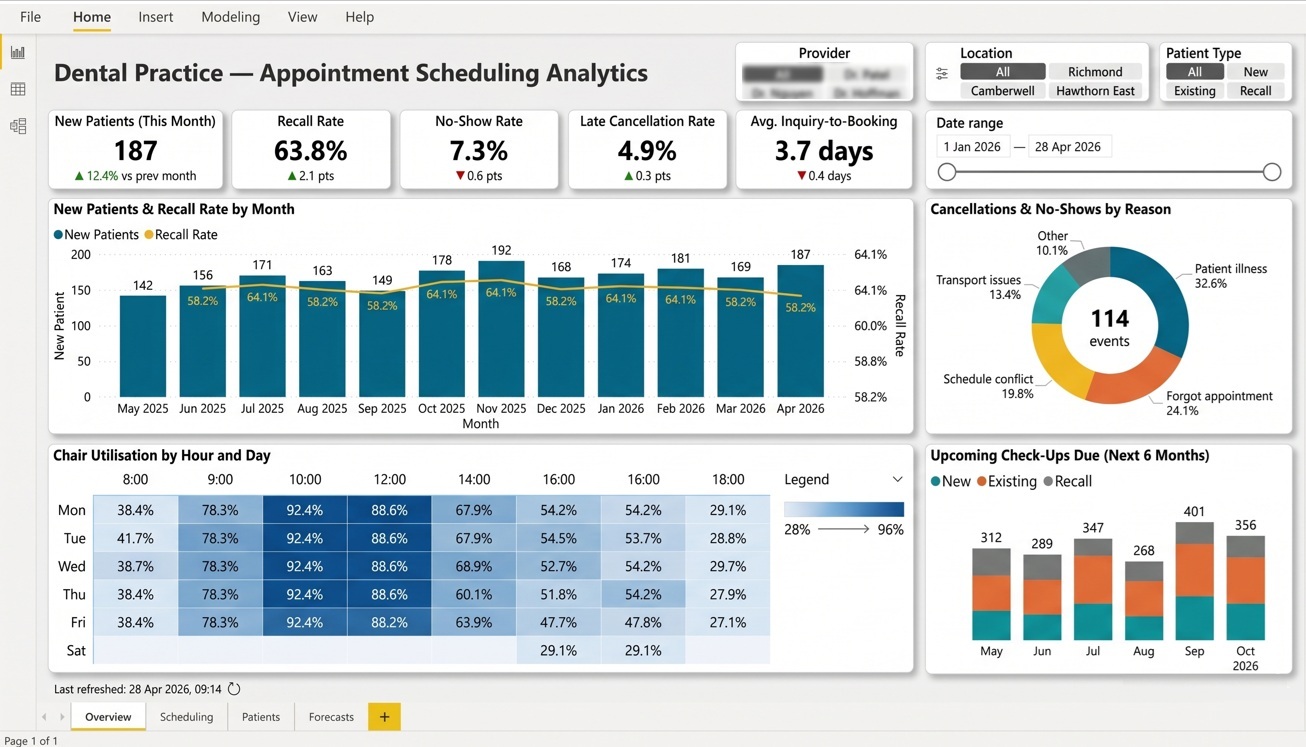
Appointment scheduling dashboards in dental business intelligence add a super-useful layer of analysis on top of existing clinical and scheduling systems – without changing how clinicians record treatments. They work by extracting data from PMS and appointment logs, and turning it into operational insights that help teams manage patient flow in a really effective way. This lets practices improve their scheduling performance without upsetting their clinical workflows.
In this example, we developed a custom Power BI appointment scheduling dashboard for a dental practice. The operational business intelligence dashboard tracks key metrics like new patients per month, recall rate, no-show and late cancellation rate, and the average time from initial inquiry to booked appointment. It also analyses chair utilisation by hour and day to spot underused time slots. In addition, we included a forward-looking view showing how many check-ups are due in upcoming months, with filters to segment by provider, location, and patient type.
This setup helps the practice stay on top of its appointment pipeline, rather than just reacting to gaps. The team can prioritise follow-ups with patients who are due for check-ups and hygiene visits, making sure they’ve got consistent demand for their clinicians. At the same time, having visibility into cancellations, delays and utilisation patterns helps them make better scheduling decisions, which leads to fewer empty slots and a more predictable patient flow.
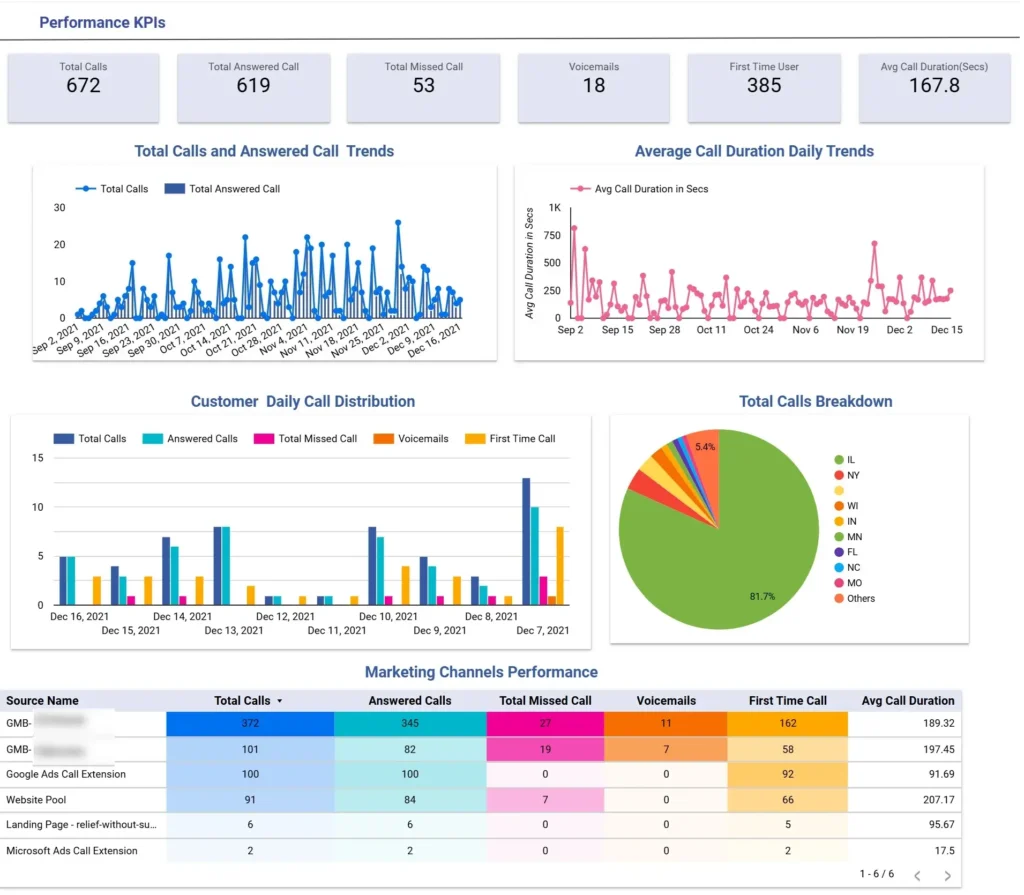
Marketing dashboards in dental business intelligence are a must-have for practice owners, marketing teams and DSOs – because they let them understand how patient acquisition channels are translating into real enquiries and booked appointments. They’re especially useful for clinics that rely on inbound calls and local marketing campaigns. The goal’s simple: connect marketing spend with actual patient demand and lead quality.
In this example, we developed a custom Looker Studio dashboard for a group of dental clinics focused on local patient acquisition. The dashboard integrates call tracking data and shows daily trends for total calls, answered calls and average call duration. It breaks down calls by status – including answered, missed, voicemail and first-time callers – and even shows geographic breakdowns to identify high-performing locations. The lower section compares marketing channels by call volume and engagement metrics, with detailed breakdowns of answered calls, missed calls and average call duration – and you can filter by time period and location if you want to.
This setup helps the practice evaluate both the quantity and quality of leads from each marketing channel. Management can identify which campaigns drive high call volume versus those that generate more engaged patients, indicated by longer call durations. It also highlights missed call opportunities and underperforming locations, which helps with better budget allocation, campaign optimisation and improved conversion of enquiries into booked appointments.
Successful dental business intelligence projects always start with clear business questions – not with tools. Instead of asking “which dashboard should we build?”, practices should start with questions like “Why is our hygiene department less profitable this year?” or “Which locations are underperforming and why?”. This approach makes sure the BI solution is focused on decision-making, rather than just reporting.
The implementation process usually follows a straightforward set of steps. First, we identify the relevant data sources, including PMS systems, accounting software, HR platforms and marketing tools. Next, we pick a BI applications like Power BI and then plan how these systems are going to be integrated. The final step is defining standard KPIs that reflect how the practice measures performance, which means the dashboards will answer real operational and financial questions.
Data quality and standardisation are super-critical at this stage. If procedure codes are inconsistent, or provider identifiers don’t match up, or fee schedules are different across locations, analysis can get distorted and lead to wrong conclusions. That’s why it’s so important to establish consistent data definitions and structures – so management reporting is accurate and comparable across the whole practice or group.
Change management is pretty much as important as getting the technical side all sorted out. Practice owners should get both the clinical and administrative leaders on board early on in the process so you can all be on the same page with what you’re trying to achieve and how you define exactly what is most important. Training sessions help your teams understand how to get the most out of those dashboards, while rolling out changes in phases stops things from getting overwhelmed with too many reports all at once. Starting out with a small number of really high-impact dashboards has a way of making things a lot more successful.
As for timeframe – smaller single-location practices can set up a basic BI system in about 4-8 weeks if things go smoothly. Big DSOs often take a more phased approach – they roll out analytics capabilities over the next 6-12 months as they get more systems, locations and stuff figured out.
By 2026, Dental BI is shifting beyond just reporting on what happened and is starting to move into automated forecasting and action plans using machine learning. No longer just looking in the rearview mirror, modern BI systems are starting to tell dentists what might happen next and what actions they should take. This is all about moving from just playing catch-up to being proactive in all sorts of different areas, from operations to finance and patient care.
The capabilities that are popping up already show this trend. Dentists can now use their BI systems to predict which patients are most likely to cancel appointments, forecast how much money they’re going to make in a given month based on what they’ve already booked, and even find out which patients are most likely to want to book things like implants or aligners. This gives them a heads-up so they can do things in advance, whether that means overbooking, adjusting staffing, or prioritising really important consultations.
At the same time, there are more and more AI-assisted tools coming along for clinical documentation and imaging analysis. Software that can automatically look at X-rays and write up clinical notes is creating a whole bunch of structured data that can be fed into BI systems. This is opening up new opportunities to track treatment outcomes, measure quality indicators, and tie clinical decisions to the financial and operational side of things.
All of this is all happening while some bigger industry changes are taking place. Dental groups are consolidating into bigger and bigger DSOs, insurers are getting a lot pickier about claims and reimbursements, and patients are expecting more and more from their experiences. Together, all these trends are making it clear that good, solid BI systems are no longer a luxury; they’re a necessity.
Practices that get on BI early are going to be a lot better placed to deal with what comes next in the industry. With stronger visibility and predictive capabilities, they can handle the pressure on their margins, deal with staffing shortages and adapt to those changing patient expectations over the next 3-5 years.
Dental Business Intelligence is no longer something you can just get by with – it’s what you need to stay competitive. With the right BI setup, you can get a clear view of where your revenue is coming from, how efficient your systems are and what your patients are doing – all in one place. This gives you the power to make decisions faster and with more confidence, and scale your practice without losing control.
If you’re looking to get custom BI dashboards set up for your dental practice or DSO, we can help. Get in touch to talk about your data, your goals, and how we can turn your systems into a proper decision-making tool.


