
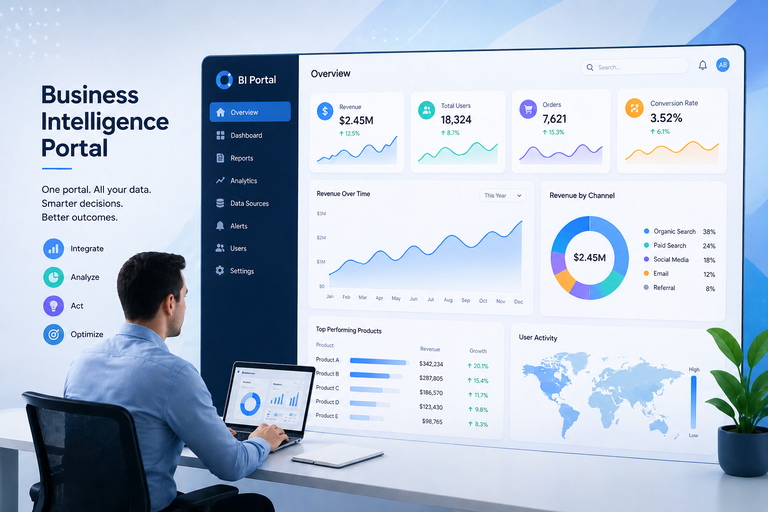
A BI portal is a centralised online hub where everyone in your business can log in to access dashboards, reports, and analytics in one place. Think of it as a single front door to all your company’s data, with the right people seeing the right information based on their role.
BI portals are quickly becoming a vital part of the modern data landscape. But here’s the thing: the real challenge isn’t building flashy analytics anymore. It’s making sure those insights are genuinely easy to find and actually used by people across the business.
As a Power Platform consultancy, we regularly combine Power BI and Power Pages to build business intelligence portals for our clients. It’s an approach we really like because it lets us deliver fully branded solutions that scale beautifully and bring all your analytics into one place, without losing control of costs or access management along the way.
In this article, we’ll walk you through what a BI portal actually is, how it works, and why so many organisations are choosing to roll one out. We’ll also share some real-world examples, break down the key components and costs, and offer practical tips for building a portal that people genuinely want to use.
A Business Intelligence (BI) portal is essentially a central, web-based hub that brings all of your analytics together in one place. It acts as the main “front door” to your data, allowing users to simply log in and access dashboards, reports, KPI’s and alerts without having to trawl through multiple tools or systems. Instead of having to search across different platforms, everything is organised, searchable and easy to digest from a single interface.
Importantly, a BI portal doesn’t replace business intelligence applications like Power BI, Tableau, Qlik, Looker or SAP BO – those tools are still used to build dashboards and do the actual analysis. The portal sits on top as a discovery and access layer, helping the wider business find, understand and use the content that analysts are creating.
For example, a user in 2026 might visit a URL where the portal lives, log in through single sign-on and find themselves on a homepage that is tailored to their needs. This homepage shows tiles for the most relevant business intelligence dashboards, curated collections for their department, and alerts for any metrics that need their attention.
The experience is role-based, so a user from client A and client B will see a completely different view tailored to their priorities.
A BI tool is used to do the heavy lifting and create the data – a BI portal is all about organising, governing and distributing that content across the business. It ensures that insights aren’t just created – but actually discovered, trusted and used in day-to-day decision making.
As organisations start scaling their analytics capabilities, the challenge shifts from building KPI dashboards to actually getting them out to the people who need them. A BI portal solves this by giving a controlled, scalable way to deliver insights both internally and externally.
Lower licensing costs at scale – a BI portal reduces the need to assign full licenses to every user who needs to access a report. Instead of paying for each user in tools like Power BI or Tableau, organisations can distribute their content through a central portal with controlled access. This makes a huge difference when rolling out analytics to big teams or entire departments.
Simplifying external sharing – BI portals make it much easier to share dashboards externally with clients and partners without having to provision licenses for each external user. This is especially useful for service-based businesses like CFO consultancies that have to deliver financial dashboards to clients. Instead of having to manage multiple accounts across BI tools, they can securely publish reports through a single portal that clients can access on demand.
Stronger branding and perceived value – A BI portal turns analytics into a branded, client-facing asset rather than a bunch of generic reports. Companies can customise the interface, structure and experience to reflect their own values and service offering. For example, when a fractional CFO consultancy provides clients with access to a proprietary reporting portal, it makes their analytics seem like a premium product and increases the perceived value of their services
Below are some real-life BI portal solutions that our Power Pages consultants have developed for clients. These examples show how organisations use portals to distribute analytics in a structured and branded way, and you can check out more Power Pages examples on our site.
Fractional CFO practices often need to share financial dashboards with multiple clients, which creates a whole bunch of overhead around user setup, licensing and access management. A BI portal solves this by giving clients a simple way to log in through a website URL owned by the consultancy, with a fully-branded interface that looks like their own product.
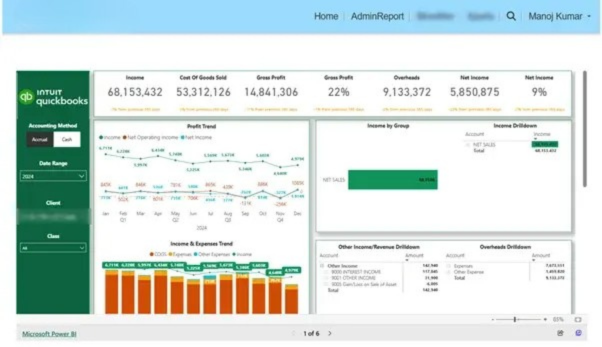
In one project, we built a white-labelled Power Pages portal for a CFO practice that was using Power BI dashboards connected to QuickBooks data to give clients access to their financial reports. Each client logs in and sees only their own financial reports, with no need for Microsoft accounts or additional licenses. This approach removes all the onboarding friction and turns reporting into a scalable, client-facing service.
Utility companies working with big networks of contractors face coordination challenges across service delivery, reporting and referrals. A BI portal centralises this process by giving each partner access to a shared system through a secure, branded website URL owned by the utility provider.
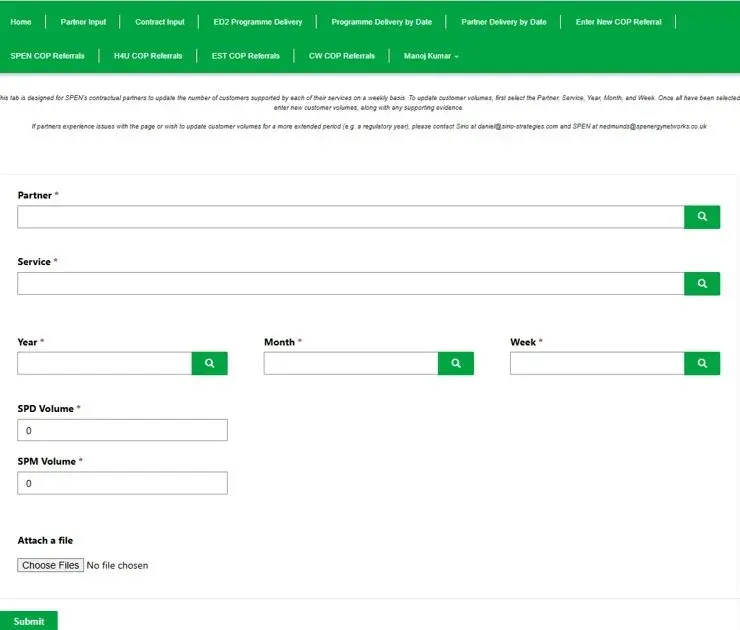
For a UK electricity provider, we put together a Power Pages partner portal that streamlines all partner interactions. The Partner Input bit lets partners submit their weekly performance data by service, time period and organisation, and that gets fed directly into contract tracking. The COP Referral bit means partners can refer customers to support services with all the right details captured in a standard format.
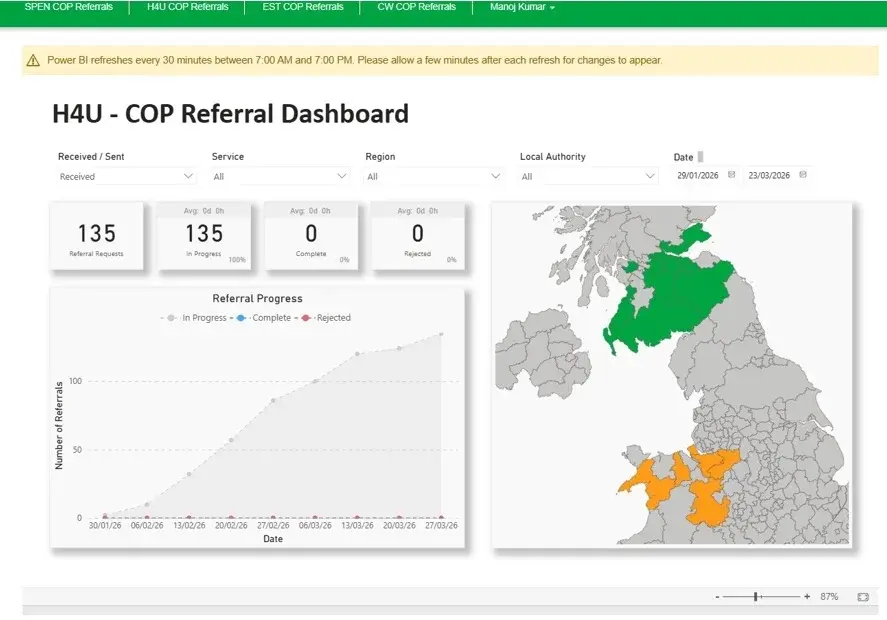
Then there’s an area that’s specific to each partner’s organisation – it lets them track referral statuses and keep an eye on things like requested, in-progress, completed and rejected cases. This view is powered by an embedded Power BI dashboard, making sure everyone’s got consistent performance visibility across the network. The result is one system that handles coordination, reporting and performance management without having to rely on loads of fragmented comms.
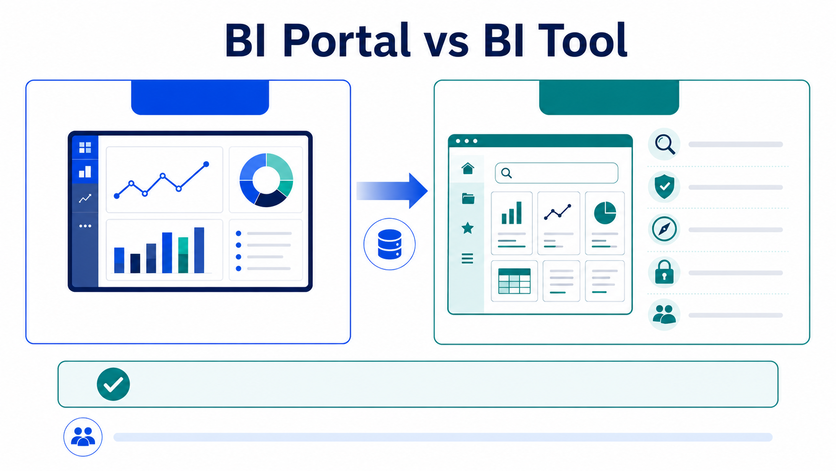
A BI tool and a BI portal are closely related, but they solve different problems.
A BI tool is used to create reports, dashboards, data models, and visual analytics. Tools such as Power BI, Tableau, Looker, and Qlik help teams connect to data sources, build interactive dashboards, analyse performance, and turn raw data into useful insight.
A BI portal sits above those tools. Its role is to organise, govern, and distribute BI content so users can find the right reports quickly and access them securely. Instead of asking users to navigate different workspaces, applications, folders, or links, a BI portal provides one central place for dashboards, reports, KPIs, documentation, and analytics resources.
This is especially useful when an organisation has many teams, departments, clients, or partners using different reports. Without a portal, users often struggle to know which dashboard is current, who owns a report, whether a metric is approved, or where to find the right version. A BI portal solves this by adding structure, search, permissions, metadata, and governance around reporting assets.
Power BI, for example, can be one of the tools inside a BI portal. The reports may still be built in Power BI, but the portal improves how those reports are accessed, shared, secured, and adopted across the organisation. This can include role-based access, branded client experiences, report catalogues, external sharing, usage tracking, and guided navigation.
In simple terms, BI tools help you build analytics. BI portals help people find, trust, use, and share those analytics at scale.
A BI portal can bring together many different types of reporting, analytics, and business knowledge in one place. The aim is to make it easier for users to find the information they need without switching between tools, folders, emails, or shared drives.
Common content inside a BI portal includes Power BI reports, Tableau dashboards, Looker dashboards, Excel files, PDFs, KPI scorecards, data dictionaries, training guides, help documents, and client facing reports. This means the portal can support both interactive analytics and supporting resources that help people understand and act on the data.
For example, a finance team may use the portal to access Power BI dashboards, monthly PDF board packs, Excel budget templates, and KPI definitions. A sales team may use it to view Tableau dashboards, pipeline scorecards, and training guides. A client services team may use it to share branded reports with external customers in a secure, controlled way.
The value of a BI portal is not limited to hosting dashboards. It also helps organise the context around those dashboards, such as who owns a report, when it was last updated, which metrics are approved, and which users should have access. This makes the portal a practical home for both analytics content and the documentation that supports better decision making.
By combining reports, dashboards, documents, definitions, and training material, a BI portal becomes a central access point for business intelligence across the organisation.
One of the main benefits of a BI portal is that it makes reports easier to find. As organisations create more dashboards, scorecards, and analytics resources, users can quickly lose track of which report to use, where it is stored, or whether it is still current. A BI portal solves this by giving users a structured way to search, browse, and discover trusted reporting content.
A BI portal should allow users to search for reports using business terms, not just file names. Users may need to search by department, report owner, KPI, client, topic, data source, project, region, business unit, or reporting period. This makes report discovery easier because people can find analytics content based on the way they work, such as revenue reports, sales performance dashboards, customer churn analysis, finance scorecards, or operational reporting.
Tags and categories help organise BI content into logical groups. Reports can be tagged by department, function, audience, data source, reporting frequency, business process, metric, system, region, or access level. For example, reports could be grouped under finance reporting, sales dashboards, executive KPIs, customer analytics, operations performance, Power BI reports, Tableau dashboards, or client reporting. This creates a structured analytics catalogue rather than a long list of disconnected dashboard links.
Favourites and recently viewed reports help users return quickly to the dashboards and analytics content they use most often. A user may want fast access to weekly sales reports, monthly finance dashboards, customer performance reports, board packs, KPI scorecards, or team performance dashboards. These features reduce friction, improve BI adoption, and make the portal feel more personalised to each user.
Recommended reports can guide users towards useful analytics content based on their role, department, permissions, previous activity, or common reporting needs. For example, a sales manager may see pipeline dashboards, revenue reports, and account performance dashboards, while a finance director may see budget reports, margin analysis, cash flow dashboards, and management accounts. Recommendations help users discover relevant reports they may not know exist.
Certified or approved reports help users identify trusted analytics content. In many organisations, there are multiple versions of similar dashboards, spreadsheets, or reports. Certification shows which reports have been reviewed, approved, and should be used for business decisions. This supports data governance, reduces reporting confusion, and helps users trust the numbers they are seeing.
Report thumbnails give users a visual preview of dashboards before they open them. This helps users recognise familiar reports, compare similar dashboards, and understand what type of content a report contains. A thumbnail can show whether the report includes charts, tables, KPI cards, maps, trend analysis, customer views, financial summaries, or operational metrics.
Metadata previews give users useful information about a report before they open it. This can include the report name, description, owner, department, refresh date, data source, certification status, access level, intended audience, report type, last modified date, and related dashboards. Metadata helps users understand whether a report is current, relevant, approved, and appropriate for their needs.
Guided report discovery brings these features together to help users find the right insight faster. Instead of relying on shared folders, bookmarks, email links, or manually searching through BI workspaces, users can browse a governed reporting catalogue with search, filters, tags, recommendations, certification, thumbnails, and metadata. This improves report usage, increases confidence in BI content, and makes analytics easier to adopt across the organisation.
Here is the section, ready to add:
BI portal governance is about making sure users can find reports that are accurate, approved, secure, and up to date. As organisations create more dashboards, scorecards, spreadsheets, and client facing reports, it becomes harder to manage which content should be trusted. A BI portal helps solve this by adding clear rules around report ownership, approval, access, publishing, and ongoing maintenance.
Certified reports help users identify trusted BI content. A certified report is usually reviewed and approved by a data owner, BI team, or business stakeholder before it is made widely available. This helps reduce confusion when there are multiple versions of similar dashboards or spreadsheets. Users can quickly see which reports are approved for decision making and which ones are still in draft, testing, or departmental use.
Every report in a BI portal should have a clear owner. The owner may be responsible for maintaining the report, answering questions, reviewing changes, and confirming that the data remains relevant. Report ownership improves accountability because users know who to contact if a dashboard is unclear, outdated, or showing unexpected numbers.
Data definitions explain what the underlying data means, where it comes from, and how it should be interpreted. For example, a sales report may include data from a CRM, finance system, or data warehouse. By including data definitions in the BI portal, users can understand the source, meaning, and limitations of the data before making decisions.
KPI definitions help users understand how important metrics are calculated. Terms such as revenue, gross margin, churn, conversion rate, utilisation, active customer, and average order value can mean different things across teams. A BI portal can provide approved KPI definitions so everyone uses the same calculation, business logic, and reporting standard.
Version control helps manage changes to reports, dashboards, and supporting documents. As reports evolve, users need to know whether they are viewing the latest version and what has changed over time. A BI portal can show version numbers, change notes, last updated dates, and previous versions where needed. This reduces the risk of people using outdated reports.
Approval workflows help control how reports are published. Instead of allowing every dashboard or spreadsheet to be shared immediately, organisations can require reports to be reviewed before they appear in the portal. This may involve checks for data accuracy, security, formatting, performance, branding, and business relevance. Approval workflows support better quality control across BI content.
Usage analytics show how people interact with reports in the portal. This can include views, searches, clicks, downloads, favourites, subscriptions, and user activity by department or role. These insights help BI teams understand which reports are valuable, which reports are underused, and where users may need more training or support.
Stale report detection helps identify reports that have not been viewed, updated, refreshed, or maintained for a long time. Old reports can create confusion, especially if they contain outdated numbers or duplicated metrics. A BI portal can flag stale content for review, archive unused reports, or notify report owners when action is needed.
Audit trails provide a record of important activity in the portal. This can include who published a report, who changed permissions, who approved a dashboard, who accessed client-facing reports, and when updates were made. Audit trails are useful for compliance, security reviews, troubleshooting, and governance reporting.
Role-based publishing ensures that the right users see the right content. Different audiences may need different reports, views, or permissions. For example, executives may need board-level KPIs, finance teams may need detailed management reports, clients may need branded external dashboards, and operational teams may need daily performance views. Role-based publishing helps control access while keeping the BI portal relevant and easy to use.
When planning a BI portal, one of the most important decisions is whether to build a custom portal or buy an existing BI portal platform. Both approaches can work well, but the right choice depends on your reporting needs, budget, security requirements, user experience goals, and how much control you want over the final solution.
Building a BI portal gives you more control over the design, user journey, branding, permissions, and integration with existing systems. For organisations already using Microsoft technologies, a portal can be built using Power BI, Power Pages, Dataverse, SharePoint, Azure, and Microsoft Entra ID. This approach can be especially useful when the portal needs to support specific business processes, branded client access, custom workflows, or embedded analytics.
A custom built BI portal can include features such as role based access, report catalogues, client specific dashboards, approval workflows, usage tracking, metadata, secure external sharing, and integration with CRM, ERP, finance, or operational systems. It can also be designed around how different users actually work, rather than forcing them into a generic reporting experience.
The main advantage of building is flexibility. You can create a portal that matches your organisation’s data strategy, security model, and customer experience. The trade off is that it usually requires more planning, development, testing, and ongoing maintenance.
Buying a BI portal platform can be faster when you need standard portal features without building everything from scratch. Many platforms already include report catalogues, search, favourites, user permissions, report scheduling, alerts, metadata, governance tools, and integrations with BI platforms such as Power BI, Tableau, Looker, and Qlik.
This approach can be useful when your main goal is to centralise existing BI content quickly. It may also reduce the amount of custom development needed, especially if the platform already supports your required BI tools and security model.
The main advantage of buying is speed. You can often launch faster because many features are already available. The trade off is that you may have less control over the user experience, branding, workflows, licensing model, and deeper integration with internal systems.
Building a BI portal may be the better option when you need a highly tailored experience. This is often the case for client facing portals, partner portals, embedded analytics products, or internal portals that need to follow specific approval, governance, or security rules.
You may also choose to build when you want the portal to work closely with Microsoft Power BI, Power Pages, Dataverse, Azure, SharePoint, Teams, or other Microsoft 365 services. This can give you a more connected experience across reporting, identity, collaboration, and business applications.
Buying may be the better option when you need a reporting portal quickly and your requirements are close to what existing platforms already provide. This can work well for organisations that want a central analytics catalogue, report search, user permissions, notifications, and governance features without creating a fully custom application.
It can also be a good choice when the organisation uses several BI tools and wants one interface to organise reports from Power BI, Tableau, Looker, Qlik, Excel, and other sources.
A custom build gives you more flexibility, stronger control over branding, and deeper integration with business systems. A purchased platform can reduce launch time and provide many common BI portal features immediately.
The decision should be based on the level of customisation required, the number of users, internal technical capability, licensing costs, security requirements, external access needs, and long-term maintenance plans.
For many organisations, the best approach is not purely to build or buy. A practical option is to use existing platforms such as Power BI and Power Pages as the foundation, then customise the portal around the organisation’s reporting, governance, and user access requirements.
The goal is to create a BI portal that users can trust, navigate easily, and rely on as the central place for reports, dashboards, KPIs, and analytics content.
Setting up a BI portal using Power BI and Power Pages involves some predictable Microsoft costs. The good news is it’s a pretty simple setup that scales based on how many users are accessing the portal.
To build and maintain the portal, you’re looking at a standard Microsoft license that includes Power Apps and Power Automate – that usually comes in at around $20 per month per developer. That covers the tools you need to manage the portal and its integrations.
Once it’s live, the main cost comes from Power Pages capacity rather than per-user licenses.
The key thing to remember is that users who log in to the portal don’t need Microsoft or Power BI licenses. As far as they’re concerned, it’s just the same as logging into any standard website. That’s what makes BI portals so cost-effective for sharing dashboards with large internal teams or external clients.
Let’s do the math. If you want to share your BI reports with 40 users, 40 Power BI Pro licenses would cost you $14*40 = $560 per month. If you share reports through a Power Pages portal, you would end up paying ~$120 per month.
A business intelligence portal’s not just a single tool – it’s a combination of integrations, a structured content layer, governance controls and a user-friendly interface. Together, these components make sure analytics are easy to access, secure and actionable across the organisation.
BI portals deliver value beyond just giving users access to dashboards. They improve analytics governance, usability and team efficiency by making sure analytics are structured, trusted and actively used across the business.
BI portals provide a structured way to manage access, definitions and usage of analytics across the organisation. They centralise governance while still allowing flexibility for different teams and BI use cases.
When analytics dashboards are easy to find and understand, people are more likely to use them. BI portals get rid of friction by giving users one place to go for all their reporting needs. That means better engagement and less time wasted searching for information.
Centralisation is key. Rather than jumping between multiple tools and logins, users can find what they need on a single homepage tailored to their role. That means less context-switching and more time on-task.
Self-service dashboards also reduce the need for analysts to do everything. Business users can quickly answer their own questions, such as monthly sales by region, without sending in a request or waiting for new reports.
In 2026, analysts are usually getting bogged down in endless Slack or Teams messages, repeated exports to Excel, and requests to rebuild the same views for different stakeholders. This constant firefighting leaves them with little time for deeper analysis.
A BI portal flips the script by becoming a self-service hub. Analysts publish trusted dashboards once and point users to those assets, rather than having to keep rebuilding reports.
And standardised templates and certified KPIs cut down on one-off requests. With fewer ad-hoc requests and support tickets, data teams can focus on higher-value work like advanced modelling, experimentation, and forecasting.
Implementing a BI portal involves setting up the right infrastructure, configuring secure access, and embedding analytics into a user-friendly interface. Here’s a step-by-step guide on how we do it using Power BI and Power Pages.
First, make sure you’ve got access to the Azure portal and an active subscription. That’s what you need to provision the infrastructure that supports embedded analytics.
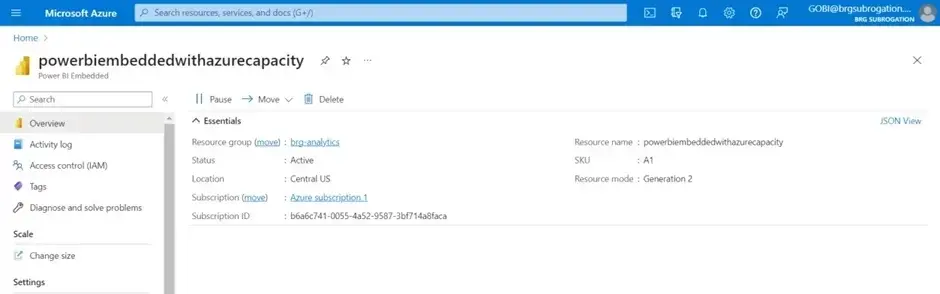
Next, create a Microsoft Fabric capacity resource within Azure. That lets your Power BI environment handle external sharing without needing a licence for each user. It effectively gives your workspace a premium upgrade designed for embedding.
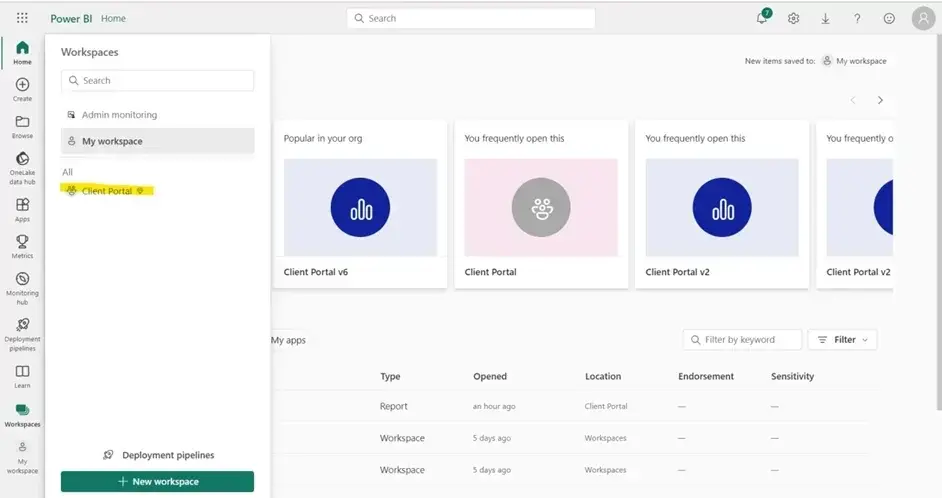
Now link that capacity to the Power BI workspace that will host your reports. Once you’ve done that, your workspace gains premium capabilities, usually marked by a diamond icon. That means the workspace can handle external access and embedded report performance.
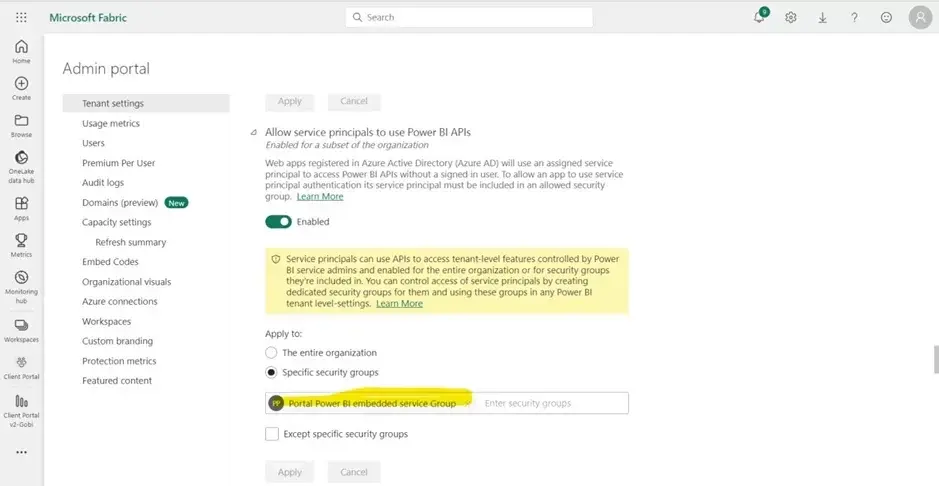
Next, set up a resource group in Azure to keep all related components in order. Add your portal resources to that group and configure your authentication settings. In the Power BI admin portal, enable this setup to use Power BI APIs, which allows secure embedding, automation, and integration with the portal.
Use Power Pages to create a web-based portal that users can access via a browser without a license. The portal is typically hosted on a custom domain you own.
This setup gives users a seamless experience, like logging in to any website, while all the data access and security rules happen behind the scenes.
Managing user roles is what makes a BI portal scalable and secure. It means that different users can access the same portal while only seeing the data, dashboards, and features that are relevant to them.
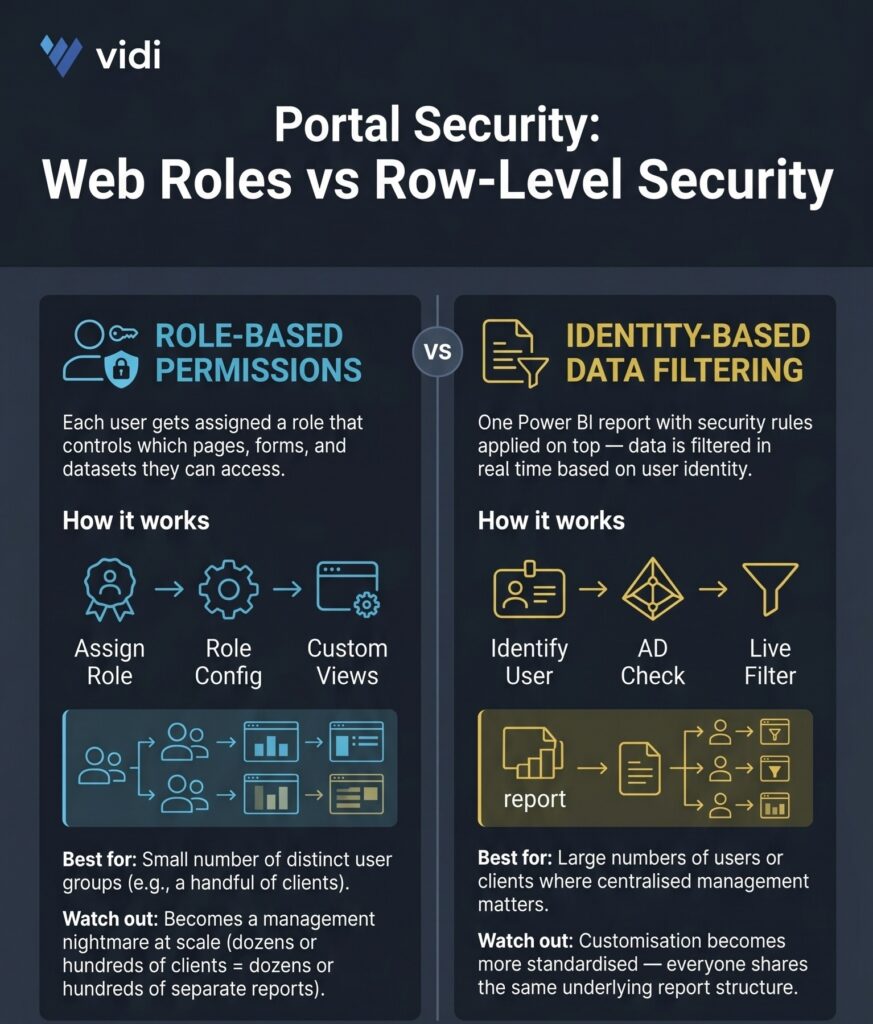
One option you have for managing user-level permissions is using Power Pages web roles. Each user gets assigned a role, and that determines which pages, forms, and datasets they can access. For example, an operations user might see operational BI dashboards, while an HR user only sees HR dashboards, even though both access the same portal. This approach is super granular and lets a single portal serve multiple audiences without having to build separate environments.
That approach works great when you’ve got a small number of distinct user groups. For example, if you’re serving a few clients, you can assign different roles and show each client a separate Power BI report. However, at scale – say dozens or hundreds of clients – this becomes a nightmare to manage, as you end up with a whole lot of separate reports.
To solve that problem, BI portals often use row-level security (RLS) within Power BI. Instead of creating multiple reports, you just have one report with security rules applied on top. When a user logs in to the portal, their identity gets validated through Azure Active Directory, then the system filters the data in real time so they only see what they’re allowed to see.
This approach is a whole lot more scalable because you only need to maintain one Power BI report and a single permissions table. That makes management a heck of a lot easier when dealing with large numbers of users or clients. Of course, the trade-off is that report customisation becomes more standardised, and all users end up looking at the same underlying report structure with filtered data, rather than having their own fully customised versions.
Getting a BI portal up and running isn’t the end of it; launching one is just the start. Real success depends on getting people to actually use it, which relies as much on how you communicate and train people as it does on making the setup work.
A practical approach is to start with a soft launch, just roll it out to a small group of “data champions” across different departments, gather their feedback, and sort out any usability issues before making it available company-wide. That way, you can ensure the experience is intuitive and relevant before handing it over to the wider organisation.
Training should be simple, focused on the specific job, and easy to revisit. Short recorded video walkthroughs get users up and running quickly, while 30-45 minute live webinars can show users the real-world use cases for each role. Quick reference guides provide step-by-step support, and regular office hours give users the chance to ask questions and build their confidence.
A successful internal launch also requires clear and simple communication and positioning. Get the word out in company-wide channels, get buy-in from the top, and show concrete examples of how it helps specific jobs get the job done faster. For example, highlight how sales teams can check in on their performance daily or how finance teams can get real-time reporting without having to do a bunch of manual work.
Adoption doesn’t just happen on launch day either. Ongoing iteration is key to keeping the portal useful and relevant. Keep an eye on usage metrics like logins, report views, and engagement trends. Get user feedback and regularly update the homepage, featured dashboards, and collections so the portal continues to reflect the current business priorities.
A business intelligence portal takes all those scattered dashboards and turns them into a structured, accessible, and scalable analytics experience. It helps organisations get a handle on their data, improve adoption, and gets insights to both internal teams and external users in a consistent way.
If you’re considering building a BI portal for your own business, get in touch, and we’ll walk you through the best approach for your setup.
A BI portal is a central place where users can access reports, dashboards, KPIs, analytics documents, and business intelligence resources. Instead of asking users to search through different BI tools, folders, emails, or shared links, a BI portal brings reporting content together in one organised and secure experience.
A BI portal can include search, report catalogues, role based access, certified reports, metadata, favourites, alerts, and client facing dashboards.
Power BI is a business intelligence tool used to create reports, dashboards, data models, and visual analytics. A BI portal is used to organise, govern, and distribute those reports and dashboards to the right users.
Power BI helps build analytics. A BI portal helps people find, access, trust, and use analytics at scale. Power BI can sit inside a BI portal as one of the reporting tools available to users.
Yes, you can build a BI portal with Power BI, especially when Power BI is combined with technologies such as Power Pages, SharePoint, Microsoft Teams, Dataverse, Azure, and Microsoft Entra ID.
Power BI can provide the reports and dashboards, while the portal layer can manage the user experience, navigation, permissions, search, branding, external access, and supporting content. This approach is useful for internal reporting hubs, client portals, partner portals, and embedded analytics experiences.
Yes, external clients can access a BI portal if it is designed with secure external access in mind. A client facing BI portal can allow customers, partners, suppliers, or franchisees to view reports and dashboards that are relevant to them.
Access should be controlled through authentication, permissions, row level security, and role based access. This helps ensure that each external user only sees the reports and data they are authorised to view.
It depends on how the BI portal is designed and how Power BI content is shared. Some users may need Power BI licenses, especially if they are accessing Power BI reports through standard Power BI sharing methods. In other cases, licensing may depend on Power BI capacity, embedded analytics, guest access, or the Microsoft environment being used.
Before building a BI portal, it is important to review the licensing model, user types, internal and external access needs, and how reports will be embedded or distributed.
A good BI portal should include a searchable report catalogue, role based access, report ownership, certified reports, favourites, recently viewed reports, metadata, KPI definitions, data definitions, report thumbnails, usage analytics, and approval workflows.
It may also include alerts, subscriptions, external client access, branded pages, training guides, help documents, audit trails, stale report detection, and integration with tools such as Power BI, Tableau, Looker, Excel, SharePoint, Teams, and CRM systems.
The cost of a BI portal depends on the size of the portal, the number of users, the required features, licensing, security requirements, integrations, and whether the solution is built from scratch or based on existing platforms.
A simple internal portal with links to reports may cost much less than a secure client facing portal with embedded dashboards, custom branding, approval workflows, row level security, usage analytics, and external access. Costs may include design, development, Power BI licensing, Power Pages licensing, Azure services, support, and ongoing maintenance.
A BI portal can be secure when it is designed with the right access controls and governance. Security features may include user authentication, role based access, row level security, data permissions, audit trails, approval workflows, and controlled external sharing.
For organisations using Microsoft technologies, security can often be managed through Microsoft Entra ID, Power BI permissions, Dataverse security roles, Power Pages authentication, and Azure services. The key is to design security around who the users are, what reports they need, and what data they are allowed to see.
Yes, a BI portal can include content from multiple BI and reporting tools. It can provide access to Power BI reports, Tableau dashboards, Looker dashboards, Excel files, PDFs, KPI scorecards, data dictionaries, and other analytics resources.
This is useful for organisations that use more than one reporting platform. The portal acts as a central access point, helping users find the right report without needing to know which tool it was originally built in.
The time needed to build a BI portal depends on the complexity of the requirements. A simple internal reporting portal can be created relatively quickly if the reports, permissions, and content structure are already clear.
A more advanced portal with custom branding, external client access, embedded Power BI reports, role based permissions, approval workflows, metadata, usage analytics, and multiple system integrations will take longer. The timeline usually depends on how much content needs to be organised, how complex the security model is, and how many user groups the portal must support.


