Management Reporting Services on Project Basis

Month-end management reporting shouldn’t cost you days of manual spreadsheet work. We automate the whole process and run it for you, so your reports are ready when you need them. Your managers spend their time acting on the numbers, not assembling them.

Vidi Corp builds automated management reporting as a service in Power BI, Looker Studio, or the tools you already use. We extract data from your sources, set up an automatic refresh schedule, and visualise it as clear dashboards. You get the setup and the ongoing updates handled, not a one-off build you’re left to maintain.

#1

Business intelligence consultancy worldwide, according to G2

1000+

Completed
projects

600+

Happy
clients

20k+

Hours
worked

What Our Management Reporting Service Includes

Most reporting solutions hand you software and wish you luck. You still have to connect the data, build the views, chase the numbers, and write the commentary yourself. That is not what we do. Our business intelligence consultants design a custom automated reporting system around your business and then run it for you as a service


Automated Monthly Management Accounts

Automated Monthly Management Accounts

Several consultants in our team come from accounting and finance background. Having a deep understanding of finance processes, we build automated monthly management accounts that give your leadership team a clear view of revenue, profit and key business drivers. We have experience working with data from systems such as QuickBooks Online, Sage, Shopify, property management platforms, CRMs, bank feeds, spreadsheets, and SQL databases.

The result is a structured monthly reporting pack that is easier to review, easier to explain, and easier to trust. Instead of manually building reports from disconnected systems, your team gets repeatable management accounts produced from a more reliable reporting process.

Live KPI Dashboards and Scorecards

Live KPI Dashboards and Scorecards

Your leadership team needs more than historic reports. We create live KPI dashboards and scorecards that show current business performance across finance, sales, operations, inventory, marketing, customer activity, and other core metrics.

These dashboards can be built in Power BI or other business intelligence platforms depending on your stack. They help executives track performance daily, identify issues earlier, and reduce dependency on static month-end reporting.

Board Packs and Investor Reporting

Board Packs and Investor Reporting

We create board-ready management reporting packs that help founders, CFOs, finance leaders, and investor-backed businesses communicate performance clearly. These reports can include financial summaries, KPI trends, operational commentary, cash flow updates, variance analysis, and investor-focused performance views.

A strong board pack should not be a last-minute scramble. We help automate the underlying data and structure the output so board meetings focus on insight, decisions, and accountability.

Variance Analysis With Written Commentary

Variance Analysis With Written Commentary

Good management reporting explains what changed, not just what happened. We help you build reports that highlight variances against budget, forecast, previous period, or target, with written commentary that makes the numbers easier to interpret.

This is especially valuable for finance teams, founders, and senior leaders who need to understand the drivers behind revenue movement, margin changes, cost increases, cash pressure, or operational shifts. You get reporting that supports decision-making, not just data presentation.

Cash Flow Reporting and Forecasting

Cash Flow Reporting and Forecasting

Cash visibility is critical for growing businesses, multi-entity companies, and investor-backed teams. We create cash flow reports and forecasting views that help leaders understand current position, short-term risk, working capital movement, and expected cash requirements.

These reports can combine accounting data, bank data, accounts receivable, accounts payable, sales pipeline, budgets, and operational assumptions. The goal is to help your team see cash risks earlier and make better funding, hiring, purchasing, and investment decisions.

Custom Reports for Your Business Model

Custom Reports for Your Business Model

Every business has a different operating model, and your management reporting should reflect that. We create custom reports for SaaS, ecommerce, retail, real estate, manufacturing, professional services, education, marketing agencies, financial services, and multi-entity groups.

Your reports can track metrics such as customer profitability, property performance, stock ageing, sales pipeline, recurring revenue, procurement spend, utilisation, gross margin, campaign ROI, or department-level performance. The reporting system is built around your KPIs, your data sources, and the way your leadership team makes decisions.

Management Reporting Technology we use

Our management reporting services includes implementation and ongoing management across the layers below. Tool selection depends on your current setup and the outcome you want.

Power BI Logo

Power BI

looker logo

Looker Studio

tableau logo

Tableau

Domo

Domo

Data integration and automation

You get 15+ ready-made data connectors that pull and structure data from your source systems automatically. We are official Intuit and Zoom technology partners, and our list of integrations keeps growing.

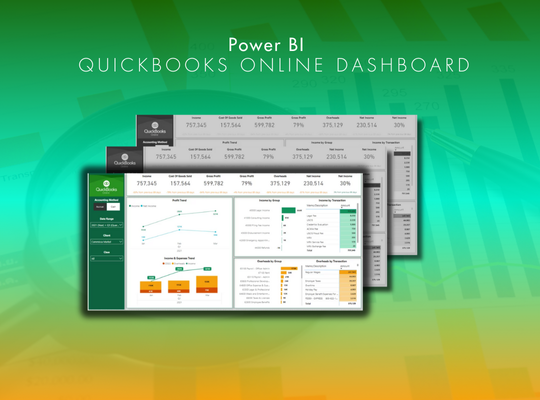
QuickBooks Online Power BI Connector

QuickBooks Online

Clickup Power BI Integration

ClickUp

Shopify Logo

Shopify

Power BI Connectors

Other Business Intelligence Connectors

Because we build and maintain our own connectors, you get real advantages:

  • Faster dashboard delivery: We know each source system’s data model inside out, so we design and ship dashboards up to 50% faster.
  • Quicker support: We are not waiting on third-party vendors, so we resolve around 90% of support requests in 2 to 3 days.
  • Less manual data work: Our connectors turn raw data into an analytics-ready format automatically, saving your team 10 to 20 hours of cleaning and prep.
  • Customisation when you need it: Need a connector tailored to specific fields or reporting logic? We build it on request.

Our Management Reporting Services Clients


  • Ministry of Defence
  • Delta Logo
  • American Express Logo
  • Schumberger Logo
  • Luxotica Logo
  • Kardex Logo

Client Results From Automated Management Reporting

Clutch Reviews
G2 Reviews
Google Reviews

Vidi Corp helped us create automated management reporting across three businesses, including real estate, bakery operations, and luxury watch retail. The reports helped us understand revenue and profit fluctuations, track unexpected expenses, analyse customer profitability, and make better decisions about inventory and cash flow. Their level of business understanding stood out because they made sure the analysis was linked directly to our goals

Ben Stone,

Founder, Galeta, Lansdowne Investments & Fathom Watches

5 stars

Vidi Corp connected our QuickBooks Online data to Power BI and helped us automate financial and operational reporting. The solution saved 4 hours per month, added value to our brand, and improved the service levels we can offer to customers. Their customer service was exceptional, and the connector worked perfectly.

Stephanie Dolbeck,

CEO, Angel Oak Accounting, LLC

5 stars

Vidi Corp helped us integrate Power BI with QuickBooks Online across multiple companies, giving us a real-time consolidated view of financial performance. We reduced the time spent compiling financial reports by over 75%, improved reporting accuracy, and gave leadership faster access to the numbers they needed. The team customised the solution around our multi-entity setup and delivered exactly what we needed.

Stephanie Dolbeck

CEO, Angel Oak Accounting, LLC

5 stars

Our Management Reporting Services – Case Studies

Benefits of Our Automated Management Reporting

Recognised by awards and industry platforms

  • Rising Star Award winner in the 2025 Technology Awards (as published by Business Awards UK).

  • Best Data Automation Partner for SMEs, London 2025 (FDI Insider award listing).

  • Listed as a finalist in the Growing Business Awards 2025.

  • Reviewed and listed on G2 as a service provider for BI consulting, with published reviews and category placement.

Faster Reporting Cycles

Automated management reporting reduces the time spent gathering data, checking spreadsheets, and preparing recurring reports. Reports that once took days to produce can often be generated in minutes once the reporting system is in place.

This gives leadership more time to analyse performance and take action. It also allows teams to move from monthly reporting to weekly or daily visibility where needed.

Fewer Manual Errors

Manual reporting processes often rely on copy-paste work, spreadsheet formulas, file version control, and repeated data exports. Each step creates an opportunity for errors.

By connecting data directly from source systems into a controlled reporting model, we help reduce manual handling and improve data consistency. This makes reports more reliable and gives stakeholders greater confidence in the numbers.

Better Executive Visibility

Executives need a clear view of what is driving business performance. Our management reporting services bring finance, operations, sales, marketing, customer, and cash flow data into structured dashboards and reports.

This helps leadership identify opportunities, risks, trends, and underperformance faster. It also improves accountability because teams can see the same metrics, definitions, and results.

Improved Cash and Working Capital Control

Automated management reporting can highlight stock ageing, outstanding invoices, customer profitability, cash movement, payment trends, and expense changes. This gives leaders earlier visibility into risks that affect cash flow.

For businesses with high inventory, multi-entity structures, property portfolios, or complex revenue models, this can have a major impact on cash planning and operating discipline.

ItemCost
Hourly rate$100 per hour
Typical automated report (average)About $2,000
Final price depends on the exact analysis and visualisation involved and the number of data sources connected.

How We Build and Run Your Reporting

Our delivery approach is built around clear objectives, predictable execution, and measurable outcomes, ensuring every solution supports your business goals and delivers strong ROI.

Discovery and onboarding

Discovery, We Map Your Data Sources, KPIs, and Reporting Needs

We start by understanding your business model, current reporting process, data sources, stakeholder needs, and management priorities. This includes reviewing existing reports, spreadsheets, dashboards, board packs, and manual workflows.

From there, we define the KPIs that matter most and identify where the data lives. This gives us a clear blueprint for building management reporting that supports real decisions, rather than simply recreating old reports in a new format.

Data Assessment

Build and Automate, We Design a Tailored Reporting System

Once the reporting requirements are clear, we build the automated reporting system behind the scenes. This can include API connections, data extraction scripts, SQL databases, cloud data warehouses, Power BI models, Power Query transformations, RPA workflows, and automated refresh schedules.

We regularly work with systems such as QuickBooks Online, Sage, Shopify, Xero, Zoho CRM, SAP Ariba, ClickUp, Zoom, Google Ads, Meta Ads, LinkedIn Ads, GA4, Excel, SQL Server, Azure, BigQuery, and other business platforms. Where relevant, we use ready-made data integrations to reduce implementation time and help you reach value faster.

Solution Development

Deliver, Automated Packs and Dashboards Every Cycle

After the system is built, we deliver the reports your team needs on the agreed cadence. That may include monthly management accounts, weekly dashboards, daily operational scorecards, board packs, investor reports, cash flow reports, or departmental reporting views.

Because the reporting process is automated, your team spends less time collecting and cleaning data, and more time interpreting the results. Reports can be refreshed more frequently and delivered with greater consistency across the business.

Deployment & Optimization

Review and Refine, Ongoing Commentary, Adjustments, and Support

Management reporting should evolve as the business changes. We support ongoing refinements, new KPI requirements, source system changes, reporting logic updates, and improvements to dashboards or board packs.

This makes the reporting system more valuable over time. As your business grows, adds entities, launches new products, changes its operating model, or reports to new stakeholders, your management reporting can adapt with it.


Discuss Your Management Reporting Services with an Expert

FAQ about Management Reporting Services

 Do I Need to Buy Any Software?

No. We build and run the reporting system for you. Depending on your current stack and reporting requirements, we may use tools you already have, such as Power BI, SQL Server, Azure, QuickBooks Online, Sage, Excel, or other existing systems.
The goal is to give you reliable reporting output, not another tool your team has to learn from scratch.


What Does Management Reporting Do?

Management reporting turns business data into structured insight for decision-making. It helps leaders understand financial performance, operational trends, cash flow, sales activity, customer behaviour, risks, and opportunities.
Strong management reporting also creates accountability. Teams can track performance against budget, forecast, target, or prior period and understand where action is needed.

What Are the Main Types of Management Reports?

Common types of management reports include financial reports, operational reports, sales reports, cash flow reports, variance reports, KPI dashboards, and board reports. Some businesses also need customer profitability reports, inventory reports, marketing performance reports, project reports, or compliance dashboards.
The right reporting mix depends on your business model and leadership priorities. We design management reporting around the decisions your team needs to make.

What Is the Difference Between FP&A and Management Reporting?

FP&A focuses on financial planning, budgeting, forecasting, scenario modelling, and strategic financial analysis. Management reporting focuses on presenting ongoing business performance in a clear, structured way for decision-making.
The two are closely connected. Good management reporting gives FP&A teams better data to analyse, while FP&A insights help determine what should be included in management reports.

Management Reporting Services

Everything you Need to Know

Of the endless possible ways to try and maximise the value of your data, only one is the very best. We’ll show you exactly what it looks like.

To discuss your project and the many ways we can help bring your data to life please contact:

Call

+44 7846 623693

eugene.lebedev@vidi-corp.com

Or complete the form below

The free dashboard is provided when you connect your data using our Power BI connector.