
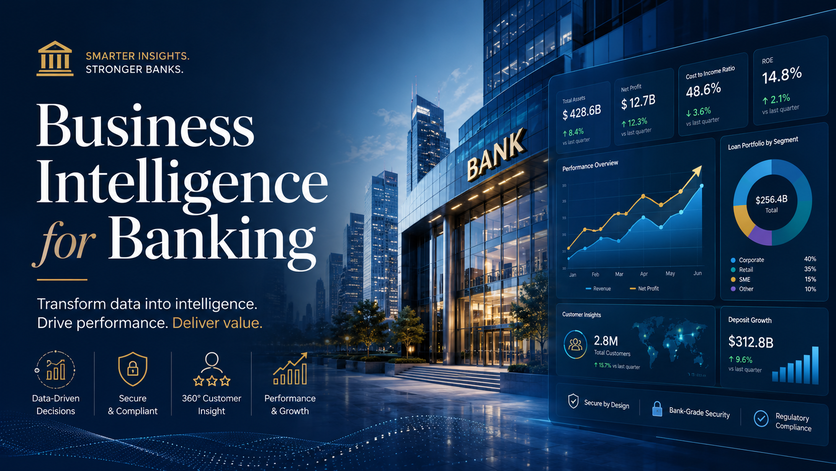
Banking business intelligence, put quite simply, is all about using data to drive informed decisions across the whole organisation. And that’s exactly what banks are using technologies, data infrastructure and analytical practices for – to turn information about their customers and operations into valuable insights. This means they can monitor profits, manage risks, spot scams, keep customer data in order, support faster decision-making – and the list goes on. As we see more and more digital transactions being made, business intelligence is fast-becoming the backbone of successful banking operations.
At Vidi Corp, we’ve delivered business intelligence consulting, automation & analytics projects for financial companies, including American Express, Chargebee, lenders and finance teams working in super tough regulatory environments. We’ve helped build Real-Time Power BI dashboards, automated financial reporting workflows, linked up complex banking and payment data sources and given our clients the tools to build scalable analytics platforms on top of Microsoft Fabric and Azure.
In this article, we’re going to cover what business intelligence in banking is all about, we’ll look at some of the most valuable use cases in banking, chat about the main benefits and challenges, and then show you how modern Business Intelligence platforms like Microsoft Fabric and Power BI are changing the game for banks.
Looking for banking dashboard examples? See five real Power BI dashboards built for executive, risk, fraud, treasury, and customer teams.
Banks have to deal with billions of transactions every single day as people use their cards, mobile banking apps, open banking platforms, digital wallets and instant payment systems. Every time this happens it generates a ton of data about how things are running operationally, financially and on the customer side – data that can actually be put to good use to keep an eye on how things are going, manage risk and inform business decisions. And it’s not just getting busier, as digital banking just keeps getting more and more popular, managing the amount of data that’s coming in has become a major headache for the big financial players.
The banking world has also gone and changed quite a bit. Fraud trends can pop up in no time, payments are going up and down throughout the day and customer behaviour just keeps shifting. Traditional reporting methods – which are often just daily or monthly reports – just can’t deliver the kind of timely insights that you need to cope with all these changes. Banking analytics lets organisations keep an eye on things in real time, which makes it possible for teams to spot trends, figure out where things are going wrong and make decisions on the fly as they go.
Regulations have also made banking analytics way more important than it used to be. Rules like Basel IV , IFRS 9, DORA and AML/KYC mean that banks have to keep all this data up to date and in order so that they can explain how they’re calculating certain numbers. So many financial institutions are now putting money into central data platforms that can help with all that – getting reporting consistent, in order, and making it all work properly from start to finish.
And let’s be honest, there is a lot of pressure on the big banks to keep up in this digital world. The digital-first banks and fintech companies are raising the bar with regards to speed, personalisation and digital services. To stay in the game, traditional banks need a clear picture of how their customers are behaving, how their operations are going, their financial results and where they stand on risk. Banking analytics and business intelligence dashboards bring all this together in one place, giving the people in charge a clear view of what’s going on and supporting the kinds of informed decisions that will keep the business moving forward.
Business intelligence in banking is the not-so-simple task of making sense of a bunch of data scattered all over the place – collecting it, sorting it, looking for patterns, and figuring out ways to present it all in a way that helps bankers make better decisions. It’s a bit of a mishmash of banking analytics, reporting, and performance tracking all rolled into one – to help banks get a clearer picture of how things are running, keep an eye on risks, make customers happier, and keep tabs on the financial side of things. To get a robust BI system up and running, you need a solid data governance plan, and make sure your data is getting from A to B with the right integration and reporting protocols in place – all following established best practices for analytics.
A standard banking business intelligence system wraps up data from various places, like:
By bringing all this data together into one spot, banks get a clearer view of what’s going on with customers, operations, risks, and the financials. This helps create a foundation for financial business intelligence, so they can look at performance across the whole bank. Here are a few examples of where business intelligence and banking analytics are put to use in different areas of a bank.
The terms Banking Analytics, Analytics in Banking and Analytics for banks get tossed around alot with Banking Business Intelligence but they all have a slightly different slant on things. Despite being used in the same field, they all refer to using banking data to improve decision making for day to day, financial and strategic decisions.
In real life the difference is that business intelligence is all about generating reports, building dashboards and monitoring performance, whereas banking analytics is more about really digging in to the data and teasing out trends, patterns and insights from banking data. Most of the software used by banks today is a mix of both of these, giving them a full picture of their customers, operations, financial health and risk.
| Term | What It Emphasises |
|---|---|
| Banking Business Intelligence | Reporting, dashboards, KPI monitoring, and decision support. |
| Banking Analytics | Data analysis, trend identification, forecasting, and operational insights. |
| Analytics in Banking | The application of analytics across banking functions such as lending, fraud, treasury, and customer management. |
| Analytics for Banks | Analytics solutions designed to improve reporting, risk management, operational efficiency, and business performance. |
We use both banking business intelligence and banking analytics a lot in this guide because most of the software used by banks today is a mix of those two things and combines reporting, dashboards and analytics all in one decision support tool.
Automated financial reporting platforms are giving banks end-to-end visibility into operations like payments processing, loan underwriting, collections, fraud investigations and customer support. By putting all that data into one place, banks can keep track of service levels, turnaround times and identify bottlenecks before they affect customers or regulatory performance.
For example, some banks use workflow analytics to cut down loan approval times from several days to under 24 hours by identifying delays in document verification and manual approvals.
Strategic BI is helping banking execs monitor key metrics like profitability, capital efficiency and competitive performance across the organisation. These executive dashboards are used by CEOs, CFOs, treasury teams, heads of strategy and business line directors to support capital allocation and growth decisions.
Common KPIs in strategic banking dashboards include:
Customer segmentation BI – a.k.a. trying to figure out who your customers are, how valuable they are, and where to invest in them – is a pretty big deal in banking. These types of enterprise dashboards are used by pretty much anyone who works with customers – from retail banking directors to marketing teams and even customer analytics teams.
Common KPIs in customer segmentation dashboards are:
Credit risk BI – a.k.a. monitoring the quality of a bank’s loan portfolio and making sure it’s not taking on too much risk – is another big deal in banking. These management dashboards are used by pretty much anyone who works with loans – from Chief Risk Officers to credit risk teams and even treasury departments.
Common KPIs in credit risk dashboards include:
Fraud detection BI dashboards give banks a way to juggle four competing aims: catching fraud quickly, keeping false positives to a minimum, reducing financial losses, and monitoring whether their fraud models are any good. These dashboards are widely used by fraud operations teams, people who manage payment risk, compliance teams, card operations departments, and Chief Risk Officers.
KPIs you typically see in a fraud dashboard include:
Cash flow and liquidity BI dashboards help banks figure out whether they have enough money in the bank to meet their bills, how they’re funding themselves, and how interest rate and FX risks are playing out over different timescales. These dashboards are widely used by treasury teams, people who manage liquidity risk, the Chief Financial Officer, teams who do Asset Liability Management (ALM), and the central bank reporting department.
KPIs you typically see in a liquidity dashboard include:
Implementing business intelligence is more than just loading up a reporting tool. For financial institutions, its about tying together multiple systems – often in a very disjointed environment. On top of that, they’ve got to meet super-stringent regulatory requirements, and ensure that those reports still make sense as the business grows and evolves.
Data Silos – The Roadblock to Good Reporting
Banking data tends to be all over the place – in core banking systems, lending platforms, contact management software, payment networks, treasury systems, and compliance apps – you name it. When none of these systems talk to each other, your reporting is going to be patchy & teams will end up working with different numbers on the same metric.
By building a central data hub, standardising the key things that you want to measure, you can at least get a grip on a single version of the truth.
Data Quality – The Uncertainty Factor
Business intelligence depends on good quality data – but all too often, that just isn’t the case. Blank fields, duplicate records, and data that doesn’t quite fit together right can all undermine trust in your reports and lead to some pretty poor business decisions.
Quite a few banks respond to this by introducing some data validation rules, automated quality checks, and making sure that someone is ultimately responsible for the really important data assets before it even ends up in your reporting dashboard.
Regulatory Compliance & Governance – Good Housekeeping
Banks operate in a world that is full of regulations, where the reports have to not only be right, but also be visible and auditable right back to where the numbers came from. Basel IV, IFRS 9, DORA, and AML/KYC are all just a few examples of the rules that drive the need for good governance, solid documentation, and clear data provenance.
Having a robust governance framework, consistent definitions for the key things you’re measuring, and documented reporting processes is what helps financial institutions tick those boxes while also boosting confidence in their business reporting.
Legacy Systems – The Bane of the Banking Industry
Many financial institutions are still stuck with legacy applications that just weren’t designed to cope with modern analytics. Integrating these with newer banking platforms is a beast of a job, and often requires a lot of effort to make the data even remotely compatible.
Given the complexity, it often makes sense to do this in phases, making it easier to modernise reporting, all while still keeping the old systems running for now.
User Adoption – The Final Hurdle
Even the most brilliant dashboards are going to deliver zero benefit if your users are continuing to use spreadsheets or keep asking for manual reports. Getting business intelligence projects to deliver value really does depend on your users trusting the data, and being able to use it in their day to day decision-making.
By giving users dashboards that are relevant to their role, providing training and support, and making analytics accessible to them, you’ve got a much better chance of getting business teams to start making better use of the data at their disposal.
Business intelligence starts to deliver real value in four key areas: better decision making, operational efficiency, risk reduction, and an improved customer experience. These benefits are good for global banks, regional institutions and credit unions – although the scale of the implementation and the complexity of it all does tend to differ. Banks also measure BI success through concrete outcomes like faster reporting, lower operational costs, reduced fraud losses, and improved customer retention.

Make Better Business Decisions
Business intelligence gives banking teams near real time visibility into performance, risks and opportunities through interactive dashboards and self-service analytics. And that means executives and managers can drill down into live operational data on web and mobile dashboards to make faster decisions – all without being stuck with static PDF reports.
The real benefits of business intelligence comes from actionable insights – which are findings that directly support decisions – like adjusting loan pricing, realigning branch resources, or prioritising customer retention campaigns. And self-service BI also means non-technical users like branch managers and product owners can explore data for themselves without having to rely on IT teams to do every report request for them.
Enhanced Risk Management and Compliance
BI lets risk teams track KRIs, pick up early warning signs and get automated alerts when limits or thresholds are breached. And it also helps improve compliance processes by automating regulatory reporting, strengthening audit trails, and improving data lineage documentation. This is especially important for regulations like Basel III/IV, AML directives, GDPR and CCPA, where getting the reporting accurate and traceable is a must.
Operational Efficiency and Cost Optimisation
Banks use BI to identify inefficiencies in processes like loan approvals, account opening, collections, and dispute handling, by tracking turnaround times, rework rates and process bottlenecks. And that means operations teams can smooth out workflows and stop delays.
Many banks also ditch manual spreadsheet reporting for automated dashboards and scheduled reports – which really cuts down on administrative workload and reporting errors. And in practice that often leads to some real benefits like lower overtime costs, less IT maintenance effort, and more efficient staffing allocation based on demand patterns.
Improved Customer Experience and Retention
BI lets banks keep an eye on customer satisfaction, complaint resolution times, digital engagement and service level performance across branches, mobile apps, ATMs and contact centres. And that means teams can spot friction points and improve customer journeys.
Banks also use BI to pick up on customers who are at risk of churning, because of signals like declining balances, reduced app activity or increasing complaints. And that lets them launch proactive retention campaigns and more targeted engagement – especially for digital-first customers like Gen Z and millennials who expect fast, tailored banking experiences.
Business intelligence works in banking when you’ve got the right tech stack, which typically combines data sources, integration pipelines, storage platforms, analytics engines and visualisation tools into one reporting environment. And banks have to balance all sorts of things when choosing BI technologies – regulatory requirements, cloud adoption strategies, security controls, and integration with legacy core banking systems.
| Technology Layer | Purpose | Common Tools |
|---|---|---|
| Data Integration | Connects core banking systems, payment platforms, CRM, treasury, and compliance data. | Microsoft Fabric Data Factory, Azure Data Factory, Informatica, Talend |
| Data Storage | Stores structured and unstructured banking data for reporting and analytics. | Microsoft Fabric Lakehouse, SQL Server, Snowflake, BigQuery |
| Analytics & Processing | Cleans, transforms, and analyses large banking datasets. | Microsoft Fabric Notebooks, Databricks, Apache Spark |
| Business Intelligence & Dashboards | Visualises KPIs and supports operational and executive reporting. | Power BI, Tableau, Qlik Sense, Looker, Sisense |
| Real-Time Analytics | Monitors live transactions, fraud events, and operational activity. | Microsoft Fabric Real-Time Intelligence, Azure Event Hubs, Apache Kafka |
| Governance & Security | Manages data lineage, access control, auditing, and compliance. | Microsoft Purview, Microsoft Fabric, Collibra |
But from our experience, we’re seeing more and more banks and financial institutions using Microsoft Fabric as the foundation of their modern BI architecture. Fabric covers data engineering, data storage, real-time analytics, governance, automation and Power BI reporting in one platform, which is really valuable in banking, where large transaction volumes, strict security requirements and real-time monitoring all need to coexist.
Fabric Data Engineering and Notebooks
Fabric notebooks are often used by banking data engineering teams to build and maintain large-scale data pipelines. And banks usually use notebooks to pull data out of core banking systems, payment gateways, card processors, loan origination systems, treasury platforms and CRM tools, before consolidating everything into a centralised analytics environment.
In reality, banking teams are using Fabric notebooks to get work done – like tidying up transaction data, making sure customer IDs are standardised across all systems, enriching the data from AML monitoring systems, and crunching the numbers for things like liquidity coverage and credit exposure. Because notebooks can handle Python and Spark workloads, they make it dead-easy to process billions of banking records at scale without losing sight of the need for auditability and automation.
Fabric Real-Time Analytics
Real-time analytics in Fabric is starting to become super important for banks that need to be able to see what’s going on right now – whether that’s looking at operational activity, tracing fraud patterns, tracking payment flows, or keeping an eye on liquidity positions. By streaming data in from payment systems, online banking channels, ATM networks, and fraud detection platforms, you can do that analysis on the fly – no waiting around for overnight refreshes.
In the real world, banks use real-time analytics to keep an eye out for suspicious transactions, spot payment failures, track settlement exposures, and watch how intraday liquidity is being used up. So for example, treasury teams might be tracking live cash positions during major settlement windows, while fraud operations teams can spot unusual transaction spikes in seconds rather than hours.
Power BI for Banking Dashboards
Power BI remains the go-to for creating visualisations within Microsoft Fabric – and it’s widely used by executives, treasury teams, ops managers, risk departments, and compliance functions. Banks are using Power BI to build interactive dashboards covering stuff like profitability, liquidity, fraud detection, customer segmentation, mortgage risk, branch performance and regulatory reporting.
One of the big advantages of using Power BI in banking is self-service analytics. Business users can dive down into transaction-level detail, filter by branch, region, product or customer segment, and access those dashboards either on the web or on their mobile devices, all without relying on their IT teams for reporting updates. That can really cut down on reporting bottlenecks while speeding up decision-making.
Microsoft Activator for Real-Time Alerts
Microsoft Activator adds real-time monitoring and event-driven automation capabilities to the Fabric ecosystem. Instead of just looking at data, banks can use Activator to configure alerts and workflows to fire automatically when certain conditions come up.
So, for example, Activator might flag up to the fraud team when transaction volumes get too high, alert the treasury team when liquidity buffers are running low, or escalate operational incidents when payment processing is running behind schedule. In practice, that lets banks move away from passive reporting and towards more proactive operational management – with automated responses and faster escalation processes.
Governance, Security, and Compliance
Data analytics governance is a critical part of any banking BI environment – and Fabric provides all the security, access control and data lineage you need to keep things in order. Banking teams can control access to sensitive customer and financial data via role-based permissions, while still being able to see how datasets are created, transformed and consumed.
That’s particularly important for things like regulatory requirements – Basel III/IV, GDPR, AML directives, and internal audit controls. Data lineage tracking gives banks a clear trail of where regulatory numbers are coming from, while centralised governance reduces the risk of inconsistent reporting across departments.
Successful BI programs in banking require a clear data analytics implementation roadmap – it’s not just a case of throwing up some dashboards or buying some new tools. Banks that get the best results usually align their BI initiatives with their strategic priorities – like reducing risk, improving operational efficiency, driving customer growth or meeting regulatory reporting requirements. While the implementation typically takes a bit longer – 12-24 months – areas like governance, user adoption and data quality need to be evolving alongside the technical rollout.

To get started, banks should define the business problems they want BI to solve – like reducing non-performing loans, improving cross-sell rates, speeding up financial reporting or strengthening fraud detection. The best approach is to start off small, with a handful of high-value use cases like liquidity monitoring, credit risk dashboards or executive profitability reporting.
Each BI use case should have clear, measurable KPIs so the impact of the BI program can be tracked over time. It’s also a good idea to get business stakeholders from risk, finance, ops, treasury and marketing on board early on, to make sure the dashboards reflect real-world needs and to gain user buy-in.
Next up is consolidating and standardising banking data across all systems. This usually involves making an inventory of your data sources, building out ETL or ELT pipelines, defining data quality rules and making sure customer, account and product IDs are standardised across the organisation.
From our experience, many banks are now using Microsoft Fabric Lakehouses or Data Warehouses as the foundation for their architecture. Fabric notebooks and Spark pipelines are particularly useful for transforming transaction-level banking data, integrating payment systems and getting datasets ready for risk and treasury reporting. Most institutions start by building a focused analytics mart for a few strategic use cases before scaling up to a broader enterprise Lakehouse environment.
When it comes to selecting banking BI tools, you want to be looking for security, governance, scalability and integration capabilities. Some key features to consider include row-level security, auditability, support for complex financial calculations and compliance with regulatory reporting requirements.
Here’s how the main platforms banks evaluate stack up:
| Tool | Best For | Key Strength |
|---|---|---|
| Power BI | Banks on the Microsoft and Azure stack | Deep Fabric integration, strong governance via Microsoft Purview, cost-effective for Microsoft shops |
| Tableau | Visualisation-led teams and Salesforce CRM users | Best-in-class visualisation flexibility, large user community, strong self-service analytics |
| Qlik Sense | Enterprise banks needing complex data exploration | Associative engine lets analysts explore data without pre-defined query paths |
| Looker | Banks on Google Cloud or using BigQuery | Code-first LookML modelling enforces a single source of truth, strong embedding and API capabilities |
| Sisense | Banks building customer-facing analytics portals | Best-in-class embedded analytics, good for productised bank dashboards |
The right choice depends on your cloud provider, existing licences and team capabilities — many larger banks run more than one platform across different functions. From our experience, Microsoft Fabric and Power BI are becoming increasingly popular choices for banks on the Microsoft stack, as they integrate well with SQL Server, Azure, CRM systems and banking APIs while supporting both real-time and historical analytics. It’s always a good idea to pilot dashboards with real-world users and production-like data before wider rollout, to validate usability, performance and governance controls.
Getting users to actually use and love your Business Intelligence (BI) system is a huge part of making BI a success. And let’s be honest that varies wildly from executive to analyst to branch manager to operational team. Everyone has their own learning curve and their own needs when it comes to how they see data.
The banks that get this right are the ones that don’t treat their dashboards as some standalone reporting tool, but actually weave them into the fabric of every day banking. So for example, a Power BI dashboard becomes the wall board in a branch, or a crucial part of a treasury or CRM system. And users can get a quick glance at what’s going on without having to sit down and start digging through reports every time. Of course that means having a system in place for getting user feedback, and likewise for BI champions to come in an suggest changes as they’re needed.
BI has become a must-have for any smart bank. And it makes sense when you think about it – whether its credit risk, liquidity, or just keeping an eye on customer behaviour, BI is all about making better faster decisions. And that means less chance of making costly mistakes, and happier customers to boot. So as more and more data is coming in and out of banks, it makes sense that we’re seeing more and more turn to tools like Microsoft Fabric and Power BI to get their act together.
These are the kind of platforms that can bring all that data together in one place, make it all easy to use, and make it easier for managers to keep their eye on the big picture. With the right approach and the right tools, banks can turn what would otherwise be a mess of data into something really valuable. And if you’re looking to do the same, well, we’d love to hear from you. Get in touch, and we can talk about how our team can help you build a BI system that really makes a difference.
Banking analytics is about using data to spot trends, predict what’s coming and get real insights across lending, fraud, treasury and customer management. Most banking platforms today blend analytics with business intelligence, so you get reporting, dashboards and predictive insights all in one place.
Simply put, banking BI tells you what’s happening through reports and dashboards. Banking analytics takes it further by digging into the why and forecasting what’s likely to happen next. In practice most modern banking platforms do both, giving you a complete picture in a single tool.
The most popular options are Power BI, Tableau, Qlik, Looker and Sisense, which one works best really depends on your cloud setup, your team and what you’re trying to achieve. Bigger banks often end up running more than one across different parts of the business.
A focused first use case like a credit risk dashboard or liquidity report can usually be up and running in six to twelve weeks. A full enterprise rollout covering multiple areas typically takes twelve to twenty-four months, so most banks start small with two or three high-value use cases and scale from there.


