
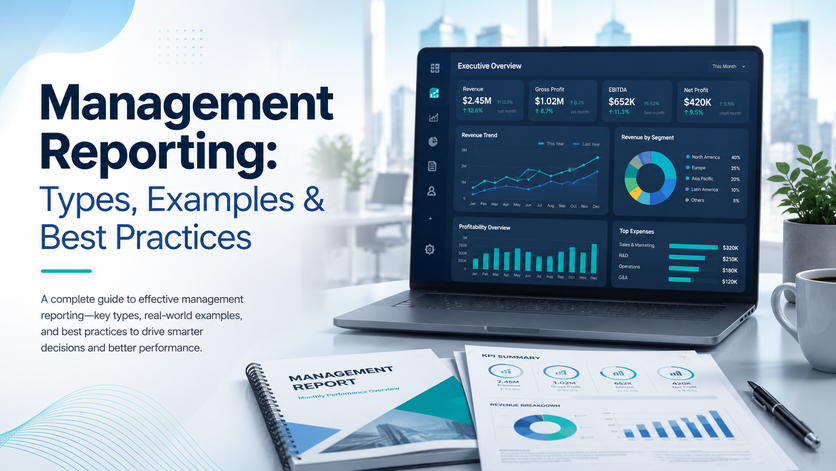
Management Reporting connects financial, operational, sales, and workforce data into one structured reporting framework, giving managers clear visibility over performance, risks, and growth drivers in real time. Management reporting is crucial for a successful business by providing the data needed for informed business decisions. Instead of relying on fragmented spreadsheets or isolated reports, organisations use managerial reporting to align departments around measurable KPIs and data-driven decisions. Managerial reports should take a wide variety of data and come in an easily understandable format. Keeping the report scannable is important for managers who need to quickly reference key information.
As a data visualisation consultancy, we have delivered 1,000+ custom reporting and dashboard solutions across finance, HR, sales, marketing, and operations functions. Our team has built executive dashboards, P&L reports, workforce analytics tools, sales pipeline trackers, and operational performance dashboards that help organisations strengthen control, improve forecasting, and scale sustainably.
In this article, we explain what managerial reporting is, why it is important for business performance, and the key components every effective management report should include. We also cover different types of managerial reports by function, outline how to create them properly, and highlight common mistakes to avoid when building reporting frameworks.
Managerial reporting refers to the process of collecting, analyzing, and presenting organizational performance data to facilitate strategic decision-making. It focuses on translating operational and financial information into structured reports that help managers understand how different parts of the organisation are performing.
The management team is the primary audience for these reports, as they rely on them for oversight and decision-making. These reports show not only what has happened, but also why it happened and what actions may be required.
Management reporting is usually delivered on a regular basis such as monthly, quarterly, or weekly, depending on the function and business needs.
It is important to distinguish management reports from financial reports. Financial reports, such as the balance sheet, income statement, and cash flow statements, are standardized, external documents that provide a backward-looking view of the company’s financial position and are essential for compliance and stakeholder analysis. In contrast, management reports are tailored for internal use and focus on actionable insights for all departments, not only finance.
The purpose of managerial reporting is not to list activities, but to highlight performance drivers, risks, and opportunities. Effective reports separate signal from noise. They focus on trends, variances against targets, and areas that require intervention. A thoughtful, organized, and methodical approach is the best way to handle writing a management report.
The two are often confused because they draw on the same underlying data, but they serve different masters. Financial reporting looks backwards and outwards: it tells investors, lenders, and regulators what happened, in a format governed by accounting standards. Management reporting is primarily a forward-looking or real-time internal reporting: it tells your leadership team what’s happening now and what to do about it, in whatever format drives the best decisions. This is where business intelligence in finance plays an important role, helping organisations combine financial and operational data into interactive reports that support faster decision-making.
| Management Reporting | Financial Reporting | |
|---|---|---|
| Primary audience | Internal: executives, department heads, boards | External: investors, lenders, tax and finance regulators |
| Purpose | Support decisions, track performance, plan ahead | Demonstrate compliance and financial position |
| Rules & standards | None. Structured however the business finds useful | Governed by GAAP, IFRS, or local standards |
| Frequency | Weekly, monthly, or real-time dashboards | Quarterly and annually, tied to statutory deadlines |
| Scope | Granular: by product, team, region, customer, project | Whole-entity view of the business |
| Time orientation | Forward-looking: forecasts, budgets, scenarios | Historical: what happened in the closed period |
| Content | KPIs, non-financial metrics, commentary, forecasts | Income statement, balance sheet, cash flow statement |
| Legally required? | No, optional but essential for good management | Yes, for most registered companies |
| Audited? | No | Often, depending on company size |
The practical takeaway: you can’t run a business on financial reports alone. By the time statutory accounts are filed, the story they tell is months old. Equally, management reports won’t satisfy your auditors or regulatory bodies. Mature finance functions treat them as complementary, using one detailed source for the data, then shaping it differently for each audience.
Managerial reporting is essential for maintaining visibility, control, and direction across a business. It provides structured insights into financial, operational, sales, and workforce performance, allowing managers to understand what drives results. Instead of relying on assumptions, leaders make decisions based on measurable data.
Managerial reporting is important for:
By highlighting variances, trends, and performance drivers, managerial reporting supports faster and more confident decision-making. It helps managers adjust strategies, reallocate resources, and address risks before they escalate.
Management reporting strengthens business performance by aligning teams around clear metrics, improving accountability, and enabling structured growth. It turns data into a practical management tool that supports efficiency, profitability, and long-term sustainability.
Strong management reporting is not about presenting large volumes of data. It is about structuring the right information so managers can assess performance quickly and decide what action to take. Effective reports present data in a clear and meaningful way, integrating both financial and operational business intelligence to enhance decision-making and overall business performance. Reports focus on clarity, relevance, and forward-looking insight.
An effective management reporting structure should include:
When these components are combined, managerial reporting becomes more than a performance summary. It becomes a structured decision-support system that improves accountability, transparency, and strategic alignment across the organisation.
Managerial reporting is not one-size-fits-all. Different departments require different perspectives, metrics, and levels of detail to support decision-making. Executive teams focus on strategic performance, finance monitors profitability and cost control, HR oversees workforce stability, sales tracks revenue generation, and operations manage efficiency and capacity.
Below are the main types of managerial reports used across organisations, with examples of how structured dashboards support performance monitoring, transparency, and data-driven management in each function.
Executive reports give C-level leaders a single, high-level view of overall business performance. They are designed for CEOs and senior executives who need to monitor the health of every department without reviewing multiple reports. The goal is to highlight where attention is required and enable strategic decisions.
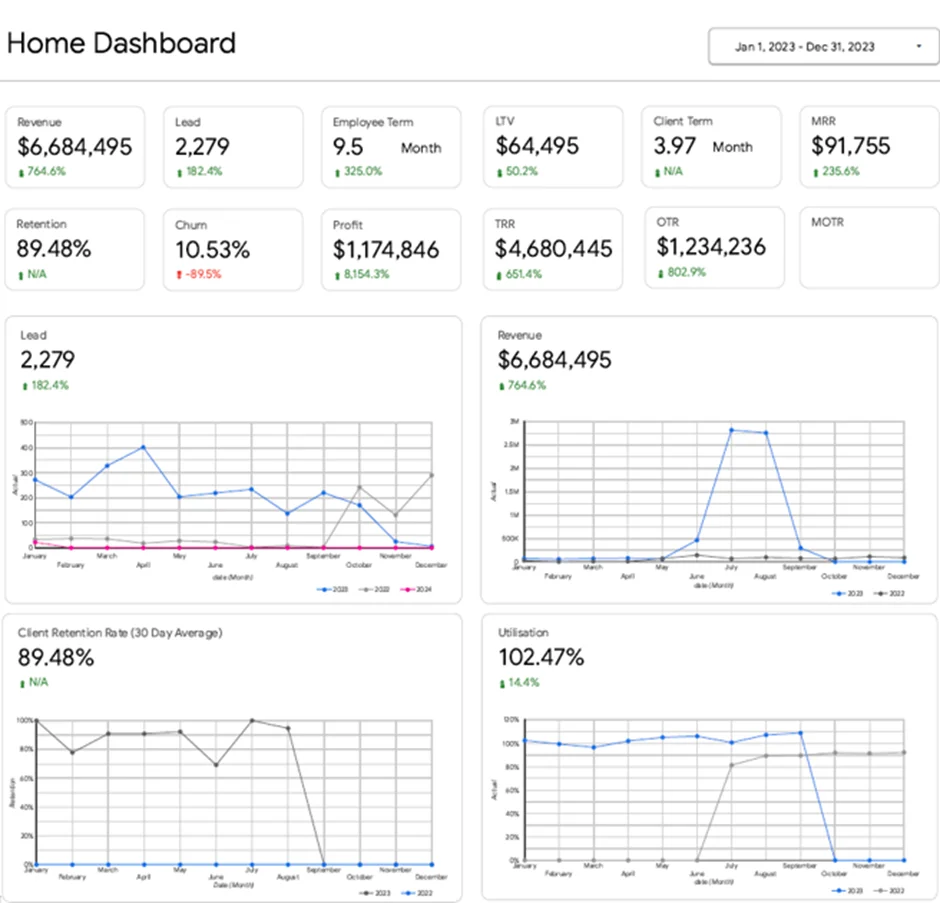
Metrics: Revenue, Profit, Number of Leads, Monthly Recurring Revenue (MRR), One-Time Revenue (OTR), Client Retention Rate, Churn Rate, Employee Utilisation, Employee Retention Term.
Our Power BI expert developed an executive dashboard that analyses overall business performance across all core functions. It highlights revenue growth, sales predictability, marketing effectiveness, client stability, and workforce capacity. Each metric is interactive and linked to a supporting departmental dashboard, enabling the CEO to drill into campaign results, client performance, or team-level analysis whenever deeper insight is required.
This structure supports a clear executive workflow. If leads decline month over month, the CEO can immediately review marketing channels and adjust budget allocation. If client retention drops, leadership can identify affected accounts and intervene early. If utilisation exceeds 100%, it signals capacity pressure and supports hiring or subcontractor decisions. The dashboard supports executive prioritisation, resource allocation, and early identification of operational risks.
Financial management reports are designed to monitor profitability, cost control, cash flow, and overall financial stability of the business. They are used by finance managers and department heads to track performance against budgets, protect margins, and ensure sustainable growth. These reports provide structured visibility into how revenue, expenses, and capital are managed across the organisation.
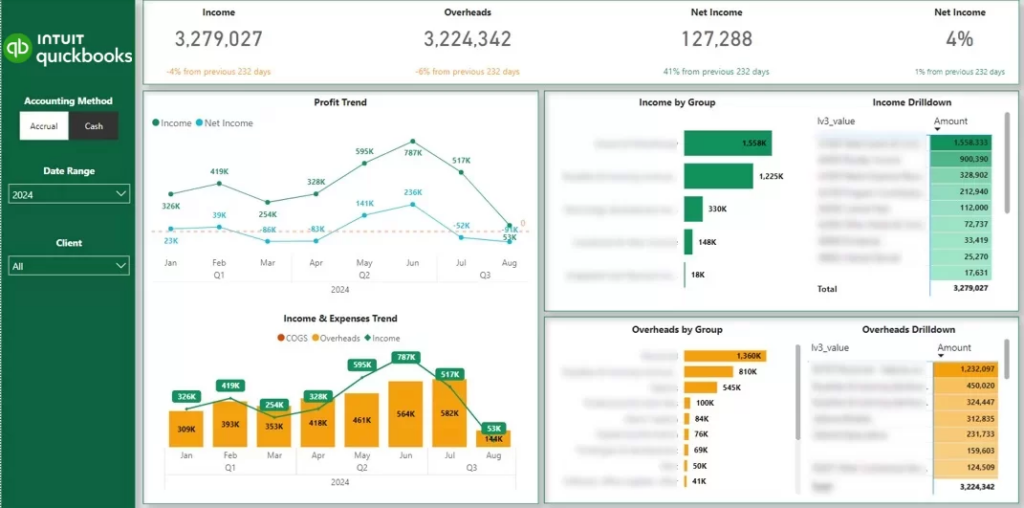
Metrics: Income, Overheads, Net Income, Profit Trend, Income Trend, Expense Trend.
Our data visualisation experts developed a financial management dashboard that analyses monthly trends in income and expenses and breaks them down by account and underlying transactions. Users can switch between accrual and cash accounting methods, filter by client, and apply class filters to review departmental performance. It clearly shows what drives revenue, where overheads are increasing, and how net income evolves over time.
The dashboard benefits the finance department by improving cost control and financial transparency. It helps managers identify unusual expense spikes, track profitability by department, and monitor whether income growth offsets rising overheads. With structured monthly analysis and transaction-level visibility, finance teams can manage budgets more accurately and support more informed financial planning. Follow this guide to install this dashboard.
HR management reports are designed to monitor workforce structure, staffing trends, employee performance, and retention across the organisation. They are used by HR managers and operational leaders to ensure the business has the right people, with the right skills, in the right roles. These reports provide structured visibility into workforce capacity, stability, and cost.
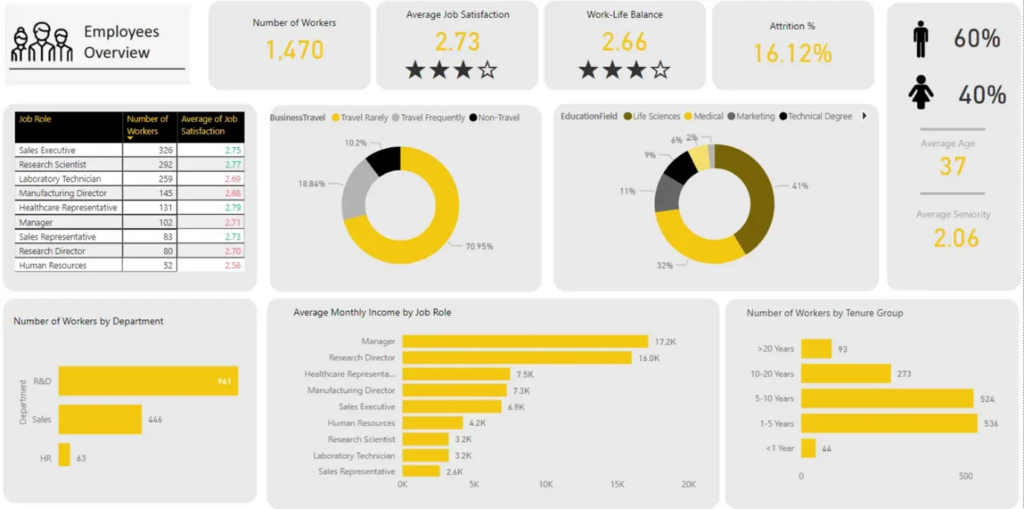
Metrics: Total Headcount, Headcount by Department, Headcount by Job Role, Gender Distribution, Average Age, Education Level, Average Monthly Income by Role, Headcount by Tenure.
Our business intelligence specialists created a dashboard that analyses workforce composition and its evolution over time. It breaks down headcount by department and job role to show how teams are structured and where staffing levels are increasing or declining. Demographic insights such as gender distribution, age, and education provide visibility into workforce diversity and profile. Salary analysis by job role highlights cost concentration areas, while tenure distribution shows how long employees remain in the organisation.
The dashboard benefits the HR department by improving workforce transparency and planning accuracy. It helps identify departments with rapid growth, roles with high cost impact, and areas where retention may require attention. By combining structural, demographic, and cost insights, it supports data-driven hiring, budgeting, and talent management decisions.
Marketing management reports are designed to monitor revenue generation, gross sales, orders, lead performance, and campaign effectiveness. They are used by sales managers, marketing managers, and revenue leaders to track how marketing activity translates into pipeline growth and closed deals.
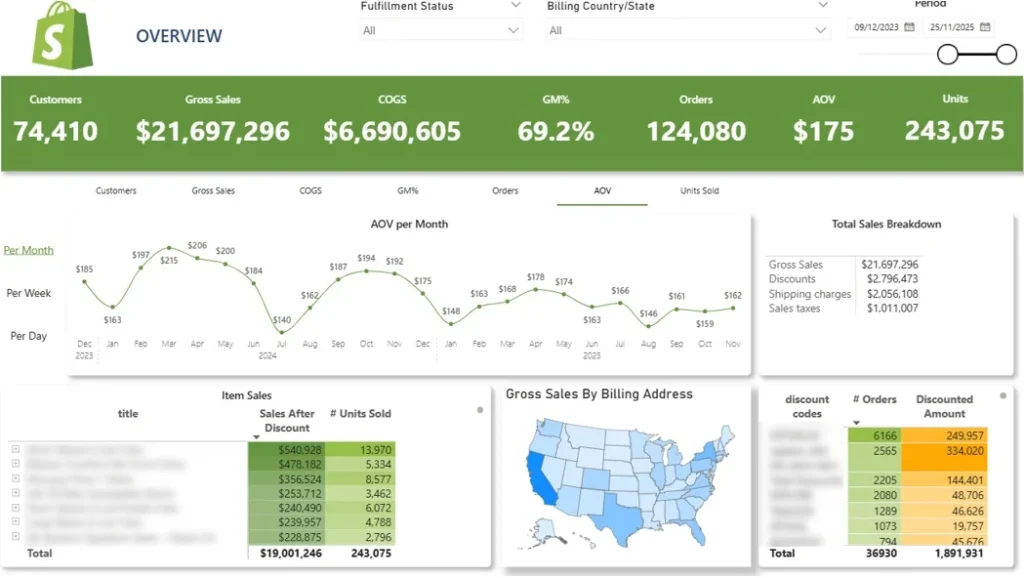
Metrics: Av. Customer LTV, Av. Orders per Customer, Av. Days to Reorder, New vs Returning Gross Sales, Customers and AOV, Customers by Number of Orders, Av. Days Since Last Order, Returning Customers % per Month, LTV Growth by Year, Cohort Analysis (LTV), Average Customer LTV by State.
Our marketing analysts built a Shopify dashboard that measures customer lifetime value at the top level and breaks it down by cohort, order frequency, and location. It compares new and returning customer segments across gross sales, customer count, and average order value, showing how much revenue depends on repeat purchasing. The cohort analysis tracks how LTV builds month by month after first purchase, while reorder timing charts reveal how quickly customers come back and when they’re likely to churn.
The dashboard benefits ecommerce and retention teams by making repeat purchase behaviour visible and measurable. It helps identify how quickly cohorts mature, when to trigger reorder campaigns, and which regions produce the most valuable customers. By combining LTV, retention, and cohort analysis in one structured view, it supports smarter acquisition spend and more predictable revenue growth.
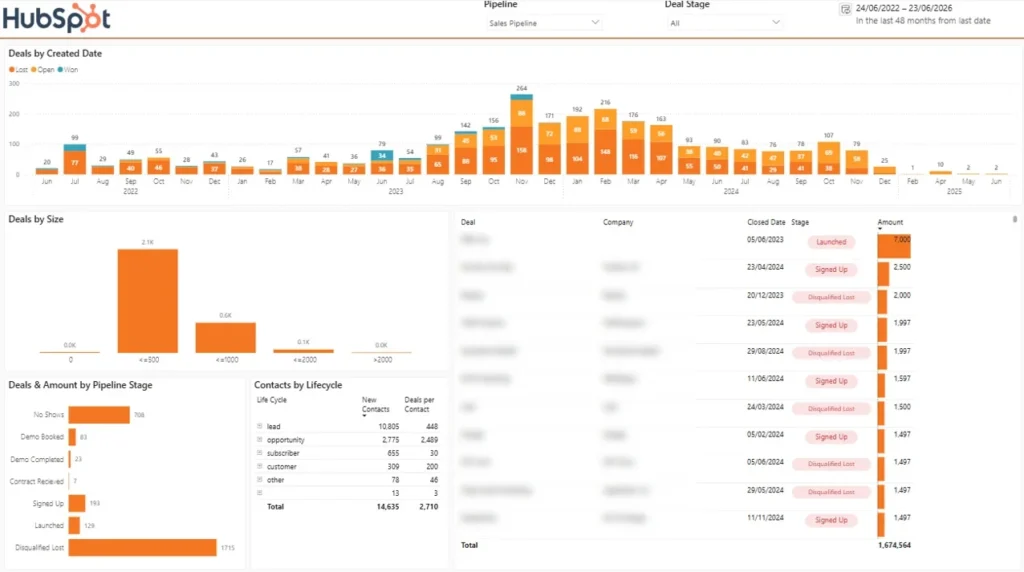
A sales report connects marketing activity, pipeline health, and revenue in one view, and this HubSpot dashboard shows the four views every good one combines. Deal flow over time is your early warning system: a shrinking bar predicts a revenue problem two quarters before it hits the P&L.
Deal size distribution reveals your growth model, whether revenue comes from volume and speed or from a few large deals. Pipeline conversion exposes where deals die, pointing to the stage where a fix would do more for revenue than any new lead generation.
Lifecycle context ties sales back to marketing by showing conversion across the full journey, while the deal-level table provides drill-down when someone questions a number. The takeaway: combine trend, distribution, conversion, and drill-down, because any single view can mislead. Follow this video guide to install our Hubspot dashboard template!
Operations dashboards are designed to monitor process efficiency, resource utilisation, and operational stability across the business. They provide structured visibility into how day-to-day activities align with demand, capacity, and performance targets. These reports help operations teams maintain control, anticipate issues early, and ensure that workflows run smoothly without unnecessary bottlenecks or resource imbalances.
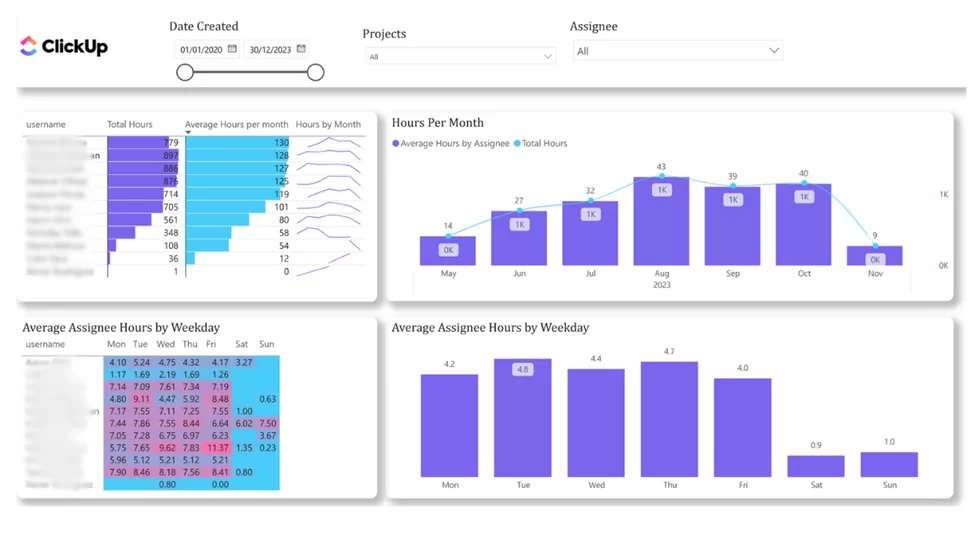
Metrics: Total Hours by Assignee, Average Hours per Month, Hours by Month Trend, Team Hours Per Month, Average Assignee Hours by Weekday.
Our BI specialists built a ClickUp time tracking dashboard that analyses logged hours at the team level and breaks them down by assignee, month, and weekday. Each team member’s total hours are shown alongside their monthly average and a trendline of activity over time, making workload distribution immediately visible. A weekday heatmap reveals individual working patterns, while the monthly view tracks how team capacity fluctuates across the year, with filters for project, assignee, and date range.
The dashboard benefits project and resource managers by making team utilisation transparent and comparable. It helps identify overloaded and underutilised team members, spot declining engagement early, and balance work across projects before deadlines slip. With structured, person-level visibility into time data, managers can plan capacity accurately, bill client hours confidently, and keep delivery on schedule.
Follow this video guide to install this template
Data analytics best practices help organisations produce reports that are clear and easy for leadership teams to interpret. When reports are structured properly, managers can quickly understand performance trends and make informed decisions.
Some of the most effective management reporting best practices include:
Start with the decision, not the data: Before building a report, ask what the reader needs to decide. A board reviewing runway needs cash flow and burn rate, not a breakdown of software subscriptions. Work backwards from the decision to the metrics.
Limit each report to 5-7 key metrics: Cramming 30 KPIs into a dashboard guarantees none get attention. Pick the handful that reflect performance against strategic goals, and move everything else to an appendix or on-demand view.
Pair every number with context: “Revenue: £480k” means little on its own. “Revenue: £480k, up 12% on last quarter, 4% below target” tells a story. Always show comparisons against budget, prior period, or forecast.
Standardise the format and cadence: Reports lose value when readers relearn the layout every month. Fix the structure, the definitions, and the delivery schedule, whether that’s weekly flash reports or monthly packs, so trends become visible over time.
Automate the data pipeline: Manual copy-paste from spreadsheets introduces errors and eats hours. Connect reports directly to source systems so figures are current and consistent, and free your team to spend time on analysis instead of assembly.
Add commentary from a human: Numbers show what happened; only people can explain why. A short written summary of drivers, risks, and recommended actions is often the most-read part of the report.
Review the report itself quarterly: Businesses change, and reports should too. Retire metrics no one acts on and add ones that reflect new priorities.
Get these right and your reports stop being a monthly ritual and start being a management tool.
The future of management reporting is being shaped by rapid advancements in technology, data analytics, and business intelligence. As organizations increasingly embrace data-driven decision making, management reporting will become even more integral to business success and growth. Artificial intelligence, machine learning, and predictive analytics are set to play a larger role, enabling managers to forecast trends, identify new opportunities, and proactively manage risks.
Cloud-based reporting tools will further enhance collaboration, automation, and real-time access to critical information, making it easier for managers to analyze data and share insights across departments. As the business landscape evolves, management reporting will continue to support strategic decision making, helping organizations stay ahead of the competition and achieve their long-term goals.
By staying at the forefront of these technological advancements, managers can ensure that their reporting frameworks remain agile, insightful, and essential to driving business growth and success in an increasingly data-driven world.
Creating an effective managerial report requires a structured and practical approach. The goal is not to present large amounts of data, but to provide clear insights that support performance improvement.
1. Define the Objective: Start by clarifying the purpose of the report. What business question should it answer? Which decision will it support? Align the report with specific departmental or organisational goals.
2. Select the Right KPIs: Choose a focused set of relevant performance indicators. Each department requires different metrics, so select KPIs that directly reflect the objectives being measured. Avoid overloading the report with unnecessary data.
3. Collect and Validate Data: Gather data from reliable systems such as ERP, CRM, accounting, or HR platforms. Ensure consistency and accuracy by cross-checking sources. Automated data integration improves reliability and reduces manual errors.
4. Structure the Report Clearly: Organise the report into logical sections: objectives, KPI performance, trend analysis, and key insights. Keep it concise and scannable.
5. Use Visualisation: Charts, dashboards, and summary tables make trends and anomalies easier to understand. Visual clarity improves speed of interpretation and supports faster decision-making.
6. Automate and Continuously Improve: Where possible, automate data refresh and report generation using BI tools. Regularly review the report’s structure and KPIs to ensure it remains aligned with business priorities.
Spreadsheets can carry a business surprisingly far, but they break down at scale: version chaos, formula errors, and hours lost to manual assembly every month. A management reporting system solves this by connecting directly to your source data, from accounting platforms, CRMs, and operational tools, and turning it into automated, repeatable reports.
The market splits into a few distinct categories, and the right choice depends on your size, data complexity, and who’s consuming the reports.
| Category | What it does | Example tools | Best for |
|---|---|---|---|
| Spreadsheets | Manual, flexible modelling and reporting | Excel, Google Sheets | Startups and simple, ad-hoc reporting |
| Accounting add-ons | Automated report packs built on your ledger data | Fathom, Syft, Spotlight Reporting | SMBs on Xero, QuickBooks, or Sage wanting fast wins |
| Business intelligence (BI) | Interactive dashboards across any data source | Power BI, Tableau, Looker Studio | Companies needing custom, cross-functional dashboards |
| FP&A platforms | Budgeting, forecasting, and reporting in one place | Cube, Datarails, Vena, Anaplan | Mid-market finance teams outgrowing spreadsheets |
| ERP reporting modules | Native reporting inside your ERP | NetSuite, Dynamics 365, SAP | Larger firms wanting one integrated system |
A few buying criteria matter more than the feature checklists suggest. Integration depth comes first: a tool that syncs automatically with your accounting system beats a more powerful one that needs CSV uploads. Then consider who builds the reports, as BI and ad-hoc reporting tools assume analyst skills while accounting add-ons work out of the box. Finally, check that the system handles drill-down, so when a board member asks why a number moved, you can answer in the meeting rather than promising a follow-up email
Even well-intentioned managerial reporting can lose impact if it is poorly structured or overly complex. Avoiding common mistakes ensures reports remain actionable, relevant, and aligned with business objectives.
Avoiding these mistakes ensures management reporting remains focused, reliable, and aligned with decision-making needs. Effective reports simplify complexity, highlight what matters most, and drive meaningful action.
Management reporting is not just about tracking numbers. It is about creating clarity across the organisation. When structured correctly, it connects strategy with execution, aligns departments around measurable KPIs, and enables faster, more confident decision-making.
Whether you need executive dashboards, financial performance reports, HR analytics, sales pipeline visibility, or operational control, the right reporting framework turns data into a competitive advantage. It improves accountability, strengthens forecasting, and helps leaders act before small issues become major risks.
If you are ready to strengthen your managerial reporting framework, our Business Intelligence consulting team can design and implement the dashboards and reporting systems to do it. We design and implement custom Power BI dashboards and reporting systems tailored to your business structure and decision-making needs.
Contact us to discuss how we can build a scalable managerial reporting solution for your organisation!
Management reporting is the process of collecting business data and presenting it to internal decision-makers, executives, department heads, and boards, so they can track performance and act on it. Unlike statutory financial reports, management reports follow no prescribed format: they combine financial figures, KPIs, and commentary in whatever structure best supports decisions. A typical example is a monthly pack showing revenue against budget, cash position, and key operational metrics, with notes explaining what drove the results.
A strong management report includes five core elements: a headline summary of performance and key issues, 5-7 KPIs tied to strategic goals, financials with comparisons (versus budget, prior period, and forecast), forward-looking figures such as cash flow projections or pipeline, and written commentary explaining drivers, risks, and recommended actions. The exact mix depends on the audience: a board pack leans strategic, while a departmental report goes deeper into operational detail.
Monthly is the standard cadence for full management packs, timed to land within 5-10 working days of month end so the data is still actionable. Many businesses supplement this with weekly flash reports covering fast-moving metrics like cash, sales, and pipeline, and real-time dashboards for anything that needs daily attention. The right frequency follows the speed of decisions: report as often as the numbers can realistically change someone’s actions, and no more.
In practice, nothing. “Managerial reporting” and “management reporting” are used interchangeably to describe internal performance reporting. The slight distinction some draw is that managerial reporting is the umbrella discipline (rooted in managerial accounting) while management reports are the specific documents it produces, but you’ll see the terms swapped freely, and no standard separates them.


