
Private Equity has become an even more cutthroat game since about 2020. Higher interest rates, even more competition for quality assets, and tighter margins have forced firms to make faster & more on-point investment decisions. As a result, data analytics is no longer “optional” for private equity firms – it’s now a crucial competitive advantage when it comes to sniffing out good deals, stepping up portfolio performance, & getting exit valuations that are on point.
The goal of private equity data analytics is to help firms find attractive investments sooner, get a more accurate read on risk, improve portfolio company performance, constantly monitor value creation, and get businesses ready to exit at just the right time. Today, more and more private equity firms are bringing in-house or working with outside data analytics partners to support these kinds of activities. If you are looking at that second route, our guide to the top data analytics companies covers the main providers and where each one fits. This lets investment teams see whether operational initiatives are actually kicking in and increasing profitability, growing revenue, and building equity value across the portfolio.
At Vidi Corp, our BI consultants have been helping pro investors, operating partners, and portfolio companies build custom dashboards in Power BI & Looker Studio. Our dashboards bring together financial, operational, sales, and customer data into one place, allowing investment teams to keep tabs on company performance in real time. In this article, we’ll look at the main private equity data analytics use cases and break down how firms are using dashboards to inform investment decisions and drive value creation.
Private equity decision-making has changed a lot over the last decade. Before 2015, most firms relied on spreadsheets, email chains with CIMs, and manually updated reports to figure out investments and keep an eye on portfolio companies. Today, private equity firms are increasingly working on cloud-based data infrastructure that’s supported by APIs, automation, and business intelligence dashboards.
The old private equity workflows were often a mess and slow. Investment teams were juggling scattered Excel models, manually consolidating portfolio company data, and emailing reports around in loops. Portfolio companies were often submitting inconsistent financial and operational data, making it tough to compare performance across investments or react quickly to problems. All these processes were creating delays during due diligence and upping the risk of reporting errors.
Modern private equity firms are using centralized data warehouses, standardized governance frameworks, automated data pipelines, and real-time dashboards to keep an eye on fund, deal, and portfolio company performance all the time. AI and machine learning are being used to automate jobs like document extraction, anomaly detection, and data classification – while investment pros are still responsible for making strategic judgments & investment calls. These new decision-making models let firms get in and out of deals faster, improve due diligence quality, and react quicker to operational or market changes across the portfolio.
Here are some success stories in the world of private equity data analytics. These are the most common data analytics requests that we receive from our customers in the private equity industry. However, there is also a lot of company-specific ad-hoc analytics that can be created for individual companies.
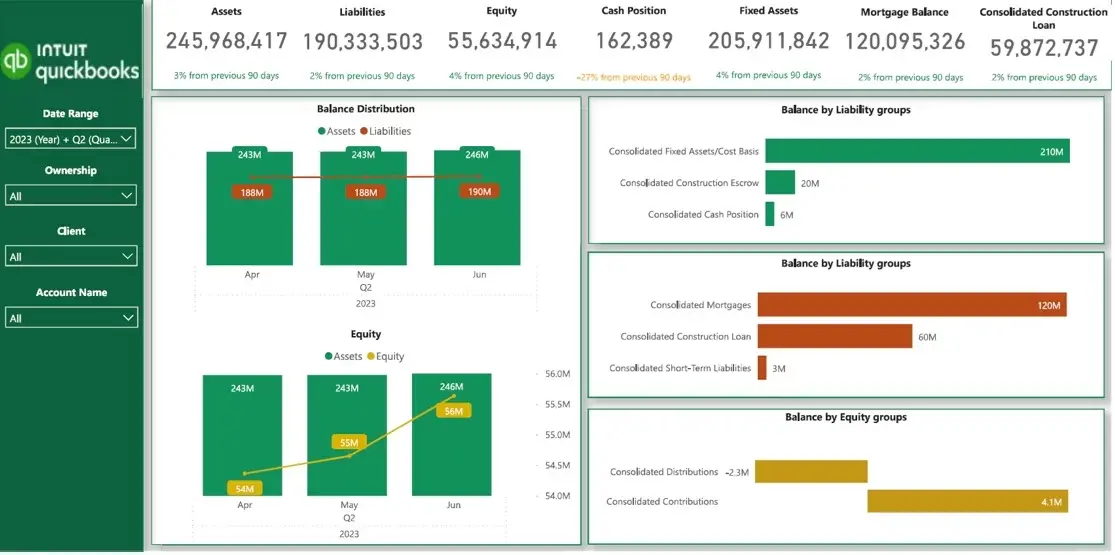
We worked with private equity-backed businesses to build Power BI balance sheet dashboards that help leadership teams monitor financial stability and identify risks in the asset and liabilities mix. These dashboards are especially valuable in industries like real estate and construction, where large mortgages and asset valuations play a major role in determining business performance and equity growth.
Balance sheet analysis is an important part of private equity portfolio monitoring because leverage can either increase returns or create significant financial risk. Our dashboards help investment teams analyse cash reserves, debt exposure, retained earnings, and overall balance sheet structure in one centralized view. Users can monitor how much operational runway current cash reserves provide, identify the main creditors across the business, and evaluate whether retained earnings are growing over time.
The dashboard also helps private equity firms understand whether portfolio companies are strengthening their financial position or becoming overleveraged. This makes it easier to monitor liquidity risk, assess refinancing requirements, and evaluate opportunities to reinvest retained earnings into future growth initiatives.
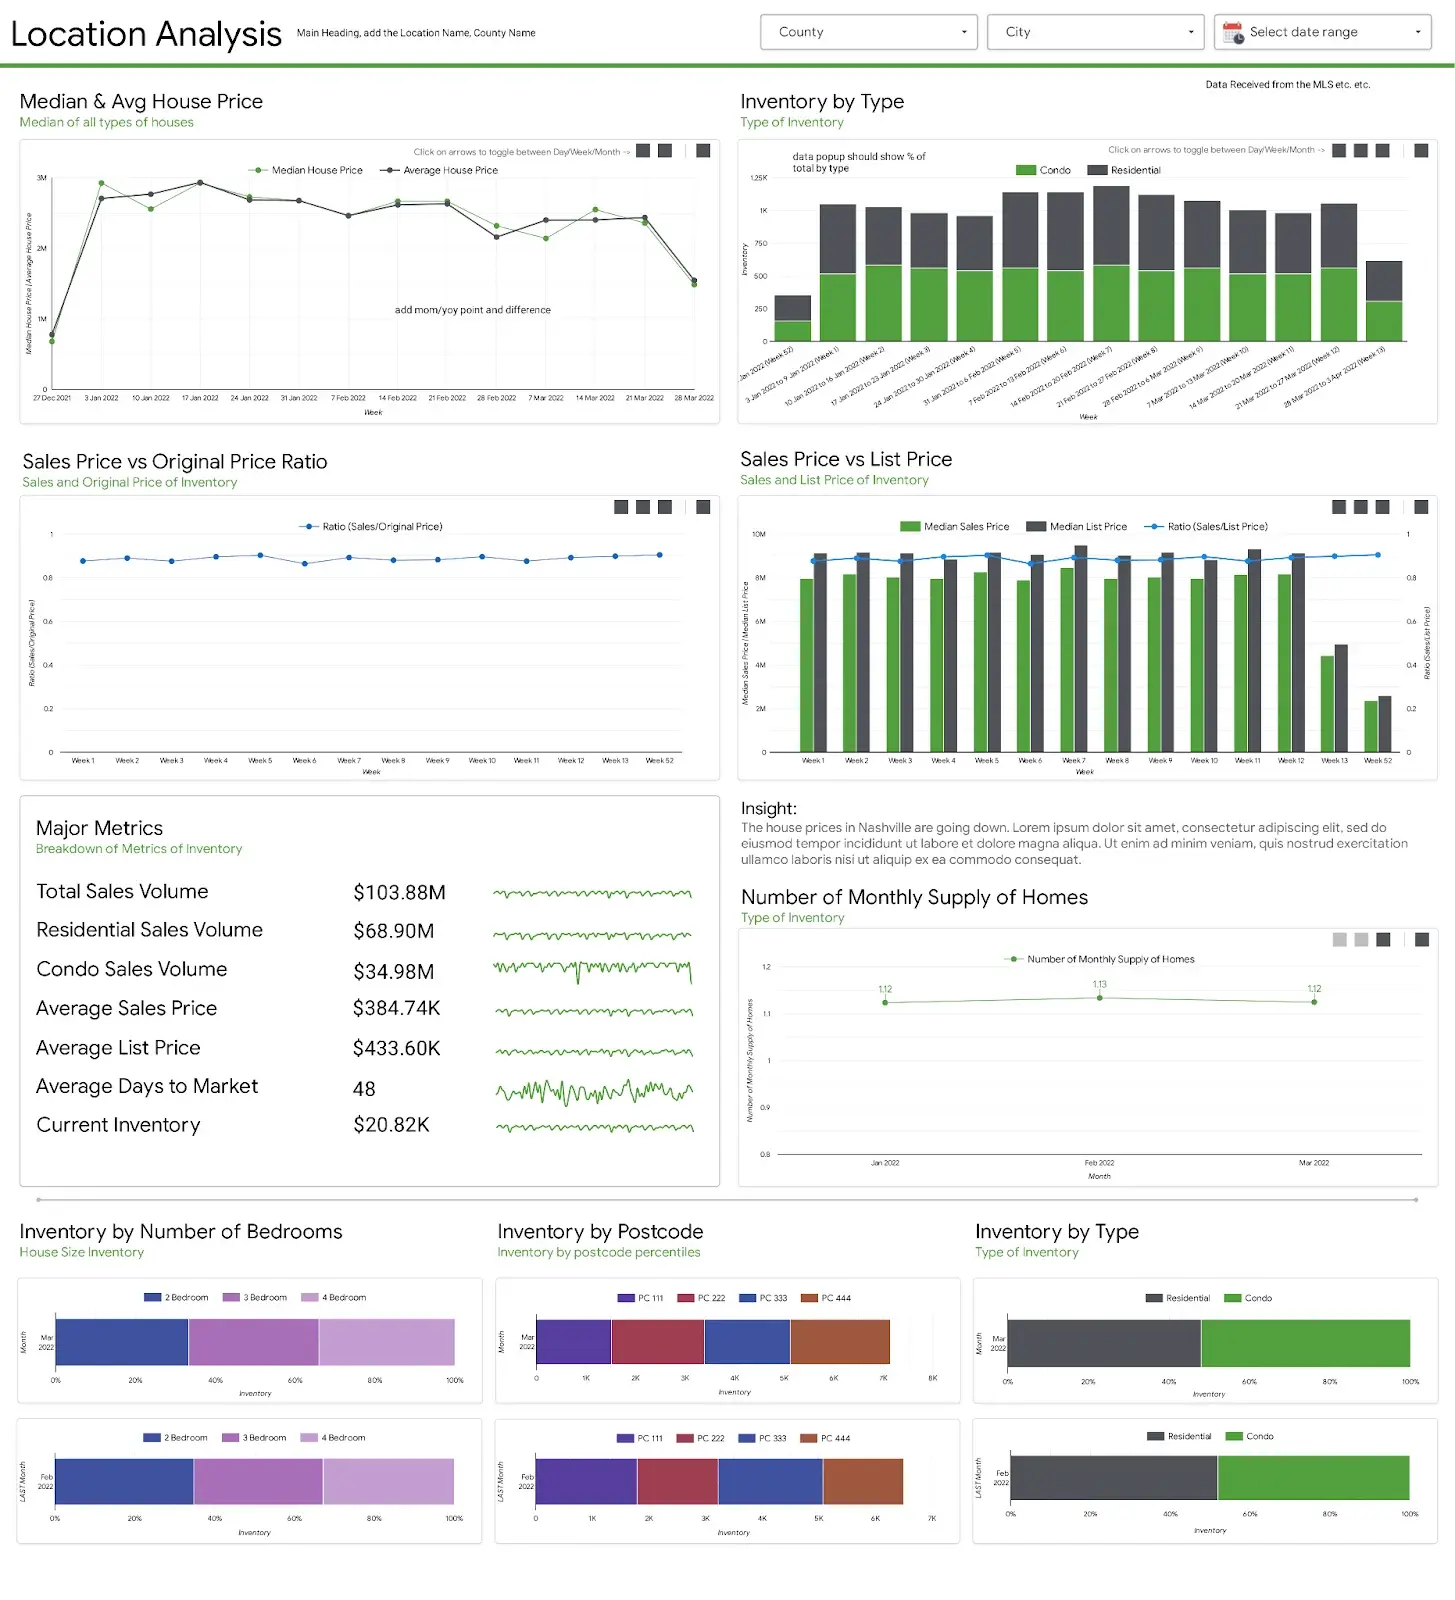
We worked with a real estate company to build custom real estate investor reporting showcasing their proprietary real estate algorithm. This algorithm identifies metropolitan statistical areas (MSAs) that are positioned to see superior single-family housing appreciation.
Location analysis is a key part of real estate investor reporting because property prices and demand vary significantly between neighbourhoods. Investors need location-level insights to understand market conditions and make informed investment decisions. Our data visualization experts built a Location Analysis dashboard that lets users see average property prices by home type and location, making it easy to compare different neighbourhoods and identify areas with higher or lower market values. It even tracks local market activity to give an estimate of the typical time it takes to buy or sell properties in each area.
Our dashboard lets agents and investors do things like benchmark individual properties against local market averages and see demand patterns across different locations. This helps them make stronger offer decisions, set realistic expectations with clients, and get a better handle on the timing of property transactions.
One of the key benefits of this dashboard is more accurate market positioning. With clear insights into pricing trends and demand by location, investors can make stronger offer decisions, set realistic expectations for clients, and get a better sense of when to step up property transactions.
Business growth dashboards help private equity firms keep an eye on the overall state and growth trajectory of their portfolio companies in real time. These are usually used by operating partners, investment teams and the odd portfolio company executive to get a glimpse of how every area of the business is performing from one single vantage point. That includes revenue growth, profitability, customer acquisition, operational efficiency, hiring progress and strategic initiatives. And of course you can also use them to see how individual business units, departments or partners are doing, and compare the results with each other across the portfolio.
For example, our Tableau consultants developed custom executive dashboards that took operational and financial data from multiple systems and chucked it all into a centralised reporting environment. The dashboards let leadership teams track week by week how the company was doing, keep an eye on progress towards strategic milestones and evaluate KPIs for finance, operations, marketing and sales in real time. You could also drill down into specific regions, business units or leadership teams to spot areas that were growing faster than expected and those that might need some intervention. Another big plus was that data was automatically pulled in through APIs and cloud databases, so reporting was always up to date and accurate.
These kinds of data visualization dashboards make a big difference to how private equity firms manage growth post-acquisition. Gone are the days of waiting for the monthly reports to come in – now executives can see straight away whether the business is hitting the key growth targets and whether operational initiatives are actually delivering results. Investment teams can keep an eye on the company’s performance week to week, compare how each partner is contributing and spot any risks before they start to impact the valuation. One Vidi Corp client managed to get a 40% faster turnaround on critical decisions by implementing real-time analytics dashboards. Another cut their reporting preparation time by over 50% by automating the workflow. All this means they can focus more on growing the portfolio and less time stuck in the office manually juggling data.
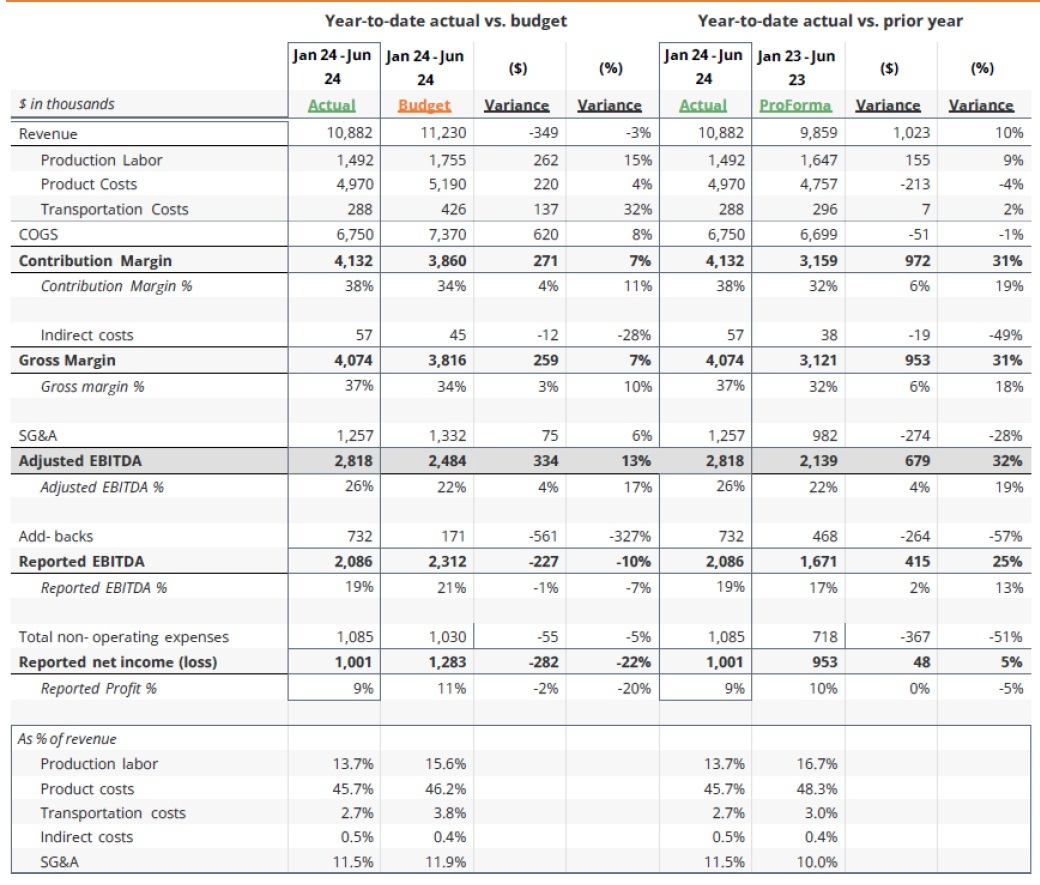
Financial business intelligence helps private equity firms keep a close eye on the financial health and operational efficiency of their portfolio companies – all in real time. This type of thing is usually used by operating partners, CFOs and investment teams to get a good idea of how every area of the business is performing against budget, the previous year’s results and growth targets. For instance, one private equity firm acquired a bunch of companies that provided meals to schools and daycare centres and the leadership needed a clear view of revenue growth, food production costs, labour efficiency and profitability across several different businesses.
This dashboard gives a detailed side-by-side comparison of actual performance vs. budget and the previous year’s results. Executives can see right away whether the acquired companies are meeting the key financial targets and identify areas that need some attention. The data includes revenue, production labour, product costs, transportation costs, SG&A, contribution margin, gross margin, EBITDA and net profit. Because the dashboard shows both dollar and percentage variances, investment teams can quickly spot which rising costs are eating into profitability and which operational improvements are driving stronger margins. And down at the bottom, the dashboard also compares costs as a percentage of revenue, giving leadership a good idea of how the whole portfolio is performing.
These kind of managerial reporting gives private equity firms much better post-acquisition management and financial oversight. Investment teams can keep an eye on company growth week to week, check if the portfolio companies are hitting their integration and profitability targets and compare performance across multiple food service businesses. The dashboard also helps leadership identify which operational areas have the biggest impact on EBITDA performance, so they can prioritise cost optimisation and growth initiatives more effectively. One Vidi Corp client reported a 40% faster turnaround on critical decisions after implementing real-time executive dashboards. Another cut their manual reporting time by over 50% through automated workflows. This all means they can focus on scaling profitable operations while keeping a tight grip on margins and costs.
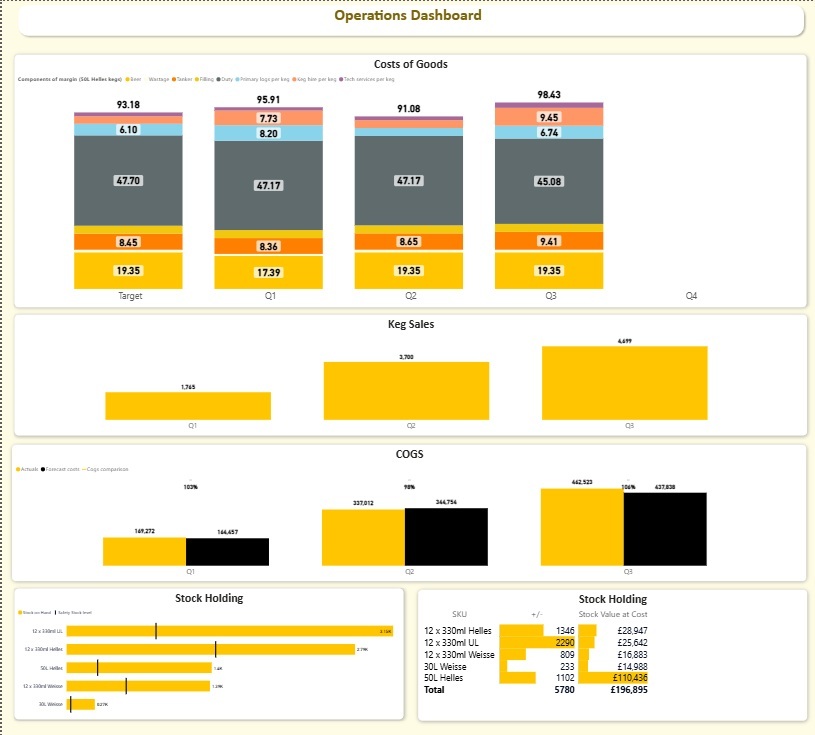
Operational business intelligence helps private equity firms keep a close eye on the day to day performance drivers that have a direct impact on profitability and cash flow across their portfolio companies. They’re used by operating partners, finance teams and supply chain managers to get a good idea of how operational activities affect revenue, margins and working capital. One example is an alcohol company that needed to provide detailed operational reporting to its private equity partner. The goal was to create a reporting layer that joined sales, inventory and cost of goods sold analysis into one single view.
This dashboard analyses the key operational components that influence profitability in the alcohol distribution business. Leadership teams can keep an eye on the breakdown of cost of goods sold, compare sales to forecast by quarter and see whether operational performance is lining up with growth expectations. The dashboard also gives detailed inventory analysis, which includes stock on hand vs. stock safety levels for every product, stock quantity trends and the financial value of inventory currently held on hand. This lets executives quickly spot any products that are at risk of stock shortages, overstocking issues or excess capital being tied up in slow-moving stock.
This management information reporting really helps private equity firms get a better handle on their operational oversight and inventory planning for consumer goods businesses – especially when it comes to managing stock levels without tying up too much capital in inventory. Investment teams can get a quick read on whether their portfolio companies have enough stock to support future sales without getting caught out with unnecessary stockpiling. The dashboard also gives leadership a clearer understanding of whether sales performance is tracking with forecasts and whether changes in inventory levels are causing problems with cash flow or operations.
Private equity deal timelines have shrunk dramatically over the last few years. Market volatility and auctions mean that investment teams only have a few weeks to do their commercial, financial and operational due diligence before finalising the deal. As a result, they’re increasingly relying on automated analytics and centralised reporting to get to the bottom of things quickly without sacrificing quality.
Nowadays, due diligence combines cloud data infrastructure, automated data extraction and real-time dashboards to speed up the analysis. Financial statements, customer contracts, ERP exports and operational reports can all be automatically snatched and standardised into a centralised dataset. That lets deal teams spend less time messing around with spreadsheets and more time focusing on interpreting risks and identifying value creation opportunities.
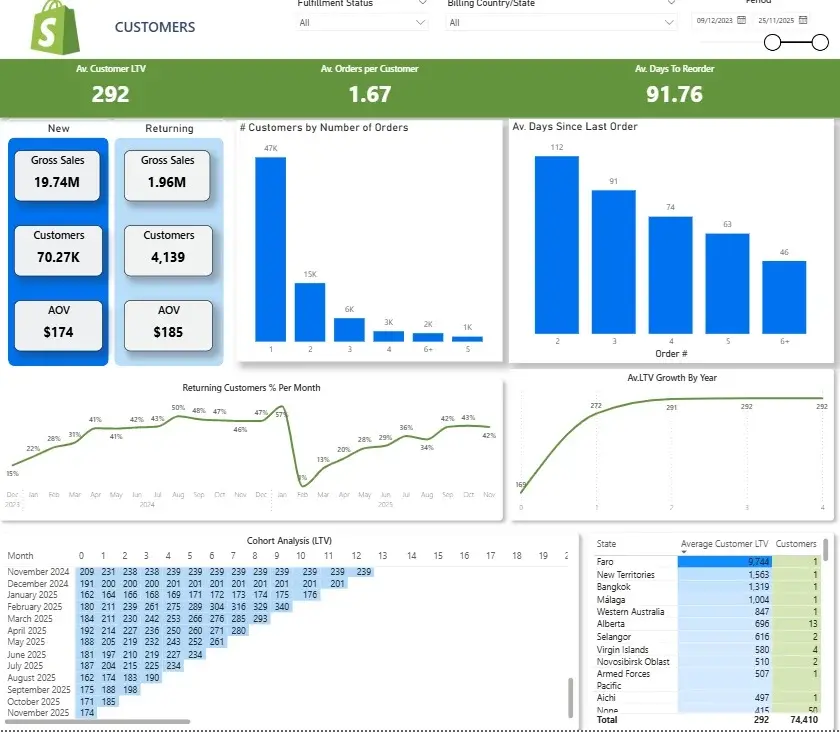
Typical private equity diligence work involves doing things like customer cohort analysis, churn and retention metrics, unit economics, pricing analytics, profitability by segment and working capital efficiency. We even developed a Shopify analytics dashboard that breaks down customer behaviour – eg how quickly customers are placing repeat orders, when different cohorts become profitable, and which geographic markets are generating the highest lifetime value. This kind of analysis helps private equity firms validate the quality of their customers and the sustainability of their revenue during due diligence.
Using data analysis properly during due diligence cuts the risk of getting ripped off in an acquisition and lets investment teams spot danger signs early on. For example, you can use historical customer payment patterns and supplier payment terms to find ways to improve cash conversion cycles post-close and unlock tens of thousands of pounds in extra working capital. Better analytics also mean that investment committee materials are more solid – no more relying on assumptions, but actual hard evidence of operational and financial performance.
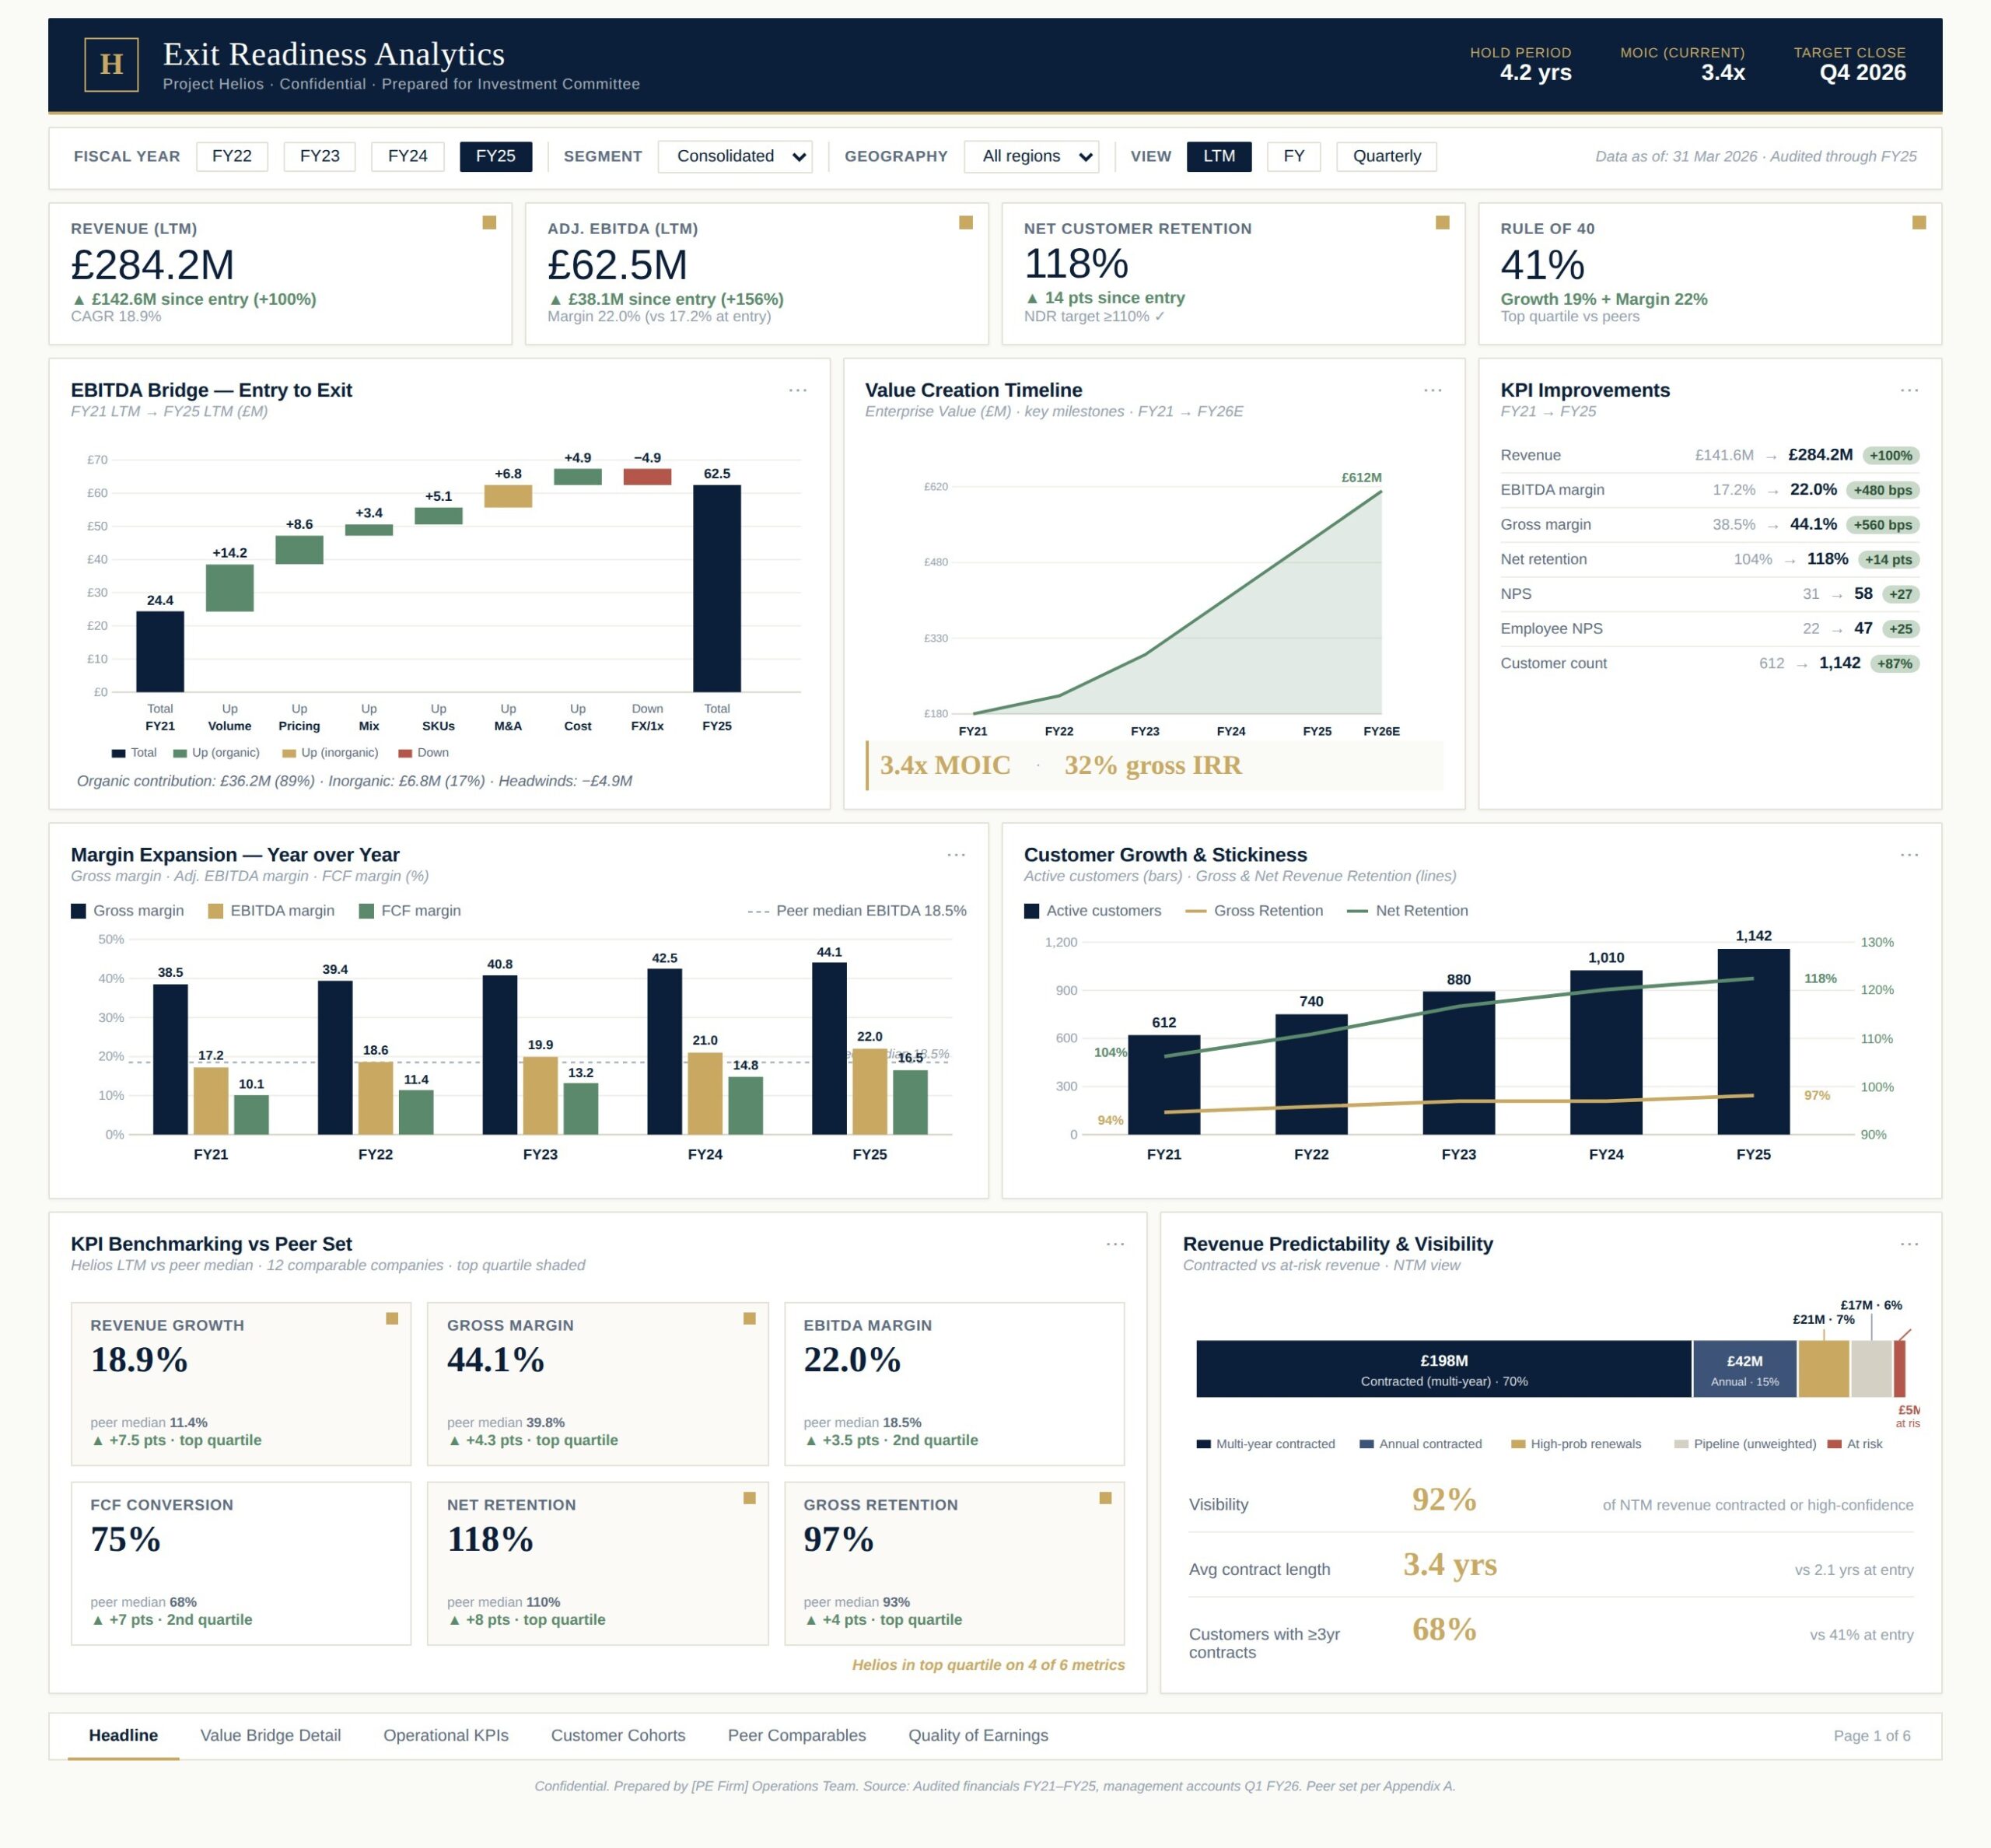
Exit readiness dashboards help private equity firms figure out whether a portfolio company is sale-worthy and support a stronger valuation narrative during due diligence. They’re used by investment teams, operating partners and lenders to get a read on revenue growth, EBITDA expansion, customer retention, profitability and long-term revenue visibility in one simple view.
This dashboard was designed to show the full value creation story from entry to exit. The top section gives headline KPIs like revenue growth, EBITDA margin expansion and net revenue retention. Then there’s additional analysis of the EBITDA bridge from entry to exit, benchmarking performance against competitors and visualising the key operational milestones that drove Enterprise Value growth from £180M to £612M. The dashboard also tracks margin expansion, customer growth, retention trends and contracted future revenue – all to show the predictability and quality of earnings.
This kind of dashboard improves how private equity firms prepare their portfolio companies for sale by turning operational and financial data into a clear investment story that buyers can easily understand. They can quickly grasp where EBITDA growth came from, how operational improvements lifted margins, and why the business outperforms peers across key metrics. By bringing all the financial, operational and commercial KPIs into one reporting layer, the dashboard speeds up due diligence and gives buyers more confidence in the company’s growth story.
In 2026, private equity firms are increasingly opting for modular, cloud-based data stacks rather than large on-premise systems. Modern business intelligence architectures are designed to combine portfolio company data, fund performance, operational KPIs and external market intelligence into a centralised analytics environment that can scale as firms grow.
At the heart of most modern PE data stacks are cloud data warehouses and data lakes like Snowflake, Databricks and Azure-based storage environments. These platforms bring financial, operational, CRM and market data into a single reporting layer for analysis. Data is usually gathered through APIs connected to fund accounting systems, ERPs, CRMs, banking platforms and portfolio company software, while external benchmark and market data is pulled in alongside internal datasets to support investment analysis and peer comparisons.
Automation tools and scheduled ETL/ELT pipelines then standardise, clean and refresh the data automatically – no more tedious spreadsheet consolidation and repetitive copy-pasting. Many firms also use RPA workflows to automate repetitive reporting tasks and data extraction processes from legacy systems. On top of this infrastructure, BI platforms like Power BI, Tableau and Looker give investment teams friendly dashboards that track KPIs like IRR, DPI, revenue growth, churn, working capital, EBITDA margins and operational performance in real-time across the portfolio.
Senior partners increasingly expect clear evidence that the investment in data and analytics make a tangible difference to fund-level and portfolio-level outcomes. As private equity firms start to get more serious about dashboards, automation and AI-driven analysis, measuring the financial and operational return on these initiatives is now critical if they want to keep getting investment into analytics.
The benefits of business intelligence usually show up in two main areas: faster decision-making and operational efficiency. For example, a typical example is that you can close a deal much quicker during due diligence, you need fewer hours to do manual reporting, there are fewer errors in reporting, you can see improvements in working capital, and you can reduce operational costs thanks to analytics. Data-driven pricing analysis, customer segmentation and spotting cross-sell opportunities can also contribute to incremental revenue growth through the portfolio companies. Sometimes you can unlock working capital improvements, like several hundred thousand pounds, by analysing historical payment and procurement patterns.
Private equity firms should also try to link their analytics initiatives directly to investment outcomes where possible. This might be because they’ve got better underwriting, stronger returns on investment thanks to using data, fewer write-offs, or they identify operational risks earlier during diligence. One good approach is to build those “before and after” baselines. So, for instance, they could compare how long it took to write investment committee memos before they automated it versus after, or measure how accurate LP reporting was across different fund vintages after they started doing centralised reporting.
But at the same time, not all the value that comes from analytics comes down to money. Having more visibility into the data can also make you more aware of the risks, get you into the habit of making more disciplined decisions and create a culture across the business where people make decisions based on data. Over time, these “softer” benefits can really improve how consistently private equity firms execute their investment strategies and manage portfolio performance.
A lot of private equity firms still treat data governance like it’s a technical IT issue rather than a business function. But in reality, good data governance is there to support reliable analytics, faster decision-making and consistent reporting across investments, portfolio companies and LP comms. Without clear governance, firms often end up with loads of different IRR calculations, MOIC reporting that doesn’t add up and multiple versions of the same metrics across different teams.
Good data governance is owned by the business, not just the IT team. Roles like the Head of Portfolio Management, CFO, Finance Director or Head of Investor Relations are usually the best people to define what data matters, how it should be measured and how it should be used in decision-making. Then the IT team can help by providing the infrastructure, integrations and security controls to keep the data environment healthy.
Typically, modern private equity firms assign ownership by data domain. So CRM and deal pipeline data might be with the investment teams, fund admin data with finance, operational KPIs with the portfolio operations teams, HR metrics with people functions and ESG reporting with the sustainability or compliance leaders. Having clear ownership reduces the amount of arguments about who is responsible for maintaining data quality and resolving inconsistencies.
Typical governance practice starts with simple standards. You need to define naming conventions, metric definitions, reporting hierarchies and validation rules to stop conflicting figures from appearing anywhere. Most mid-market firms don’t need a whole governance department to start with – sometimes not even one whole-time employee is enough to get things going.
Private equity firms are now relying heavily on data analytics to move faster, reduce risk, improve portfolio company performance and get businesses ready for a successful exit. From deal sourcing and due diligence to operational monitoring and exit readiness, modern dashboards give investment teams a continuous view into the metrics that drive enterprise value creation.
The best private equity analytics environments bring together a centralised data infrastructure, automated reporting and user-friendly dashboards that roll financial, operational, customer and market data into one reporting layer. This lets firms make better investment decisions, react faster to operational changes and communicate portfolio performance much more clearly to investors and stakeholders.
At Vidi Corp, we help private equity firms and businesses backed by private equity create custom automated analytics dashboards in Power BI and Looker Studio. We build tailored reporting solutions that bring data from CRMs, ERPs, fund accounting systems and operational platforms to life, giving our clients real-time visibility across the investment lifecycle. If you are a private equity firm or a company backed by private equity, contact us to build custom analytics dashboards that deliver faster decision-making, operational improvement and long-term value creation.


