

Financial business intelligence is using data analytics and visualisation to make sense of your financial data. In practice it covers three areas: accounting, finance teams inside a company, and the financial services industry itself. The tools do the heavy lifting. They pull data from your accounting system or ERP, clean it, and build it into dashboards and reports, so finance teams spend less time compiling numbers and more time using them.
The main benefit of financial business intelligence is uncovering insights that drive revenue growth or cost reduction. Implementing business intelligence in finance also helps to save dozens of hours per month by automating the data extraction and transformation processes.
Generally speaking, financial BI can be divided into 3 big areas: accounting analytics, financial analytics and business intelligence in financial services. Our BI consultants have case studies in all 3 of these areas which we will show in this article.
I worked as a Financial BI Analyst at Autodesk for 3+ years, where I developed Power BI reports for the CFO, Financial Directors, and VPs of Finance. My team and I also delivered 100+ financial dashboards for clients such as Google, Teleperformance, and Heineken.
Based on my experience the financial business intelligence process includes the following steps:
Throughout these steps, maintaining data accuracy and establishing data governance policies are essential to ensure high data quality, integrity, and security for reliable BI. Poor data quality can compromise the reliability of financial insights, making it critical to validate, cleanse, and govern business data throughout the process.
Financial Business Intelligence (BI) is the cornerstone of modern financial management, empowering organizations to transform raw financial data into actionable insights. By leveraging advanced business intelligence tools, finance teams can efficiently gather, process, and visualize complex financial data, providing a clear picture of the organization’s financial health. This process enables finance professionals to identify trends, monitor key financial metrics, and make informed decisions that drive financial performance.
Implementing financial business intelligence allows companies to move beyond traditional reporting methods, offering a dynamic approach to analyzing financial business operations. With the ability to visualize financial data in real time, organizations can quickly spot opportunities for revenue growth, address potential risks, and optimize resource allocation. Ultimately, financial BI equips finance teams with the insights needed to stay competitive, adapt to changing market conditions, and support sustainable business growth.

If you are choosing between the best BI tools for financial institutions, the decision rarely comes down to charts and dashboards. Banks, investment funds and insurers all work under regulatory scrutiny that most industries never face, so the platform you pick needs to handle audit trails, granular access controls and sensitive client data as comfortably as it handles visualisation. Here is how three leading platforms compare when you put them to work in a financial services environment.
| Criteria | Microsoft Power BI | Tableau | Looker (Google Cloud) |
|---|---|---|---|
| Regulatory and compliance reporting | Strong. Paginated reports handle Basel III, IFRS 9 and FCA submissions well. Sensitivity labels and Microsoft Purview support audit trails out of the box. | Good visual reporting, but pixel-perfect regulatory outputs usually need a separate tool alongside it. | Governed, consistent metrics via LookML, but pixel-perfect regulatory submissions usually need a complementary reporting tool. |
| Risk and portfolio analytics | Handles credit risk, liquidity and exposure dashboards well. DAX supports complex measures like VaR roll-ups and cohort analysis. | Strong. Excellent for exploratory risk analysis and drilling into portfolio positions visually. | The LookML semantic layer keeps risk metrics consistent across every desk, so VaR and exposure figures mean the same thing everywhere. |
| Data security and access control | Strong. Row-level security, Azure AD integration and client-level data masking suit multi-desk and multi-entity banks. | Robust row-level security and SSO, though managing permissions at scale takes more admin effort. | Fine-grained access filters and Google Cloud IAM integration are strong, though setup assumes solid data engineering support. |
| Integration with core financial systems | Connects to 250+ data sources, costs $14+ per user per month and has excellent data transformation capabilities. In addition to its data integrations, Power BI allows organizations to consolidate financial data from multiple sources for comprehensive analysis. | Broad connector library including Snowflake and cloud warehouses. Bloomberg or Refinitiv feeds usually arrive via a warehouse layer first. | Best-in-class with BigQuery and cloud warehouses. Legacy core banking systems need an ETL layer before Looker can reach them. |
| Real-time and intraday data | DirectQuery and streaming datasets cover intraday positions and payment monitoring, with some performance tuning needed at scale. | Near real-time via live connections. Genuine streaming use cases need supporting infrastructure. | Strong. Queries run live against the database, so intraday positions are as fresh as your warehouse, with no extract lag. |
| Total cost of ownership | Lowest. From £8.20 per user per month, often already covered under existing Microsoft 365 E5 agreements. | Highest of the three. Creator, Explorer and Viewer tiers add up quickly across large teams. | Premium pricing on custom quotes. Costs stack up alongside warehouse compute, so budget for both. |
| Best suited to | Banks and financial services firms already on the Microsoft stack that want governed self-service BI without a big licensing jump. | Institutions with dedicated analyst teams that prioritise visual exploration and best-in-class charting. | Cloud-first institutions on BigQuery or Snowflake that want a governed semantic layer and embedded analytics in client-facing products. |
Enterprise agreements and capacity-based licensing can change the picture significantly, so treat these as starting points rather than final numbers.
For most financial institutions we work with, Power BI wins on the combination of compliance tooling, security controls and cost, particularly where Microsoft already underpins the wider IT estate. That said, if your analysts live and breathe visual exploration, Tableau earns its premium, and Looker is the natural pick if you have already committed to a modern cloud warehouse and want one governed source of truth feeding both internal dashboards and client-facing analytics.
Business intelligence in financial services refers to the use of business intelligence specifically for financial institutions like banks, investment funds and insurance companies. The main applications of business intelligence in the financial industry are managing investments, monitoring risks and customer segmentation. Business leaders rely on financial insights and data-driven insights from BI tools to guide strategic decisions, improve profitability, and manage risk effectively.
In my practice, I have mainly worked with private equity companies that invest on behalf of their clients and use business intelligence to drive buy or sell decisions. BI dashboards help these companies to report on their performance to clients and decide whether to buy or sell a particular financial asset.
Based on my experience, the most common data sources for this type of analysis include Yahoo Finance, Benzinga, and other financial market data providers..
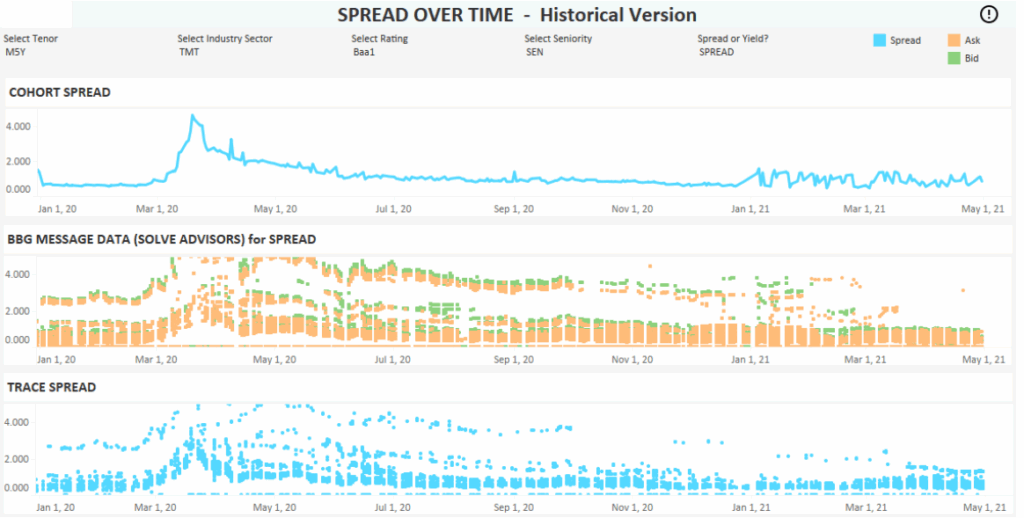
For example, our Tableau developers built the BI dashboard below for a corporate bond investment company. This dashboard helps them to monitor the bid and ask prices of corporate bonds and the difference between the two.
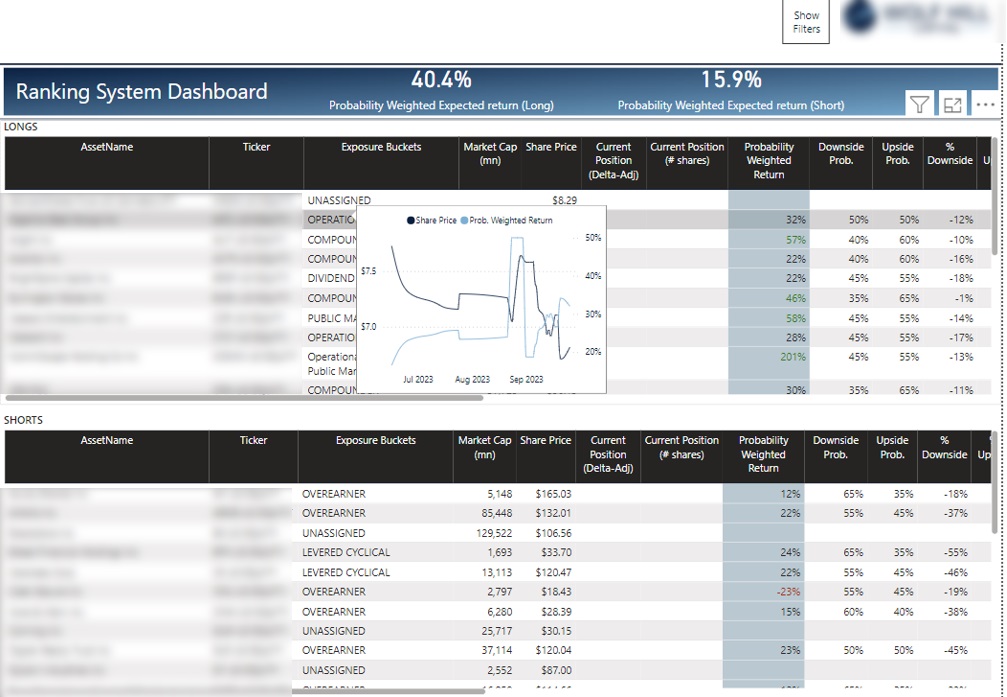
Similarly our Power BI developers have worked with an investment management firm that invested into different stocks on behalf of their clients. The dashboard gives a clear snapshot of assets held in long and short positions as well as all the relevant metrics for them. The investment managers can also hover to a particular asset and see the share price trend. The BI tools that we developed enable finance teams to track financial operations, evaluate performance, and report back to their clients with confidence.
Accounting business intelligence refers to using data analytics and visualization to transform accounting data into management reports. The main goal of business intelligence in accounting is analyzing accounting metrics and ratios to improve the company financial management. This analysis is typically presented to the CEO in small companies and the CFO in larger organizations.
Based on my experience, the data for accounting BI reports usually comes from accounting tools like QuickBooks Online, Xero, Zoho Books, NetSuite, and others. BI analysts usually extract the list of transactions from these tools which is grouped into general ledger accounts. This data is then used to create accounting dashboards like the one you see below.
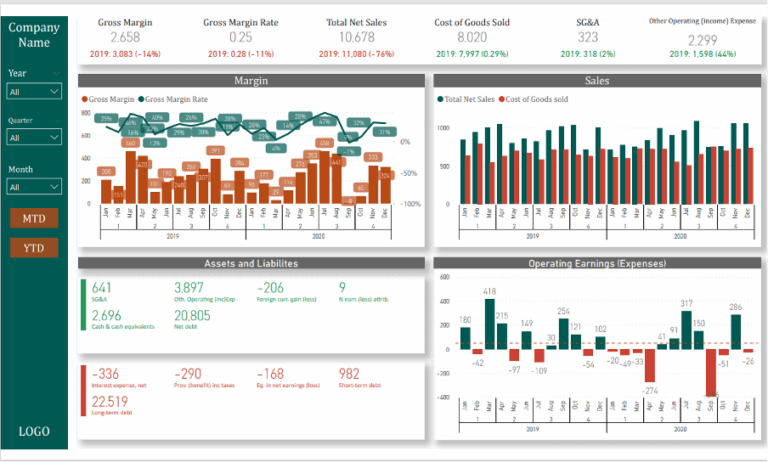
Dashboards like these are usually a good starting point for accounting business intelligence. They usually analyze P&L and Balance Sheet metrics to help finance managers analyze business profitability and any risks.
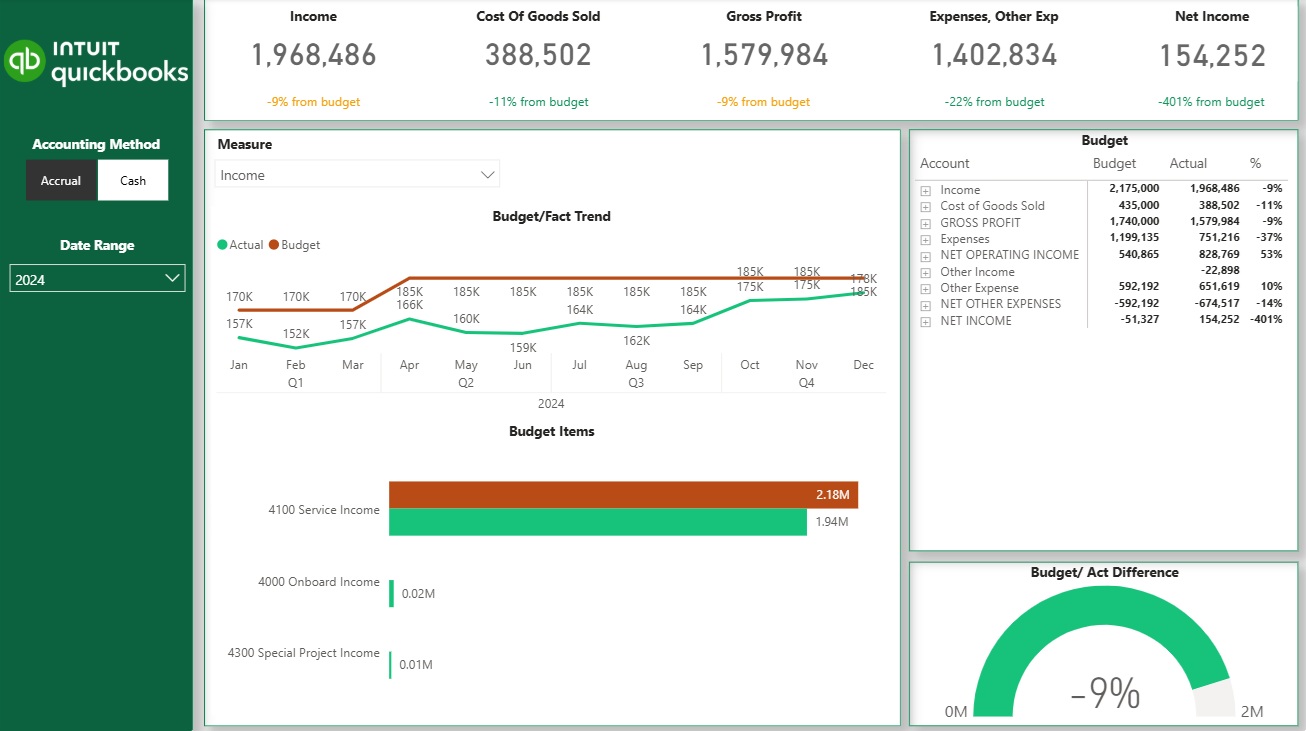
Another example of a common accounting analysis is comparing actuals to budget. Companies usually set budget for every line item in the P&L in the beginning of the year. As the actual performance data becomes available throughout the year, companies compare the actual performance to their targets.
Many companies go a step further and create accounting business intelligence dashboards for individual processes managed by the accounting team.
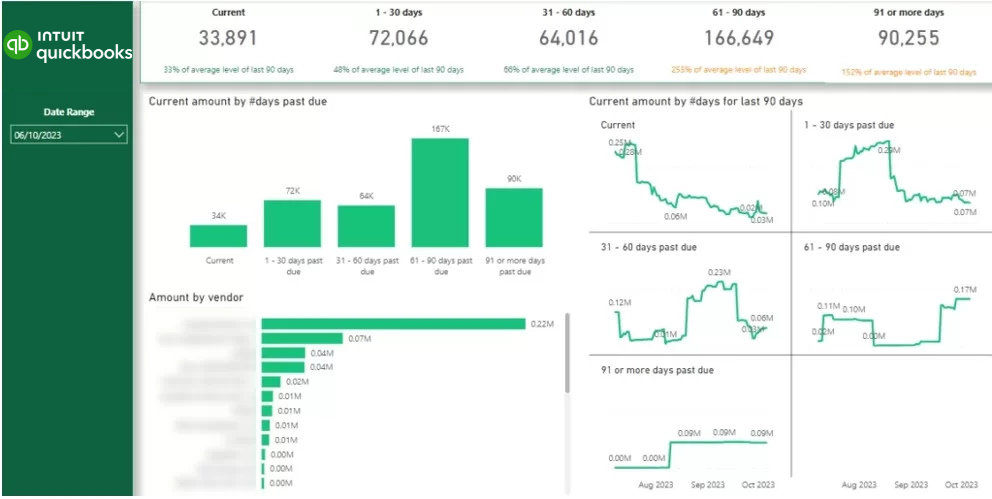
For example, accounting teams are often responsible for managing account receivables and collecting payments quicker on the outstanding invoices. An accounts receivable dashboard like the one below makes it easy to see which customers owe the money to the company and how long the invoices have been outstanding for.
Credit controllers can then work through the list of customers on the dashboard and contact them one by one to collect payments. The CFO can then monitor the total outstanding balance in the same dashboard to evaluate how efficiently the accounting team collects the outstanding payments.
Large corporations have internal financial analytics teams that produce business intelligence dashboards. Their analysis supports the financial forecasting process and helps to evaluate the sales team performance.
When I produced these dashboards in Autodesk, the finance and sales directors would discuss them together on weekly basis. Finance directors would then adjust their financial forecast based on the performance that they saw in the dashboards and the input from the sales directors on the open deals.
Common data sources for this analysis are ERPs like SAP Hana and Netsuite which contain all the data on actual sales. The data from CRM systems like Salesforce is also often used to analyze the sales pipeline and help with financial forecasting.
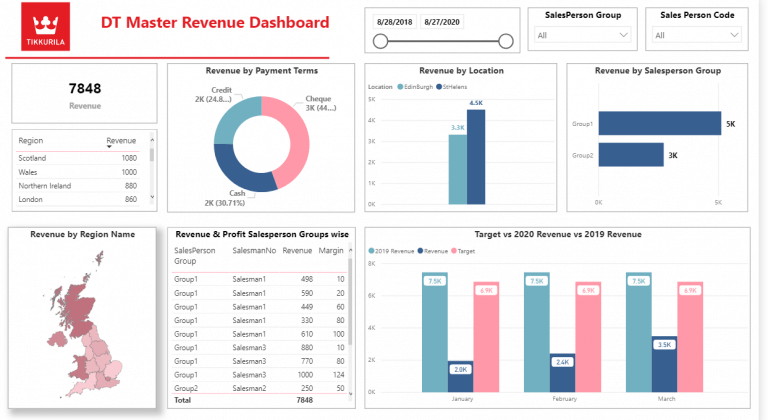
You can see an example of a finance business intelligence dashboard below. It analyzes the company revenue by location, salesperson and sales channel. This analysis can then be used to forecast revenue for every location and sales team.
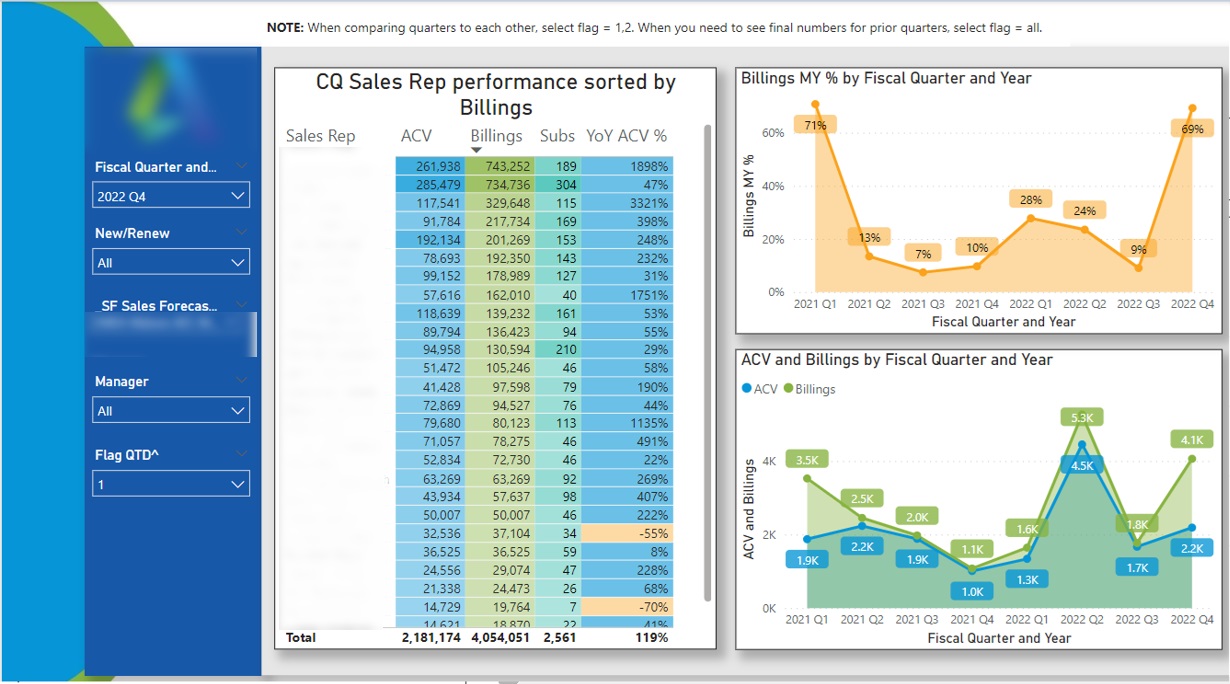
Financial analysts also often support sales teams by analyzing the performance by sales rep. For example the business intelligence dashboard below ranks sales reps by invoiced revenue in a particular quarter and shows how many subscriptions they sold. The sales managers can then click on a sales rep name and see the trends quarterly trends for their performance.
Finally, analyzing the CRM data helps the finance teams in B2B companies to more accurately forecast financial performance.
The CRM data helps to measure the amount of revenue sitting in the sales pipeline and average conversion rate of opportunities into deals. Financial directors can also discuss likelihood of winning individual deals with the sales directors and use this information to more accurately forecast revenue.

BI for banks tends to start with risk and never really leaves it. Credit exposure, liquidity coverage, loan book performance and branch profitability all need to sit on dashboards that update daily at a minimum, and the numbers have to reconcile with what goes to the regulator. That reconciliation point matters more than most vendors admit. A risk dashboard that disagrees with your regulatory submission by even a fraction of a percent creates more work than it saves, because someone has to explain the gap. The best banking BI implementations build both views from the same underlying data model, so the daily dashboard and the quarterly return are two windows onto one set of numbers.

Beyond risk, the operational side of banking generates some of the most immediately useful analytics you can build. Branch and channel performance is the classic example. Once you put footfall, transaction volumes, product sales and staffing costs on one dashboard, patterns emerge that monthly spreadsheets never surface: a branch that looks healthy on revenue but is quietly losing its younger customers to the app, or a region where mortgage applications spike every time a competitor closes a local office. Customer-level analytics take this further, showing which relationships are genuinely profitable once you account for the cost of servicing them, and which high-balance accounts are actually loss-makers.
The banks that get the most from BI are the ones that stop treating it as a reporting exercise and start using it to spot problems early, whether that’s a deteriorating loan segment, unusual transaction patterns that warrant a closer look, or a branch quietly underperforming its peers. The shift is from asking “what happened last month?” to asking “what is starting to happen now?”, and it usually requires nothing more exotic than daily refreshes, sensible alerting thresholds and dashboards that people actually open.
BI tools allow businesses to track financial operations, evaluate market conditions, and assess credit risks effectively. They also help analyze how different strategies impact a company’s profitability. By consolidating data and providing data-driven insights, BI tools support informed decision making by delivering accurate, timely information that uncovers hidden patterns and trends.
Additionally, predictive analytics helps businesses forecast future financial performance. Real-time analytics provided by BI tools allow businesses to make data-driven decisions quickly in response to market changes.
By leveraging BI in finance, organizations can enhance data analysis and make higher quality strategic decisions.
For example when we developed CFO dashboards for Neterra Telecommunications they reported finding a one-off cost-saving opportunity worth 50k Euro and finding new business opportunities worth about 10k Euro per month. You can read their review here or view their video testimonial below.
BI tools help reduce manual work by automating data extraction, processing, and reporting. Process automation helps to minimise the risk of errors while saving time and resources. Financial teams can then focus on more high-value tasks.
For example, our consultants implemented business intelligence reports for a financial services company combining the data from QuickBooks Online, Zoho CRM and Excel. These reports are fully automated and save them 10+ working hours per month as they reported in their review.
Traditionally, financial reports are manually refreshed once a week since the process is manual and takes several hours every time. Automating finance reports using BI tools means that you can schedule automated data refresh several times a day bringing the financial reports near real-time. Real-time analytics and data-driven insights provided by financial business intelligence tools enable organizations to respond quickly
Having access to real-time reports is especially important when implementing business intelligence in financial services since the data changes so frequently.
As you can see Business intelligence supports strategic initiatives and financial strategies by providing actionable insights that drive better decision-making, predictive modeling, and scenario planning. Additionally, resource allocation insights in BI help optimize budgets by identifying the highest return on investment customer segments
Now that you know the key benefits of business intelligence in finance, it is important to apply them in the right areas. I listed several common applications of BI in finance based on my experience below.
The use of business intelligence in finance helps to mitigate risks through real-time data analysis and automated alerts. Real time dashboards enable finance teams to increase transparency, detect potential issues early and take preventive action before problems escalate. Automated alerts can flag unusual patterns or compliance violations, helping to reduce the risk of fraud.
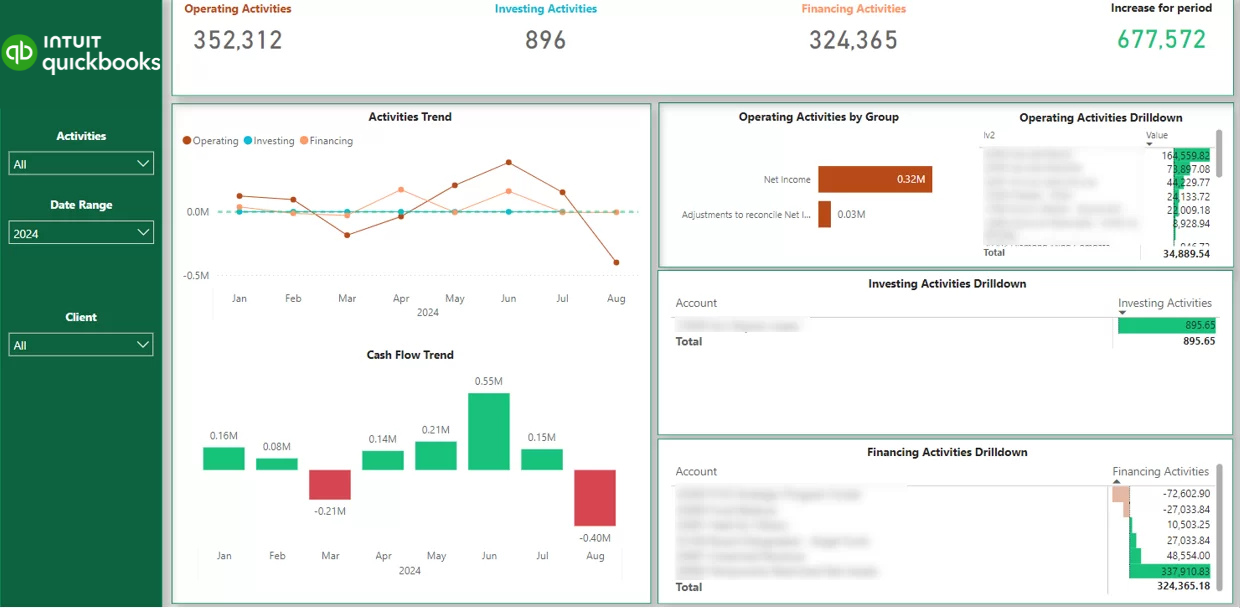
Financial BI reports facilitate cash flow management by providing a real-time view over the current cash flow position and recent changes. This analysis helps financial directors to evaluate affordability of new initiatives and ensure that the cash reserves are sufficient to keep the operations as they are. The dashboards also make it easy to identify the largest business expenses and find the irregular payments.
Financial business intelligence reporting is often focused around the company sales process. In fact, financial analysts often support the sales teams with their analysis, making the sales management more structured and increasing sales. By analyzing customer behavior patterns with BI, companies can improve sales forecasting and develop more effective sales strategies.
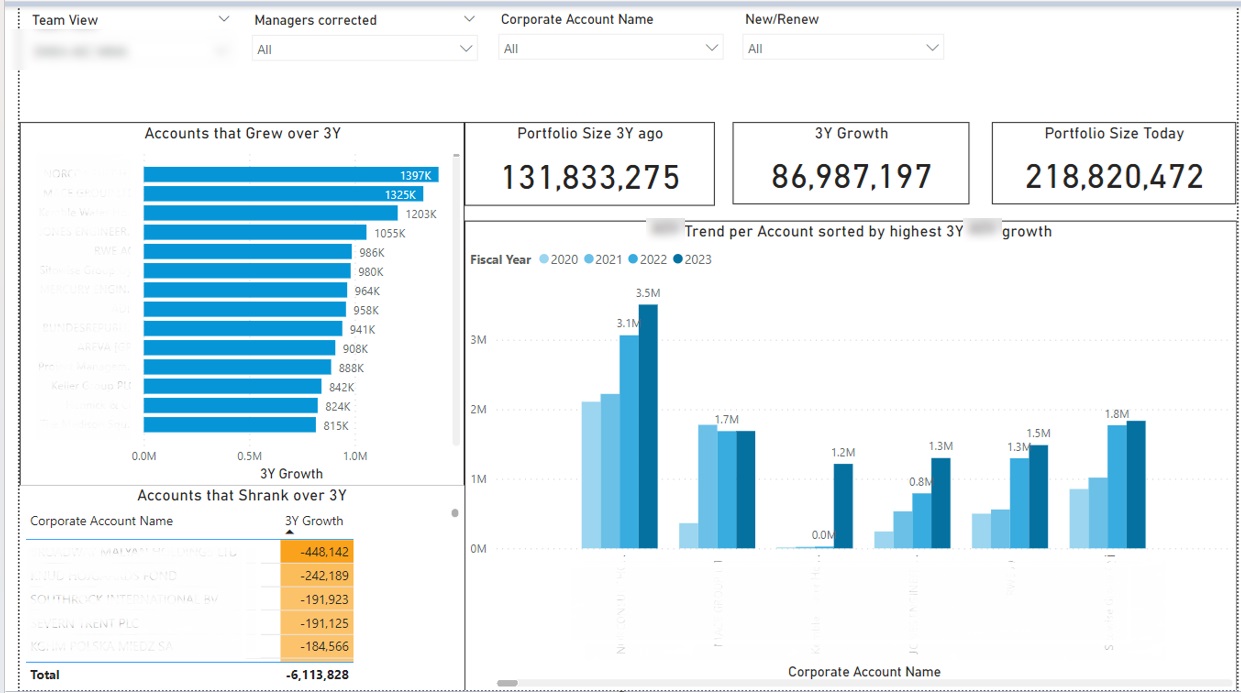
For example, financial BI dashboards can be used for identifying which sales accounts grew and shrank over time. The sales reps can then proactively suggest new ideas to the growing accounts and approach the shrinking accounts to offer help.
Business intelligence makes the financial reporting process a lot more efficient. This is important because finance teams spend a big portion of their time reporting on financial performance to shareholders and peers, especially for recurring cycles like month-end reporting, where the same statements have to be produced accurately every period.
Automating financial reports using BI tools saves time for report maintenance and enables finance professionals to create more valuable analysis.
Strategic planning is essential for organizations aiming to achieve long-term success, and financial business intelligence plays a pivotal role in this process. By utilizing BI tools, finance teams can analyze market trends, evaluate business performance, and pinpoint areas for improvement. Financial BI enables organizations to develop predictive models that forecast future financial performance, helping leaders anticipate challenges and capitalize on emerging opportunities.
With access to real-time data and advanced analytics, finance teams can track key performance indicators (KPIs) and measure progress toward strategic objectives. This data-driven approach to strategic planning ensures that decisions are based on accurate, up-to-date information, allowing organizations to allocate resources effectively and respond proactively to market changes. By integrating financial business intelligence into their strategic planning processes, companies can enhance their ability to achieve business goals, manage risks, and drive sustained growth.
Maintaining regulatory compliance is a critical responsibility for any financial business, and financial business intelligence provides the tools needed to meet these demands.
Implementing financial business intelligence ensures that financial systems and processes are aligned with regulatory requirements, promoting transparency and accuracy in financial reporting. This not only safeguards the organization against compliance breaches but also builds trust with stakeholders by demonstrating a commitment to ethical and responsible financial management. With robust BI solutions in place, organizations can streamline compliance efforts, enhance operational efficiency, and maintain a strong reputation in the financial industry.
Like any implementation, financial business intelligence comes with its own set of challenges.such as legacy system integration and managing data complexity. Poor data quality—such as inaccurate, inconsistent, or missing data—can also hinder the effectiveness of BI and must be addressed through data cleaning and integration. Let’s explore the key obstacles that may hinder adoption and the strategies to effectively overcome them.

One of the biggest barriers to financial business intelligence adoption is fragmented data, stored across multiple systems, formats, and departments. This leads to inconsistent reporting, duplication, and errors in decision-making.
To eliminate data silos, businesses should establish unified data lakes, which consolidate financial information from various sources into a centralized, structured repository. Data warehousing is also essential for storing and managing large volumes of historical financial data, supporting trend analysis, forecasting, and seamless integration within the broader business intelligence and data integration ecosystem.
By unifying financial data, organisations can enhance reporting accuracy, forecasting precision, and operational efficiency.
Organisations must invest in structured learning programs that empower employees with the skills necessary to interpret, analyse, and apply financial intelligence.
Involving key stakeholders and business leaders in training and adoption efforts is crucial to ensure that the needs of all departments are addressed and to drive successful implementation.
Equipping teams with data literacy enhances their ability to make informed decisions and fosters a data-driven corporate culture.
Financial leaders often hesitate to allocate large budgets to this system due to uncertainty in ROI and implementation risks. Many companies fear overinvestment in BI tools without concrete performance gains.
Instead of full-scale implementation, businesses should start with targeted, modular pilots that demonstrate measurable ROI before scaling further.
Aligning BI investments with strategic initiatives and financial strategies ensures that resources are directed toward analytics projects that optimize decision-making and support business growth.
By proving the value of the financial business intelligence through pilot programs, organisations can secure executive buy-in and justify larger-scale investments.
Financial Business Intelligence has become an indispensable tool for modern finance, transforming decision-making, forecasting, cost optimisation, and regulatory compliance. By integrating data analytics, automation, and financial expertise, businesses can gain real-time insights, reduce risks, and drive profitability.
As organisations continue to navigate economic challenges and evolving financial landscapes, embracing this system ensures strategic agility and competitive advantage. Those who invest in scalable BI solutions, data-driven strategies, and financial automation will lead the future of finance with efficiency, accuracy, and innovation.
It’s using BI tools to build dashboards and reports the finance team can actually use. Instead of manually pulling numbers into a spreadsheet every week, the data gets extracted, cleaned, and visualised for you automatically. Most teams we work with do this in Power BI, Tableau, or Looker.
In banks, investment funds, and insurers, BI mostly comes down to managing investments, watching risk, and segmenting customers. We’ve worked with private equity and investment firms that use dashboards to track asset prices and performance and decide what to buy or sell, usually pulling data from sources like Yahoo Finance and Benzinga. Because the market data changes by the minute, near real-time reporting matters far more here than in most other areas of finance.
Power BI, Tableau, and Looker. Power BI (from $14/user/month) is the easy pick if you’re already on Microsoft, Tableau (from $15/user/month) is stronger if you want more advanced visuals, and Looker (roughly $35k+/year) is an enterprise option that’s good for teams building dashboards together or embedding them into other tools.
Think of financial BI as the whole setup: collecting the data, cleaning it, and getting it into dashboards. Financial analytics is one piece of that, the actual interpretation, like forecasting or testing budget scenarios. BI gives you the reporting layer, and analytics is what you do on top of it.
Mostly it gives you back time and visibility. Automating the reporting saves a finance team a lot of hours every month, and it gives the CFO a live view of cash flow, revenue, and risk instead of numbers that are a week old. One client of ours found a one off €50k saving and around €10k a month in new opportunities once they could actually see their data clearly.


