
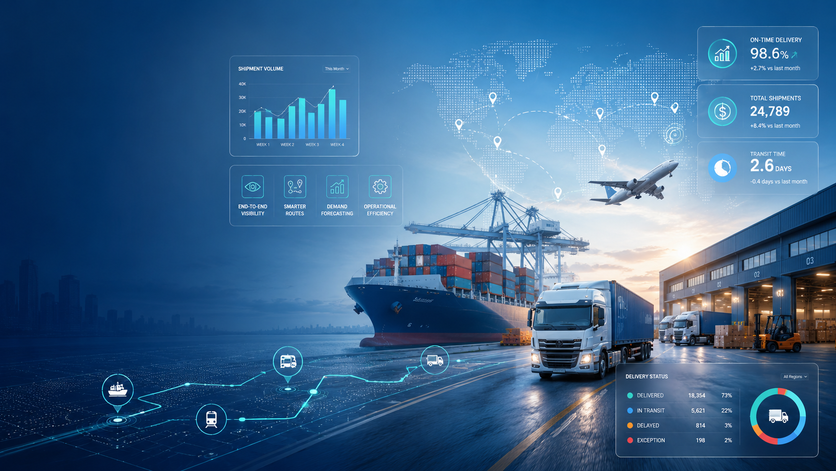
Since 2020, logistics has absorbed one shock after another: pandemic demand swings, ocean and air capacity crunches, driver shortages, fuel volatility, and the Red Sea rerouting of 2023 and 2024. Each disruption has punished operators who plan with stale spreadsheets and rewarded those who can see, model, and react in real time.
Business intelligence in logistics is simple in concept: use integrated data and analytics to make better decisions in transportation, warehousing, and inventory management.
Our business intelligence consultants have built data analytics and automation solutions for companies in logistics and supply chain. Our work often focuses on connecting disconnected systems, automating reporting, and giving teams real-time access to reliable business metrics.
In this article, we will explain what business intelligence means in logistics, which data sources matter most, what dashboards logistics companies need, and how BI improves delivery performance, cost control, inventory visibility, and decision-making.
Business intelligence in logistics is really just about pulling together all the data your operation produces, making sense of it, and putting it somewhere people can actually use it. That data comes from all over the place: your transport management system (TMS), warehouse management system (WMS), fleet software, inventory tools, finance platform, CRM, spreadsheets, and even apps your drivers use out in the field.
The point is to give managers and execs a proper view of what’s actually happening. Rather than logging into five different systems or waiting around for someone to put a report together, they can just open a dashboard and see delivery times, where orders are, how routes are performing, what’s going on in the warehouse, stock movement, and where the money’s going.
Most supply chain BI setups boil down to three things working together: something that pulls the data in automatically, a sensible structure to hold it all, and dashboards built around the KPIs each team actually cares about. Get those three right, and you stop firefighting every problem after the fact. You start spotting things before they become problems in the first place.
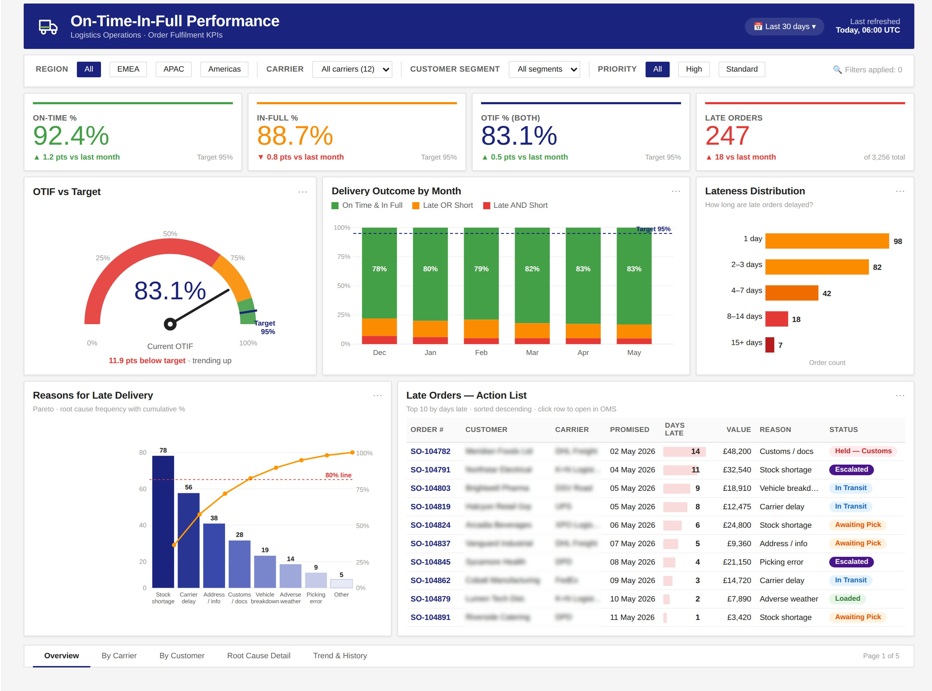
A lot of logistics teams struggle to properly measure delivery performance across their orders. They can usually see whether something shipped, but not whether it arrived on time, in full, or both.
Without proper OTIF analytics, late and incomplete deliveries are harder to prioritise. Teams also struggle to understand why orders are delayed or how severe the delays actually are.
Our Power BI developers built a custom OTIF dashboard that tracks delivery performance across the fulfilment process.
Key metrics:
The dashboard helps logistics teams quickly identify delayed orders, understand why they are late, and prioritise the orders that need immediate attention. It also gives leadership a clearer view of overall fulfilment reliability and service performance.
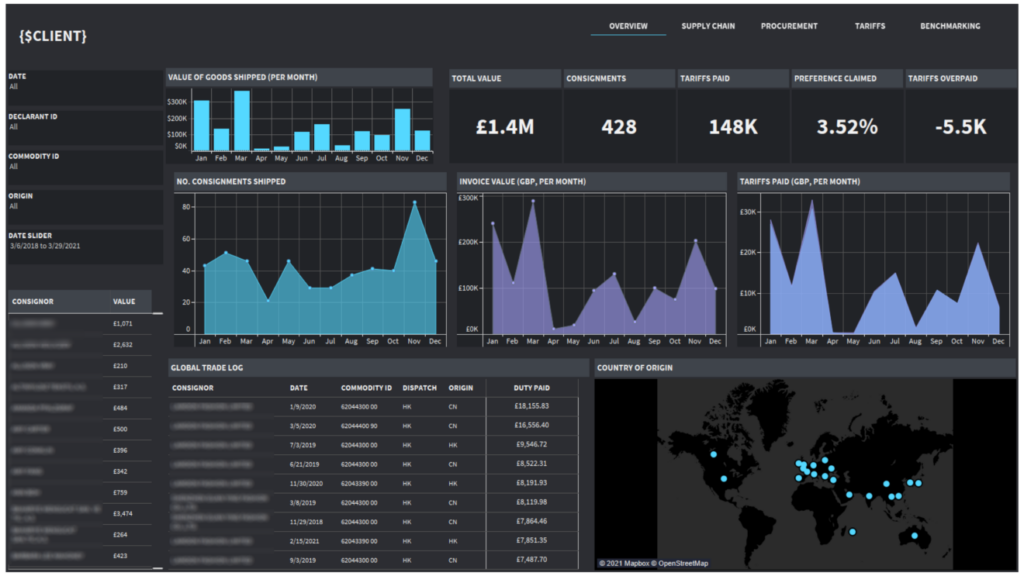
A lot of importers and manufacturers are running cross-border procurement without really knowing where their goods are coming from or how much duty is eating into the total landed cost. The tariff data usually lives in one place, purchasing in another, shipping in a third, so getting a proper picture of what’s actually driving costs is harder than it should be.
Without decent analytics behind it, it’s tough to spot which regions you’re overpaying to source from, whether you’re making the most of the trade agreements available to you, or if you’re paying more in tariffs than you need to. The result is cost that quietly sits in the supply chain and chips away at margin.
Our Tableau experts built a custom dashboard that brings purchasing, shipment, and customs data together in one place. It shows where goods are being sourced from and tracks shipment activity alongside the import duties being paid. It also flags which imports qualify for preferential trade agreements and compares what you’ve paid against the reduced rates you could have claimed.
What it tracks:
The dashboard backs up a cost-optimisation strategy across the supply chain. Leadership can see which sourcing regions are costing the most and work out whether switching suppliers or rerouting shipments would bring landed costs down.
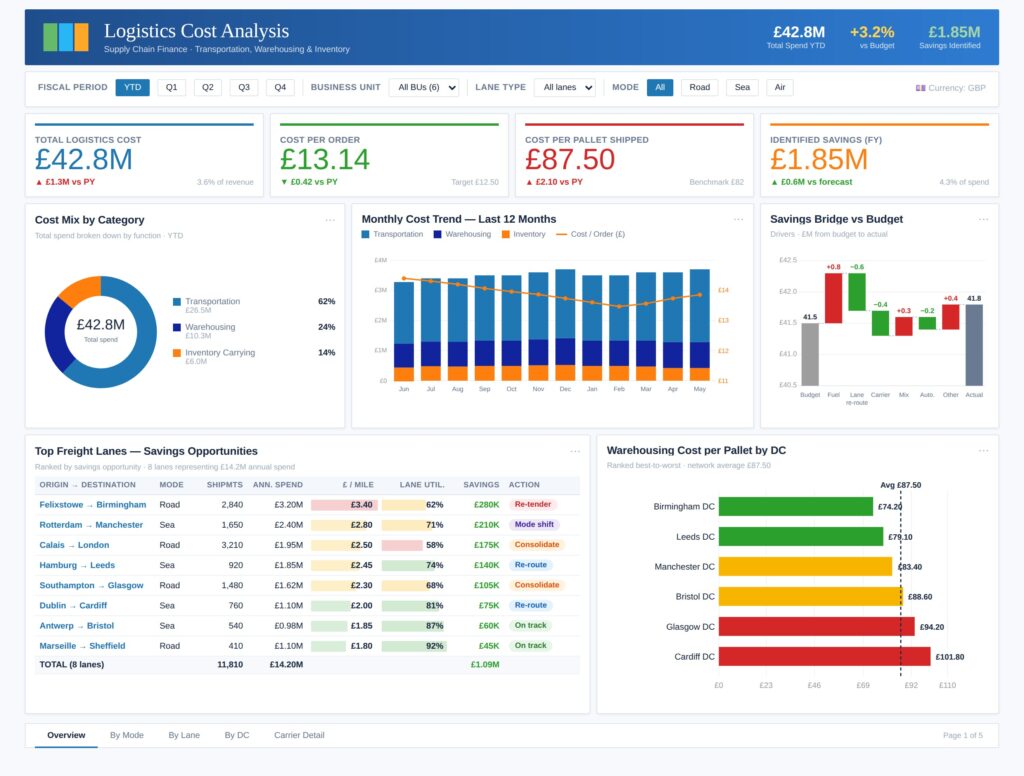
A lot of logistics and supply chain teams struggle to properly understand where logistics costs are increasing across transport, warehousing, and inventory operations. The data usually sits across different systems, which makes it difficult to see which lanes, warehouses, or delivery methods are driving unnecessary spend.
Without proper cost analytics, rising transport costs, poor warehouse utilisation, and inefficient freight lanes often go unnoticed until margins start tightening. Teams also struggle to identify where savings opportunities actually exist or which operational changes would make the biggest impact.
Our BI consultants created a custom logistics cost business intelligence dashboard that brings transportation, warehousing, and inventory cost analysis into one place.
Key anaysis:
The dashboard helps supply chain and finance teams quickly identify which freight lanes, warehouses, and cost categories are driving overspend. It also highlights savings opportunities across carrier negotiations, lane consolidation, rerouting, and warehouse operations.
Because the dashboard breaks costs down by lane, warehouse, and transport mode, leadership can make more informed decisions around logistics strategy, supplier management, and operational efficiency.
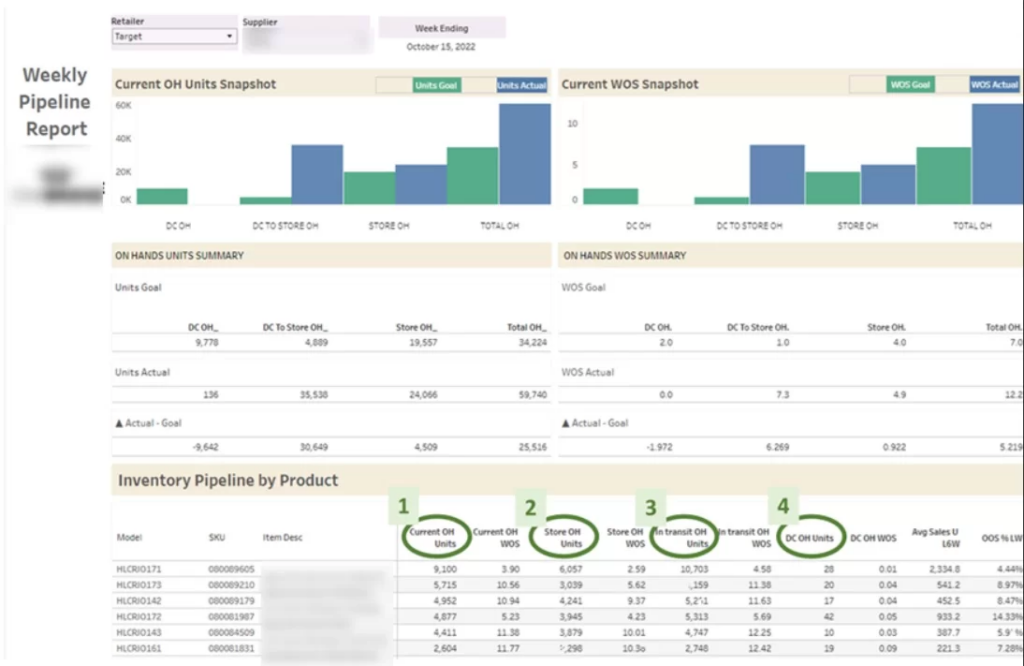
A lot of consumer goods brands and manufacturers sell through big retailers, but don’t really have a handle on what’s happening with their stock once it’s in the store. They often can’t see how much is actually sitting on the shelves, how fast it’s moving, or when it needs topping up.
Without proper inventory analytics, stockouts often go unnoticed until sales start to drop. Nobody’s keeping an eye on weeks of supply, and conversations with retailers end up being based on gut feel rather than actual numbers. That means lost sales, fewer products on the shelf when shoppers go looking, and a weaker hand when it’s time to negotiate.
Our BI experts built a custom retail inventory dashboard that brings store-level inventory and sales data together in one place.
It shows how much stock retailers are holding in-store (On Hand) and works out Weeks of Supply based on how quickly products are selling. It flags any products dropping below target coverage and tracks out-of-stock performance over time, so replenishment decisions are based on what’s actually happening.
Key metrics:
This data visualization dashboard backs up a supply chain strategy that puts availability front and centre. Leadership can spot products heading for a stockout before it happens and have proper, data-backed conversations with retail partners about getting them topped up.
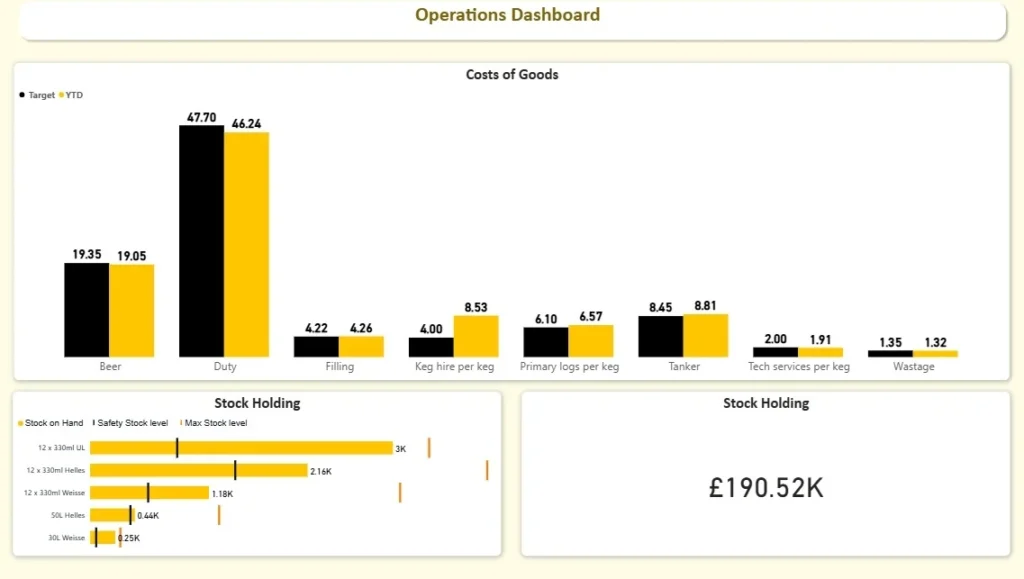
A lot of retailers, distributors, and FMCG brands find it tricky to keep stock at the right level across their whole product range. Without a clear view of what’s currently in stock, what the safety threshold is, and how much they can actually hold, businesses end up either running out of things or sinking too much cash into stock that just sits there.
When stock control comes down to static reports or someone manually checking, replenishment becomes a reaction rather than a plan. That means more emergency restocking, dropping service levels, and a lot of unnecessary stress on the operations team.
Our Power BI experts built a custom stock level dashboard that gives a real-time view of inventory health across every product.
It tracks Stock on Hand product by product and works out both the Safety Stock Level and Max Stock Level based on demand patterns and lead times. When inventory gets close to a critical threshold, it flags it automatically, so replenishment can be planned ahead rather than rushed.
Key metrics:
The dashboard fits into a control-driven approach to supply chain analytics. Operations leaders can see at a glance whether stock is sitting in the sweet spot and decide what needs topping up first.
Keeping an eye on safety thresholds in real time cuts down on emergency restocking and protects service levels. At the same time, having visibility into max stock levels stops the business from over-ordering and tying up cash unnecessarily.
Strategically, the dashboard turns inventory data into a working capital tool. Supply chain teams can balance availability against cost using thresholds they can actually measure, which tightens up inventory governance across the wider analytics strategy.
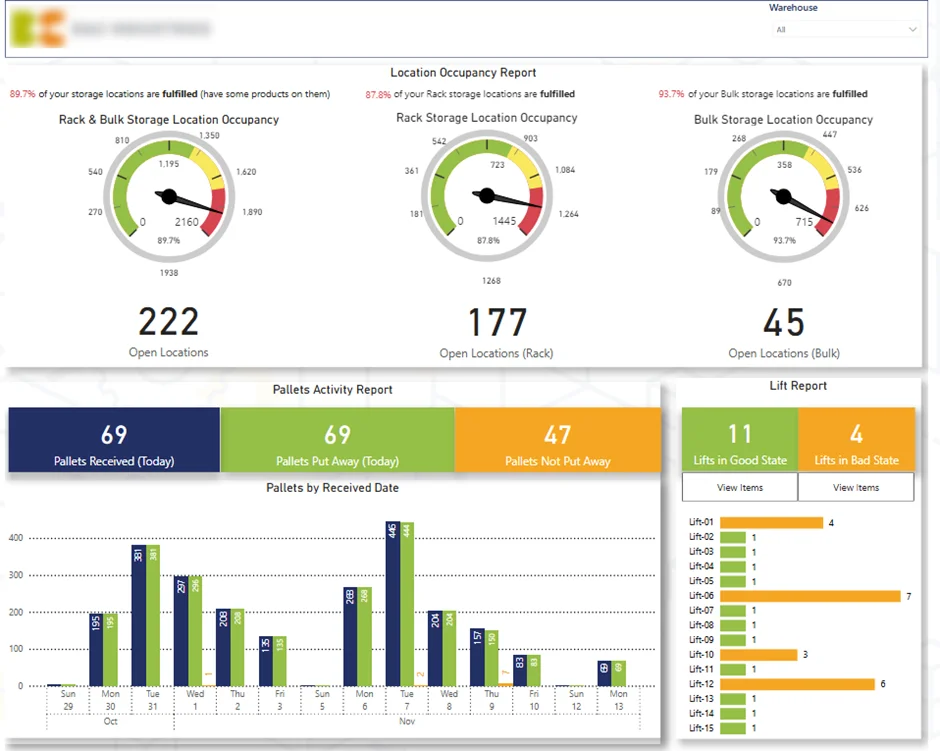
A lot of logistics-heavy businesses struggle to keep a real-time eye on what’s coming into the warehouse. Without proper operational analytics, teams can’t really see where storage is getting tight, what stock hasn’t been allocated yet, or where things are getting jammed up.
When inbound deliveries aren’t being tracked properly, rack and bulk locations start filling up, pallets sit around waiting to be processed, and forklifts end up carrying jobs they never finished. Receiving slows down, handling drags, and the whole warehouse starts to feel like it’s working against itself.
Our Power BI experts built a custom warehouse dashboard that gives a real-time health check on everything coming in.
Key metrics:
The dashboard fits into an efficiency-focused approach to supply chain analytics. Warehouse managers can see straight away where space is getting tight and rebalance inbound flows before things start backing up.
Being able to see which pallets haven’t been processed and what’s still sitting on forklifts makes it easier to prioritise tasks and clear inbound stock faster. Space gets used better, receiving moves quicker, and handling delays drops.
Strategically, the dashboard turns day-to-day warehouse activity into proper operational intelligence. Supply chain leaders can fine-tune inbound throughput, storage, and labour based on what’s actually happening on the floor, not what a report said last week.
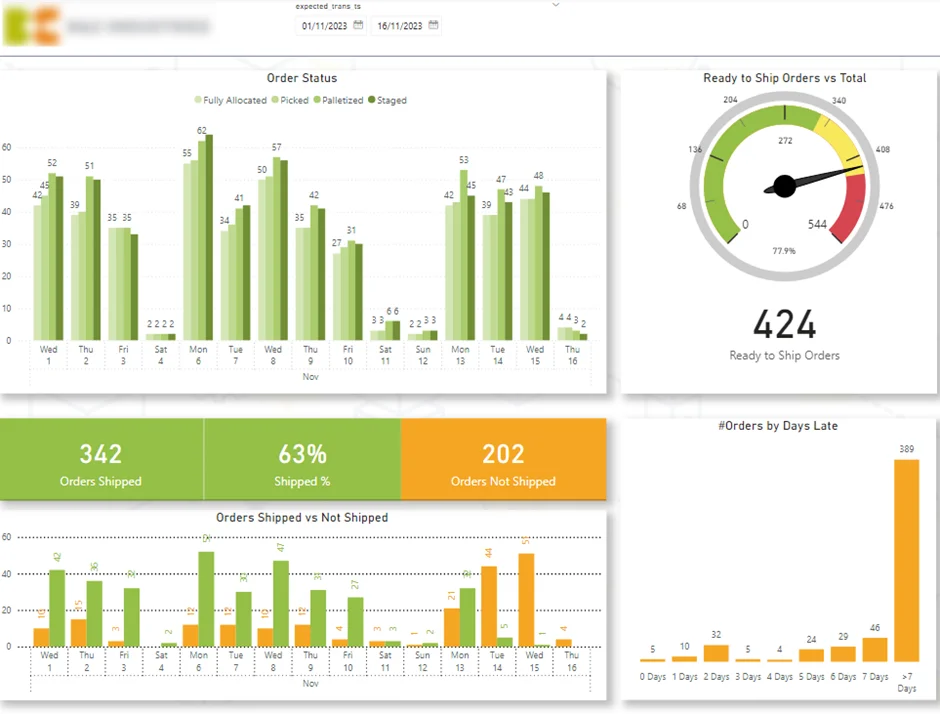
A lot of warehouse operations don’t have proper visibility over outbound order flow or how ready things actually are to ship. Without clear tracking of order status and where delays are happening, bottlenecks in allocation, picking, packing, or staging tend to fly under the radar until service levels start slipping.
By the time late shipments get spotted, teams are already firefighting. Throughput becomes inconsistent, delivery targets get missed, and customers notice.
Our data visualization experts built a custom outbound warehouse dashboard that gives full visibility into order processing and delivery performance.
Key metrics:
The dashboard fits into a service-level-driven approach to supply chain analytics. Warehouse managers can keep an eye on readiness in real time and hold throughput steady right through the week.
Because you can see exactly where each order sits, it’s much easier to work out whether delays are coming from allocation, picking, packing, or staging, and fix the actual cause rather than the symptom. The late-order view means delayed shipments can be pushed to the front of the queue before any customer promises get broken.
Business intelligence helps lift delivery performance by giving dispatch and ops teams a real-time view of what’s actually going on, where things are running late, which deliveries have failed, and how routes are holding up. It works by pulling together delivery systems, driver updates, traffic feeds, and order data into one place you can actually report on.
Once that visibility is there, teams start spotting delay patterns earlier and can tweak routes, schedules, or resources before things go sideways. Vidi Corp helped a logistics client build predictive models that forecast delays using traffic and weather data, which cut late deliveries by 20%.
BI cuts down the time spent putting reports together by automating reporting through the data pulling, cleaning, and dashboard refreshes. Rather than someone manually collecting numbers from a handful of different systems, teams can rely on live dashboards that update on a schedule.
One Vidi Corp client cut their manual data consolidation work by 95%, brought reporting time down from 48 hours to under 5 minutes, and started making strategic decisions 40% faster thanks to real-time insights. It’s a good example of how automated BI can speed up management decisions when the operation behind it is complex.
By bringing stock movements, barcode scans, warehouse updates, and product trends together in one system, business intelligence sharpens inventory accuracy. Managers finally get a stock availability view they can actually rely on, and a lot of the manual updating gets taken off people’s plates along the way.
Vidi Corp built an inventory management solution where staff scan barcodes and update stock levels straight from their mobile devices. The result was an 80% drop in stock discrepancies, and managers could finally stay ahead of stockouts because they knew what was on the shelves in real time.
BI lowers manual work by replacing spreadsheet-based reporting with automated data pipelines and dashboards. In logistics, this can apply to delivery reports, inventory updates, warehouse performance, supplier reporting, carrier reports, and finance dashboards.
A Vidi Corp client reduced the time spent preparing reports by over 50% after automated data feeds and streamlined dashboards were implemented. The client also improved data accuracy and gave leadership faster access to real-time insights.
In logistics, if your shipment, inventory, or cost data is off, every planning decision built on top of it will be off, too. That’s where operational business intelligence comes in. It makes data far more reliable by cutting out manual entry, linking systems together through APIs, and applying consistent rules across the board.
One Vidi Corp client reduced data-entry errors by 80% through automated REST API feeds and increased data integrity across business units to 99.7%. This kind of automation helps logistics companies trust the numbers behind operational decisions.
BI touches all four major logistics domains: transportation, warehousing, inventory, and customer service. The business intelligence use cases below show how data-driven decisions reduce cost per shipment, improve on-time delivery, and lift warehouse throughput.
Logistics BI combines historical shipments, sales orders, seasonality, and external signals like promotions, holidays, and weather to forecast demand at SKU, customer, and lane level. Better forecasts and data reporting let you plan fleet capacity, warehouse labor, and carrier contracts months ahead. A retailer can use weekly BI forecasts to lock in container bookings from Asia before peak season, instead of paying spot premiums in November. Even a 5 to 10 point gain in forecast accuracy typically delivers double-digit cuts in expedited freight spend.
BI analyzes historical and real-time route data to find efficient lanes, consolidation opportunities, and optimal departure times. Integrated with GPS and telematics, it supports dynamic routing that adapts to traffic, weather, and delivery windows. Tracking carrier KPIs (on-time delivery, damage rates, lead time variability, cost per mile) lets you rank carriers and shift volume to the most reliable partners. The same data anchors quarterly business reviews in numbers rather than anecdotes.
BI supports inventory optimization by analyzing demand patterns, lead times, and service-level targets across all warehouses. ABC and XYZ classification focus attention on the SKUs that matter most. Network-wide dashboards consolidate stock positions across DCs, and automatic alerts flag slow-moving or obsolete inventory. Redistributing stock between regional DCs based on BI insights reduces stockouts on hot items, shortens delivery times, and frees warehouse space, with lower safety stock and fewer rush transfers flowing straight to the bottom line.
Warehouse KPIs like picks per hour, dock-to-stock time, order cycle time, and error rates by shift become visible at the team or even individual level. Managers use these insights to redesign pick paths, adjust slotting strategies, and plan labor more accurately. Heat maps of congestion zones, built on scanner and WMS data, often reveal that the same few aisles cause repeated bottlenecks during peak hours. BI also strengthens the business case for automation by quantifying current bottlenecks and projected ROI in concrete numbers.
One of the most tangible benefits of business intelligence in the logistics industry is finding hidden waste in transport, warehousing, and inventory holding costs. Cost-to-serve analysis by customer, lane, or product surfaces patterns no one notices day to day: customers whose service requirements quietly kill margin, lanes where accessorial charges have crept up, products whose handling costs exceed their gross profit. Continuous BI monitoring keeps those savings from eroding over time.
Successful BI in logistics is a phased, business-driven program, not a one-shot IT project. The usual reason BI initiatives stall is not technology but unclear objectives, weak data, or thin change management. Logistics, finance, and IT all need to be involved from day one. Programs owned only by IT rarely change operational behavior; programs owned by operations with IT support consistently do.
Start with specific, time-bound targets: cut transport cost per shipment by 8 percent in 12 months, raise on-time-in-full (OTIF) to 98 percent, reduce DC overtime by 20 percent, or improve forecast accuracy by 5 points. Vague goals like “improve visibility” produce vague results. Pick one or two high-impact pilot use cases, such as a transport performance dashboard or network-wide inventory visibility, and document baseline metrics before you start so the value is provable later.
Data quality (completeness, accuracy, timeliness) drives BI success more than tool selection. A great platform on bad data gives fast, beautiful, wrong answers. Inventory all relevant systems (TMS, WMS, ERP, spreadsheets, carrier portals, telematics, EDI feeds) and map known issues like missing timestamps, inconsistent location codes, or non-standard SKU IDs. Then assign data stewards and build cleansing into the routine. Data quality is not a project; it is a habit.
Evaluate BI tools on integration with your TMS and WMS, ease of dashboard creation, performance on large datasets, security, and total cost. Cloud-native platforms are usually the right default, with broad connectors and continuous updates. On-premise still makes sense in narrow cases with strict data residency or latency needs. Involve both IT and end users (planners, operations managers) in the selection. Make sure the architecture can support future AI-based forecasting and streaming data, even if you don’t need them on day one.
Adopting logistics BI is a cultural shift from intuition-based to data-driven decisions. Role-specific training, BI champions inside transport and warehouse teams, and KPIs that show up in performance reviews are what move adoption from “installed” to “used every day.”
Between now and 2030, BI in logistics will get more real-time, more predictive, and more autonomous. AI, digital twins, and warehouse automation will embed analytics into daily decisions, often without users opening a dashboard. Sustainability, resilience, and customer experience metrics will join cost and service as first-class measures.
Analytics maturity moves from descriptive (what happened) to predictive (what is likely) to prescriptive (what to do). Most operators sit between descriptive and predictive, with leaders running prescriptive in narrow use cases: system-recommended rerouting during disruptions, optimal carrier mix for an upcoming bid, or automatic safety stock adjustments. These recommendations increasingly appear inside the TMS and WMS workflows rather than a separate BI portal.
Logistics BI will be central to tracking and reducing CO2 emissions, fuel consumption, and empty miles. Shippers and regulators in the EU and North America already demand granular emissions data by shipment and lane. Practical ESG KPIs to add to dashboards include emissions per ton-kilometre, share of low-emission transport modes, and route efficiency. Combining cost and sustainability data in one view is becoming a real source of competitive advantage when bidding for environmentally conscious customers.
Business intelligence helps logistics companies improve visibility, reduce delays, control costs, and make better operational decisions. The biggest impact usually comes from connecting fragmented systems and turning them into clear dashboards for each team.
The best logistics BI solutions are custom-built around the company’s real workflows. They should reflect how orders move, how deliveries are managed, how stock is controlled, and how costs are measured.
If you are planning a logistics BI project, start with one high-value process. Once the first dashboard proves its value, you can expand into delivery performance, warehouse operations, inventory, fleet management, customer service, and finance.


