
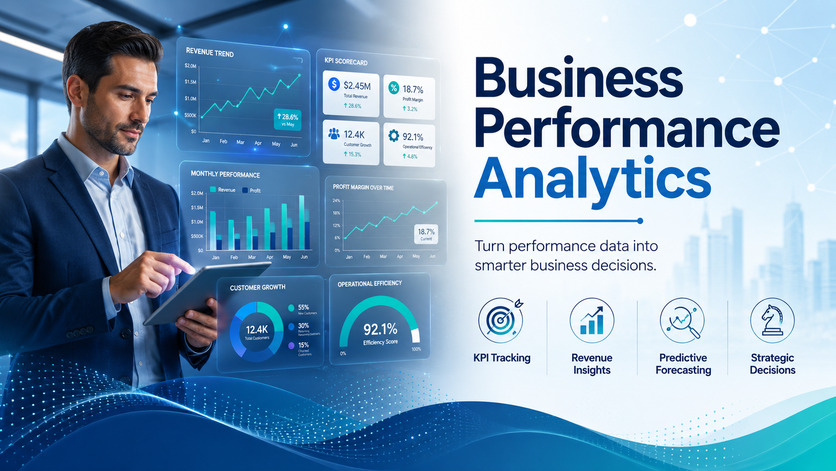
Business performance analytics is all about collecting and making sense of all the data swirling around a company, to see if you’re actually hitting your targets. It’s a crucial process that involves crunching numbers and tracking trends across all departments – sales, finance, marketing, and operations – to help teams spot problems early on, and make informed decisions. And in the Microsoft world, you can do all this with a nifty app called Business Performance Analytics in Dynamics 365, which gives you pre-built dashboards and data models to get started with right out of the box.
We’ve seen this app in action with loads of our clients, and what we’ve learned we’re going to share with you in this article. We have also built automated business performance analytics dashboards for 600+ clients as Power BI consultants.
We’ll break down how Business Performance Analytics works in real life, how it’s set up inside and outside of Dynamics 365, and how companies are using it to take their reporting from basic to advanced.
Business performance analytics is just a fancy way of saying you’re collecting, analysing, and making sense of data to see how your company is actually performing against its goals. It’s all about tracking key metrics across departments and spotting trends and problems before they blow up. In practice, this means you’re delivering business intelligence dashboards that automatically pull in data, update in real time, and give decision-makers a clear picture of what’s going on.
These days, Business Performance Analytics is the bread and butter of finance teams. They rely on centralised financial dashboards to keep track of company performance, and ditch those old excel spreadsheets and email reports that used to be the norm. This shift gives them access to consistent, up-to-date data, rather than manual snapshots.
With Business Performance Analytics inside Dynamics 365 Finance, finance teams get a single, unified view of financial and operational data. They can track performance across different business units, legal entities and dimensions, and compare actuals, budgets, and forecasts. This gives them a solid foundation for planning, forecasting, and performance management.
One of the key enablers is the use of standardised data models. These models are built around a common chart of accounts and consistent dimensions like department, cost centre, region, and product line. And with KPI definitions governed centrally, you know that metrics like revenue, margin and cash flow are always calculated the same way.
Data governance for analytics plays a big role in keeping trust in the data. Models are version-controlled, and the ownership is usually split between finance and BI teams. KPI formulas are documented, so you can easily check the numbers and support audits. This structured approach reduces ambiguity and keeps reporting consistent across the organisation.
In practice, BPA supports a bunch of core finance workflows. During the monthly close, teams use data visualization dashboards to spot variances and validate results before finalising reports. Rolling 13-week cash flow dashboards help treasury teams keep an eye on liquidity and plan funding requirements. And real-time tracking of EBITDA against targets lets finance leaders keep an eye on performance all the time, and respond quickly to maintain compliance.
Dynamics 365 Business Performance Analytics is a dedicated analytics app that brings business intelligence to the masses. It’s available with the Dynamics 365 Finance and Supply Chain licenses, and other users can access it as an add-on. The solution uses pre-built Power BI KPI dashboards embedded directly into Dynamics, to turn data into actionable insights across profitability, liquidity, efficiency, and growth. And with AI-enabled natural language querying, it’s like having your own personal BI assistant.
The solution sits on top of transactional systems of Dynamics 365 Finance, Supply Chain, and Sales, giving you a unified analytics layer across the whole business. You can combine data from these apps with Dataverse tables and external sources like CRMs, web analytics platforms, and legacy ERPs. This lets you track performance in one place, without manually consolidating data across systems.
Unlike traditional BI setups, Business Performance Analytics is built on standardised, finance-ready data models with governed metrics. This means you get consistent KPIs and reporting, and near real-time visibility into operational performance. Instead of fiddling with ad-hoc spreadsheets, teams can work with structured, reliable data that supports decision-making.
The platform also extends beyond data reporting by letting data be reused across the Microsoft ecosystem. The pre-built models can be accessed by Power BI and Power Apps developers to build more reports or apps. And data can be connected to Excel with automatic refresh, so you can work with up-to-date information in familiar tools, without manual exports.
Embedded Business Performance Analytics brings dashboards, reporting, and analysis right into Dynamics 365 Finance & Operations workspaces. Users can access KPIs, reports and self-service insights without switching tools or exporting data. This keeps analysis within the same environment where decisions are made.
This approach makes it a lot easier for business users to get on board and for teams to start working together. Security is also more straightforward, because any analytics we do follows the same roles and permissions that are already in place for Dynamics. So users only ever see the data they are allowed to look at, without having to worry about managing separate access levels.
A typical workflow is pretty simple and straightforward. A finance manager opens the “Financial performance” workspace, has a look at some KPI tiles, and then clicks into a profit and loss report to take a closer look. From there, they can drill down into individual transactions, and apply some filters by company, period, or dimension to really get into the nitty-gritty of how things are performing.
For a lot of mid-market organisations, the embedded Business Performance Analytics removes the need for a separate BI application. It works with the existing Microsoft setup, which cuts down on the effort needed for integration, while still delivering a complete analytics layer.
Business Performance Analytics comes with a set of prebuilt dashboards that are based on common use cases in finance and operations. These dashboards give you instant visibility into performance without needing to do any custom development.
Some of the typical dashboards you can expect include:
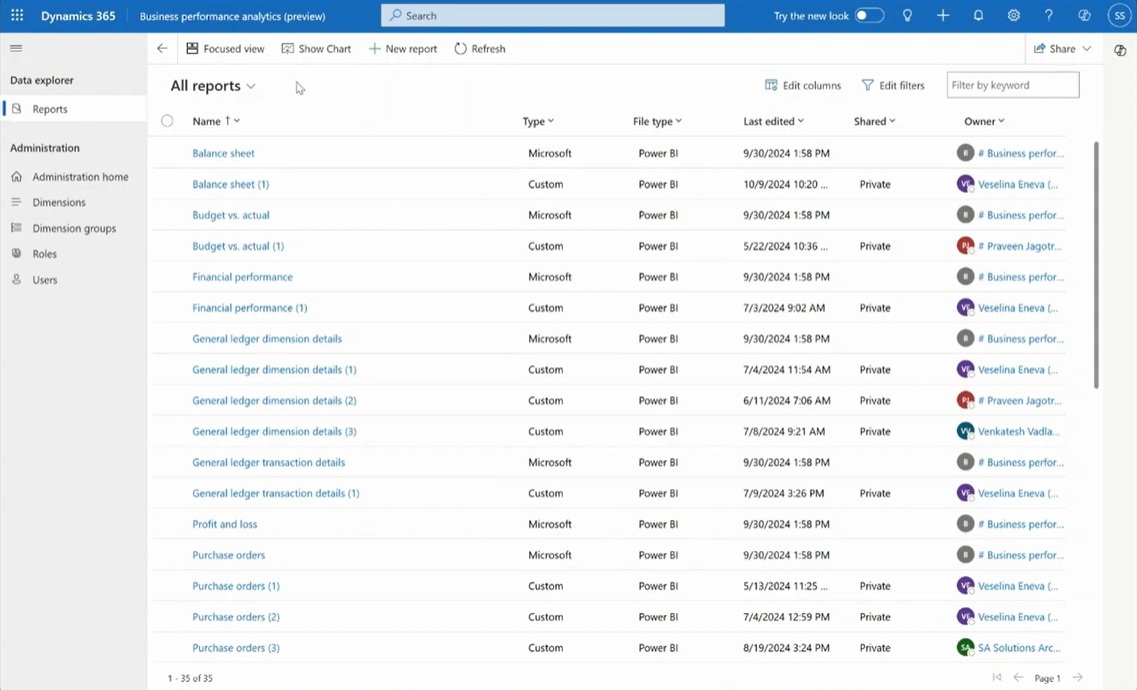
Each of these dashboards is built around standard KPIs that are used all the time in financial and operational analysis. These include budget vs actual variances, operating margin by region, DSO and DPO, and working capital trends over multiple quarters. This ensures that the reporting aligns with what your financial teams are used to.
The OKR dashboards are fully interactive – users can drill down from high-level KPIs into transaction-level data, apply filters by legal entity, business unit, or currency, and analyse performance over different time periods. This means teams can go from high-level insights to root cause analysis in just a few clicks.
Business Performance Analytics is built on a standardised, extensible data model. This model typically runs on Microsoft Dataverse or a Fabric-based warehouse, which combines structured financial and operational data into a unified schema.
Core data structures include fact tables for general ledger entries, subledgers, budgets, and forecasts. These are combined with dimension tables such as account, cost centre, customer, supplier, and product. This structure supports consistent and scalable analysis across the organisation.
All of the native reports and models in the business performance analytics app are created in Power BI. These models define key measures such as Gross Margin %, Operating Cash Flow, and Return on Invested Capital, along with time intelligence for period comparisons. This ensures that all reports use the same logic and definitions.
If you need to extend the model without disrupting standard reporting, you can do so without a problem. Additional entities such as subscription metrics, project profitability, or e-commerce funnel data can be added alongside the core financial model.
The default reports provided by BPA are a good starting point, but most organisations will need custom reporting to suit their business needs. We can help with that – our Power BI consultants can help you connect to the native BPA data models and create custom Power BI dashboards. Just get in touch to discuss your project.
BPA environments are designed to handle regular data refresh and increasing data volumes. Most implementations refresh core financial datasets twice daily, with additional on-demand refreshes during critical periods such as month-end or quarter-end.
Scalability is managed through a combination of data architecture and infrastructure planning. Historical data is usually stored in a data lake such as Azure Data Lake or Microsoft Fabric OneLake, while recent high-granularity data is kept in the main model for fast reporting. This balance ensures performance without losing long-term visibility.
Capacity is usually managed through Microsoft Fabric SKU. If you’re experiencing rapid growth, you should regularly review capacity against data volume and usage patterns.
For example, a multi-entity company growing through acquisitions may need to onboard several new legal entities each year. Even with this kind of expansion, the goal is to maintain fast refresh times and consistent dashboard performance for daily reporting.
Best practices include:
Business Performance Analytics can also function as a Data Analytics as a Service (DAaaS) layer. In this role, it becomes a central, governed data hub that feeds multiple downstream tools and teams.
Standardised models for general ledger, accounts receivable, accounts payable, projects, and inventory can be exposed to other systems. These include Power BI reports, Excel models, data science notebooks, and planning tools. This removes the need for each team to build separate data pipelines.
In practice, this supports a wide range of use cases. Retail organisations can stream daily store and online sales into BPA for unified store performance dashboards. Financial services firms can aggregate large volumes of transactions for risk and compliance analysis.
For mature analytics teams, this approach ensures consistent KPI definitions across departments – finance, operations, and data science teams all work from the same data foundation. It also supports advanced use cases such as demand forecasting or churn prediction using clean, well-structured data.
Many organisations are now combining BPA with platforms such as Microsoft Fabric, Azure Synapse or Databricks. BPA acts as the trusted source for core financial data, while these platforms support advanced analytics and large scale data processing.
Of course, not every organisation uses Dynamics 365, and that’s perfectly fine. If that’s the case, building business performance analytics will require a significantly different setup. The same goal is in play – creating a single, reliable view of performance – but the process involves a few more structured steps instead of just tapping into a prebuilt app.
The very first step is to start connecting with your data sources. That usually means your accounting systems, CRMs, marketing platforms and operational tools.
There are two ways to go about it. You can either use pre-built integrations – Vidi Corp are a good example of that – to quickly get your data pulled from Xero or QuickBooks Online into Power BI, or you can set up a custom data pipeline that extracts data automatically into a central storage layer.
Now that you’re getting data from the various sources, it needs to be consolidated into a single spot. This is usually done through a business intelligence data warehouse or cloud database.
What this does, is it removes data silos and makes sure that all reporting is based on a unified dataset rather than chipping away at it from disconnected systems.
Raw data is in no shape for reporting. It needs to be cleaned up, structured and standardised.
This step involves defining KPIs like revenue, gross margin, operating costs and cash flow. It’s also about making sure everyone uses the same logic when it comes to analysing performance.
After all that transformation, you need to get your data organised into a reporting model. This usually includes fact tables for transactions and dimension tables for attributes like time, customer, product or region.
A well-structured model ensures that reports stay scalable, consistent and easy to extend as the business grows.
Now the data model is in place, the next step is to build dashboards in Power BI. These dashboards bring KPIs, trends and performance drivers to life.
They usually include drill-down capabilities, filters by entity or period, and interactive elements that let users dive into the data in detail.
If you want to save some time on development, businesses can start with pre-built dashboards. Vidi Corp do Power BI templates for platforms like QuickBooks Online, Xero and Zoho Books.
These templates provide a structured starting point and can be customised to match your reporting needs.
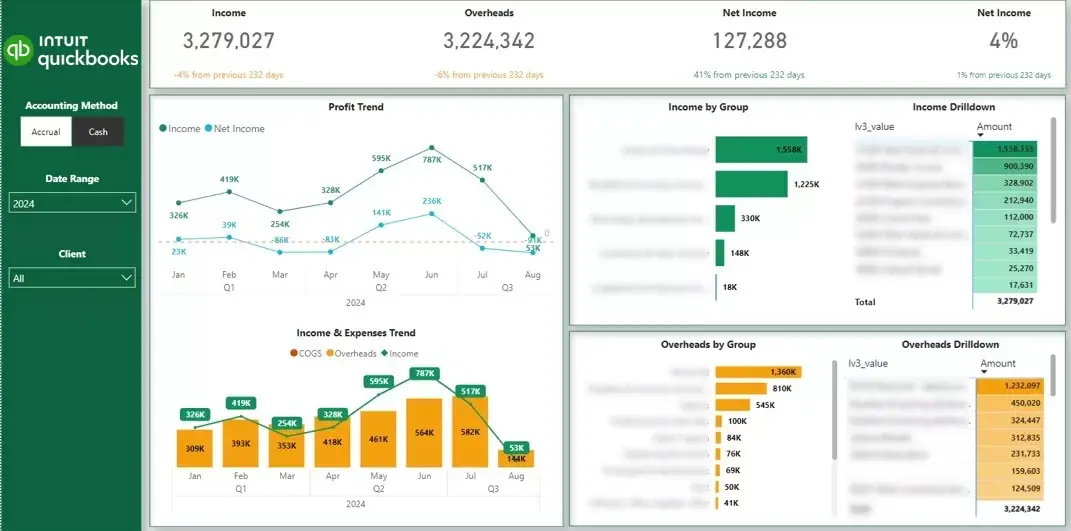
Once dashboards are live, the focus switches to maintenance and scalability. This means scheduling data refreshes, monitoring data quality and extending the model as new requirements come up.
Compared to Dynamics 365 BPA, this approach needs a bit more setup – data integration, modelling and reporting. But it gives you full flexibility if you use different systems.
Finance teams are ditching static monthly reports for continuous performance management. Instead of reviewing past results, they’re using analytics to guide decisions throughout the period.
Business Performance Analytics supports this shift by enabling 12-18 month rolling forecasts and structured scenario analysis. Teams can model scenarios such as a 3% price drop or supplier disruption, and immediately see the impact on revenue, margin and cash flow. Leading indicators like order backlog, pipeline conversion and demand trends give early warning signs that issues might appear in financial results.
By 2026, these capabilities are being enhanced with advanced analytics. Predictive models are used for cash flow forecasting and revenue run-rate projections – helping finance anticipate future performance. Anomaly detection highlights unusual expense patterns or deviations from expected trends while driver-based models link operational inputs to profitability outcomes.
Organisations that integrate these capabilities into quarterly business reviews and strategic planning tend to respond faster to change. With continuous visibility and forward-looking insights, they can adjust plans early and manage volatility better.
Business performance analytics is no longer just about reporting what happened. It provides a structured way to monitor performance, standardise KPIs and make faster, more informed decisions across the business. Whether through Dynamics 365 or built from scratch, the value comes from having reliable, actionable insights all in one place.
If you want to build or improve your business performance analytics, we can help. Get in touch to create custom Power BI dashboards tailored to your systems, data and decision-making needs.


