

Legal business intelligence brings together financial, operational and client data into one spot where they can make faster decisions to improve account management, operational and financial management. Instead of relying on separate spreadsheets and static monthly reports, firms use real-time analytics to improve profitability, make the most of their resources, get their collections in order and give their clients the service they expect. With pricing under pressure and clients expecting more, law firms are getting help from BI to streamline their internal processes and get more done.
As a BI consultancy, we’ve worked with professional services and legal clients, using Power BI, Tableau, and Looker Studio (Google Data Studio) to create custom dashboards. These give all sorts of people inside a firm – managing partners, practice heads, fee earners, finance teams, General Counsels, Chief Legal Officers and Deputy General Counsels – real-time visibility into how the firm is performing through something that’s easy to use and really tailored to their needs. These dashboards bring data from practice management systems, billing platforms, CRMs and finance tools all into one place – the source of truth for making operational and strategic decisions.
In this article, we’ll explain how law firms use business intelligence, take a look at some real dashboard examples and KPIs, and walk through the key steps for implementing a successful legal BI strategy.
Legal Business Intelligence means bringing all the relevant data together – time tracking, billing, matters, clients and finance systems – to support data-driven practice management decisions. This lets firms keep a close eye on profitability, resource utilisation, client performance and operational efficiency in one business intelligence dashboard.
Modern legal BI platforms can automatically pull data from spend management systems, contract management tools, CRMs, timekeeping software and accounting systems into a single source of truth. This saves on manual reporting and lets attorneys focus on billable work rather than digging through spreadsheets.
Unlike static monthly reports, business intelligence gives you interactive, near-real-time dashboards with drill-down capabilities. Law firms can quickly get to the bottom of what happened, why it happened and what to do next.
Different teams use legal BI differently. Managing partners are keeping an eye on firm performance and profitability. Finance teams are tracking billing, collections and cash flow. Practice leaders are analysing workload and matter performance. Business development teams are hunting for new opportunities while individual lawyers are keeping an eye on their billable hours and matter progress.
Law firms are operating in a tougher competitive environment than ever. With alternative legal service providers putting the squeeze on, clients demanding more transparency and pricing competition on the rise, firms can’t just rely on revenue growth to make up for falling margins. The focus has shifted towards getting more efficient and making the most of their profitability while still giving clients competitive rates.
Business intelligence helps firms spot hidden inefficiencies that can have a real impact on their profit. Poor time capture, delayed billing, write-offs, underperforming matters and unpaid invoices can go unnoticed when firms are relying on static reports or spreadsheets. With real-time analytics firms can spot where revenue leaks are happening and do something about them before they impact performance.
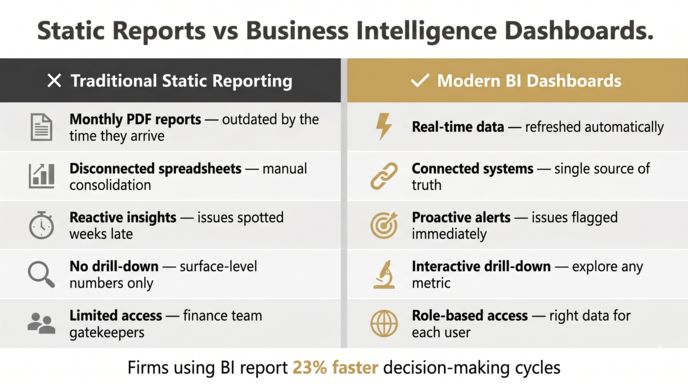
Some of the common benefits of business intelligence for law firms include:
By pulling all operational and financial data into one reporting environment, business intelligence lets law firms react faster, improve their profitability and make more confident decisions across the firm.
A successful law firm business intelligence strategy goes beyond just data visualization dashboards. It combines connected data, reporting tools, people and operational processes into one system that supports better decision making across the firm. The goal is not just to report on performance but also to improve how the firm manages profitability, staffing client relationships and future growth.
Most law firms build their BI strategy around data warehouses that bring information from billing systems, practice management platforms, CRMs, document management systems and finance tools into one place. This gives everyone from finance teams to managing partners to practice groups access to the same numbers and a single version of the truth.
Law firm BI strategies typically include four levels of analytics:
When all these layers are working together inside a unified BI environment, law firms can move away from just playing catch-up and start making faster, more strategic decisions with data that’s reliable and shared.
Financial business intelligence for law firms focuses on digging into the numbers behind the firm’s performance – the financials – using connected data from the operations and accounting. Law firms use financial BI dashboards to keep an eye on metrics like fees billed, fees collected, realisation rates, profitability by partner, profitability by practice area, write-offs, and cash flow trends. By combining billing, matter management, and accounting data into one place, firms get a clearer picture of who their profitable clients are, which partners deliver the greatest return, and what practice areas are lagging behind.

For one law firm we worked with, we developed a financial BI dashboard that zeroed in on accounts receivable management. The dashboard took outstanding balances by client and gave the finance team a real-time view of all those unpaid invoices across the firm. Users could dive in and explore specific clients, matters, and invoice ageing categories to pinpoint those overdue balances right away. We also set up automated alerts that notified the team as soon as a client balance had gone overdue for more than 60 days, so they could pick up follow-ups right away and keep a close eye on collection risks.
The dashboard helped the firm get a better handle on unpaid fees and reduce the risk of letting bad debt slip through the cracks unnoticed. Rather than relying on static finance reports or laboriously going over everything manually, the finance team could spot those overdue accounts at a glance and get in touch with clients sooner in the collection cycle. This all added up to improved cash flow predictability, beefed up collections processes, and partners got a better handle on the financial health of their client portfolios too.
Operational business intelligence for law firms is all about figuring out how the firm is really using its people, time and resources – and whether it’s really getting the most out of them. These dashboards typically track utilisation, billable hours versus non-billable, workload distribution, staffing levels, and how efficiently the operation is running across practice groups. The end goal is to help law firms boost profitability by making sure attorneys are spending enough time on billable work while keeping the workload spread evenly across the firm.
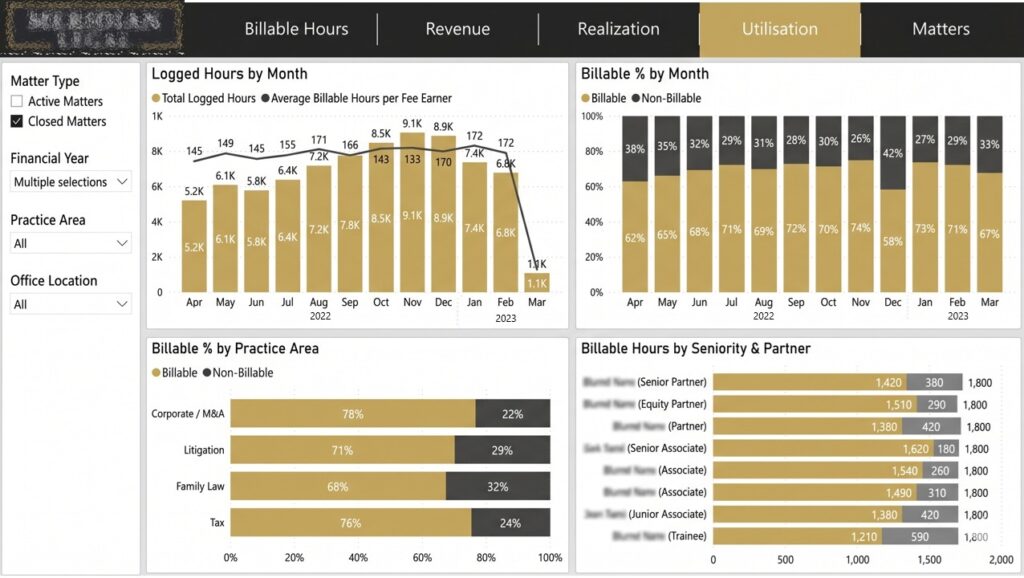
For one law firm client, we built a utilisation dashboard that took a close look at billable and non-billable hours across the organisation. The dashboard crunched utilisation percentages by month, by practice area, and by individual employee using timekeeping and matter management data. Partners and practice leaders could drill down into specific teams or attorneys to compare actual numbers against those targets the firm had set and pick up on trends over time.
The law firm uses this dashboard during employee performance reviews to see if their attorneys met their utilisation targets. It also helps leadership spot teams that are underutilised, uneven workload distribution, and too much non-billable activity that can really hurt profitability. By getting a better view of how time is being spent, the dashboard helps make staffing decisions that are way more informed and supports overall financial performance.
Sales business intelligence for law firms focuses on analysing how clients are acquired, what kind of work is being done, revenue growth, and marketing performance. Law firms use sales BI dashboards to measure revenue, margin, and matter type by client, industry, and location to find out where the highest value opportunities are. These insights help firms see which practice areas are delivering the most valuable work, which client segments are the most profitable, and which marketing channels are generating the strongest pipeline of new work.
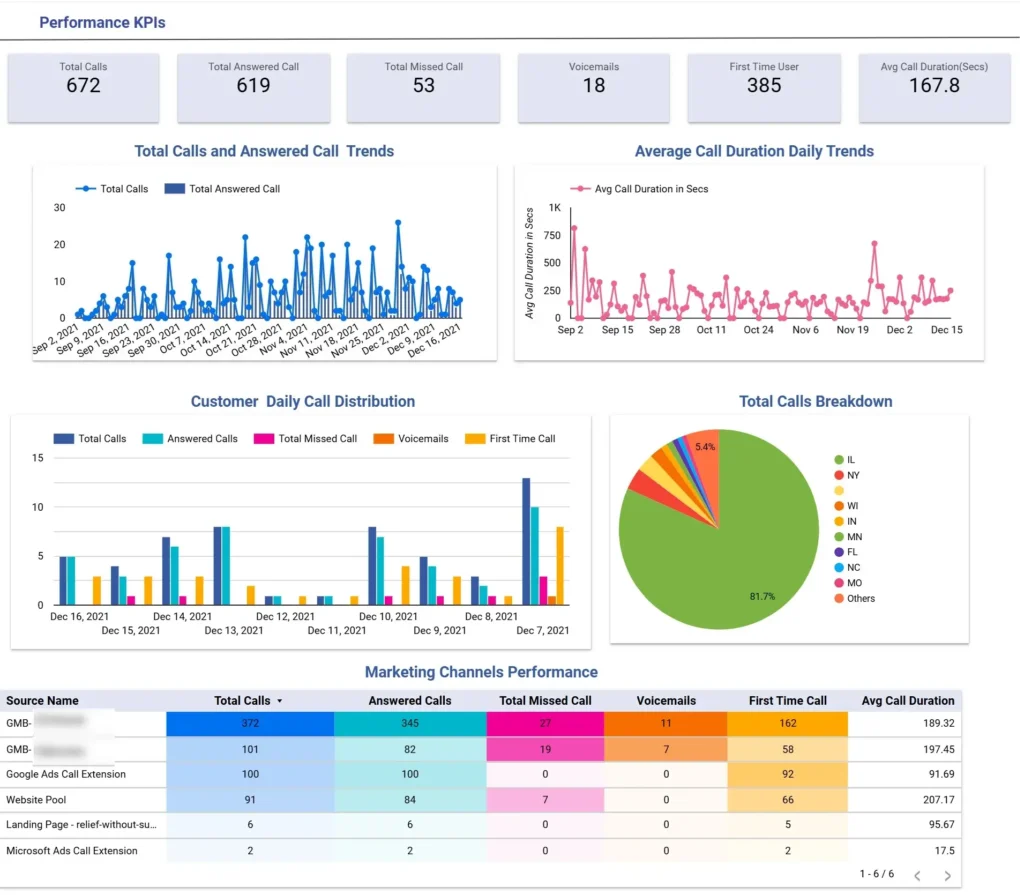
For a group of law firms we worked with, we built a Looker Studio dashboard that zeroed in on inbound call performance analysis – for firms that rely pretty heavily on inbound phone calls for local client acquisition. The dashboard took daily trends for total calls, answered calls, and average call duration and displayed them in real time. Calls were also categorised by status – answered, missed, voicemail, and first-time calls – allowing management to get a better grasp of how many calls are being answered, which ones are being missed, and what types of calls were good leads.
The bottom section of the dashboard looked at marketing channel performance. It compared total calls, answered calls, missed calls, voicemails, first-time calls, and average call duration across different channels – so the marketing team could see which campaigns were generating the most calls, and which ones were producing really high-quality, engaged leads. As a result, the marketing team could reallocate budget more effectively, fine tune their campaigns based on real data, and focus business development efforts on the channels that produced the most valuable client leads.
Choosing the right business intelligence software is one of the biggest decisions a firm makes when building out its reporting. The good news is there’s no single “best” tool. The right choice depends on the systems you already run, the budget you’re working with, and how much custom analysis your teams actually need. Most law firms end up with one of three platforms doing the heavy lifting: Power BI, Tableau, or Looker Studio. Each handles connected data, interactive dashboards and drill-down reporting, but they suit different kinds of firm.
Power BI tends to be the natural fit for firms already living in the Microsoft world with Microsoft 365, Excel and Azure. It’s strong on financial reporting, handles large data models well, and the licensing is hard to beat on cost. If your finance team is heavy on Excel and you want tight profitability and utilisation reporting, Power BI is usually where we start.
Tableau is the one to reach for when visual exploration matters most. It gives analysts a lot of freedom to slice data in ways that aren’t fixed in advance, which suits larger firms with a dedicated BI or data team who want to dig around rather than just read a report. It carries a higher price tag, so it earns its place best where that analytical depth gets used.
Looker Studio is the lightweight, browser-based option, and it’s free. For firms that lean on Google Workspace, or that mainly want marketing and business development dashboards pulling from sources like Google Ads, GA4 or CallRail, it’s a quick and affordable way to get visibility without a big upfront commitment. It’s less suited to heavy financial modelling, but for client acquisition reporting it does the job nicely.
| Platform | Best for | Cost | Strengths | Watch-outs |
|---|---|---|---|---|
| Power BI | Firms on Microsoft 365 and Azure wanting strong financial and utilisation reporting | Low to moderate | Excellent value, handles large data models, deep Excel and finance integration | Best experience inside the Microsoft ecosystem |
| Tableau | Larger firms with a dedicated BI or data team doing open-ended analysis | Higher | Powerful visual exploration and flexible ad hoc analysis | Premium pricing, needs skilled users to justify the cost |
| Looker Studio | Google Workspace firms and marketing or business development dashboards | Free | No licence cost, browser based, quick to deploy, strong with Google data sources | Less suited to heavy financial modelling and very large datasets |
| Legal-specific tools (Clio, Aderant, Elite 3E, iManage) | Quick operational reporting inside a single practice management system | Included with the platform | Purpose-built for legal workflows, no extra setup | Only see their own data, so they can’t give a firm-wide single source of truth on their own |
Implementing business intelligence in a law firm isn’t just about buying some software. It’s about changing the way the firm manages its data and uses it to make decisions. The most successful data analytics implementations usually start with a clear use case and gradually expand as the firm builds trust in its data and reporting processes.
Most law firms kick off by taking a hard look at their existing data sources, figuring out what’s missing in their reporting, and getting their data sorted across different systems so it’s consistent. Engaging a legal software consultancy at this stage helps ensure practice management and billing systems are structured for clean data extraction from the start. From there, firms usually pick a BI platform, set up an initial BI data warehouse or data mart, and create a small set of dashboards that focus on the key metrics that really matter for the firm – such as profitability or utilisation.
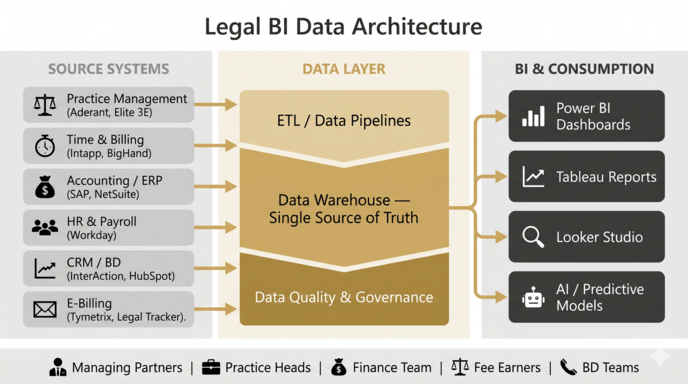
Common steps in implementing a BI project include:
Most law firm BI projects rely on linking into existing systems through APIs or pre-built connectors, including:
Data privacy and confidentiality are absolutely crucial during implementation. Law firms need to make sure that dashboards are set up so that users can only see data that’s relevant to their role or practice group. Audit trails, permission structures and secure cloud environments are all essential for protecting sensitive client and matter data and keeping things compliant.
Training is also really important. People need to be able to understand not just how to use dashboards, but also how KPIs are actually calculated. Clear definitions and consistent reporting standards help build trust in the data, and keep dashboards relevant to business goals over time.
A lot of early BI projects in law firms fail because they try to tackle too much at once, rely on dodgy data, or lack support from senior partners. Firms often underestimate just how important it is to get data consistency, stakeholder buy-in, and user adoption right if you want to get long-term value from a BI project.
Common BI challenges in law firms include trying to measure too many KPIs at once, or not having a clear idea what’s going on with time recording across different attorneys or practice groups. You also get issues with partners not trusting the numbers because they’re getting conflicting reports, or having dashboards that are too complicated to use. And sometimes, manual spreadsheet processes keep on going even though you’ve set up a BI system.
Practical ways to avoid these kinds of issues include:
The most effective law firm BI environments are the ones that are constantly being refined. KPI dashboards need to evolve alongside the firm’s pricing models, client mix, operational priorities, and growth strategy, rather than just being static “set and forget” reporting tools.
BI in law firms is rapidly evolving beyond just reporting on historical data. By 2026, AI, predictive analytics and workflow automation are going to be really important for helping firms forecast performance, reduce operational risk, and improve profitability. The leading firms are already using BI not just to understand past results, but also to predict future outcomes and automate operational decisions.
Emerging BI use cases in the legal industry include using AI to predict whether clients are at risk of churning, or to generate pricing recommendations based on historical matter data. As legal operations become more data-driven, firms are also starting to combine BI with automation and knowledge management systems to create more connected operational environments.
Strategic priorities for the next generation of legal BI include:
By 2026, the leading law firms will be treating business intelligence as a core management discipline rather than a standalone technology project. Those firms that build strong BI capabilities now will be better positioned to improve profitability, respond to client demands faster, and make more confident strategic decisions in a highly competitive legal market.
Business intelligence is becoming a must-have capability for modern law firms that want to improve profitability, optimise operations, and make faster, data-driven decisions. From financial reporting and utilisation analysis to client acquisition and matter profitability, the right BI strategy gives firms clear visibility into every key area of performance.
At Vidi Corp, we build custom Power BI, Tableau, and Looker Studio dashboards that are tailored to the operational and financial needs of law firms and professional services businesses. If you’re looking to create a custom legal BI dashboard or automate your reporting processes, get in touch to discuss your requirements.
There’s no single best tool, but for most law firms the strongest choice is Power BI, thanks to its low cost, deep Excel and Microsoft 365 integration, and strong financial reporting. Tableau suits larger firms with a dedicated data team that needs open-ended visual analysis, while Looker Studio is a free, browser-based option that works well for marketing and business development dashboards. The right pick depends on the systems you already run, your budget, and how much custom analysis your teams actually need. In practice, most firms combine a BI platform with the reporting built into their practice management system to get the best of both.
For matter spend and outside counsel reporting, the best approach is a dedicated BI platform such as Power BI or Tableau sitting on top of your e-billing and matter management systems. In-house legal departments deal with data spread across e-billing tools, spend management platforms and outside counsel invoices, and no single source covers all of it. A BI platform pulls these together into one view, so you can track spend by matter, by firm and by practice area, monitor budget against actuals, and spot billing that falls outside your guidelines. Power BI is usually the most cost-effective starting point, especially for departments already running Microsoft 365, while Tableau is worth considering where you need heavier ad hoc analysis across large volumes of invoice data.
To build a real-time revenue-per-attorney dashboard, connect your time and billing system to a BI tool like Power BI, Tableau or Looker Studio, then calculate revenue by fee earner from billed and collected amounts. The key steps are: pull timekeeping and billing data through an API or connector, clean and standardise attorney names and matter records so the numbers tie out, build a data model that links each fee earner to their billed hours and collections, and set the data to refresh automatically so the figures stay current. From there you can add drill-downs by practice area, client or matter, and layer in related metrics like utilisation, realisation and write-offs for a fuller picture of each attorney’s contribution. Most firms get this live with a focused build rather than a long project, then expand it once the team trusts the numbers.
The cost of a law firm BI dashboard depends mainly on how many data sources you’re connecting and how complex the reporting is, rather than a fixed price per dashboard. A focused first build, such as a single utilisation or collections dashboard pulling from one or two systems, is far quicker and cheaper than a firm-wide rollout spanning billing, practice management, CRM and finance. Software licensing also varies widely: Looker Studio is free, Power BI is low-cost per user, and Tableau sits at the premium end. Most firms keep costs down by starting with one high-impact use case, proving the value, then expanding once the team trusts the data. For an accurate figure, it’s best to scope the specific systems and metrics you want covered, since that’s what really drives the effort involved.


