
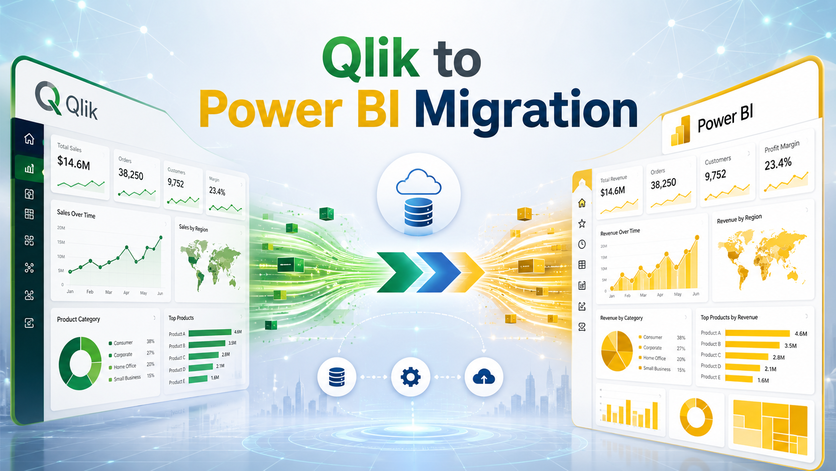
Many organisations are migrating from Qlik to Microsoft Power BI, in a bid to standardize on the Microsoft ecosystem, cut BI licensing costs in 2026, and give their analytics stack a bit of a modernisation. Often, it’s been a case of separate departments experimenting with different BI tools over time before leadership has made a centralised decision to standardise on a single enterprise reporting platform. And Power BI has become the go-to choice for organisations that are already heavily invested in Microsoft 365, Azure and Microsoft Fabric.
Moving from Qlik to Power BI is no straightforward “lift-and-shift” project. More often than not, organisations will need to re-design their data models, translate business logic, rebuild their visualisations, and give some thought to how self-service analytics should work in a more governed Microsoft environment. They’ll also need to tackle the differences between Qlik’s associative engine and Power BI’s tabular data model.
The main benefits of making the move to Power BI include tighter integration with Microsoft 365, Azure and Fabric, broader connectivity to enterprise data sources and stronger governance and security capabilities. Power BI also simplifies collaboration by natively integrating with Teams, SharePoint, Excel and Entra ID.
This article provides a step-by-step framework for planning and pulling off a Qlik to Power BI migration. We’ll be covering assessment, target architecture, migration timelines, testing, user adoption, governance and long-term optimisation.
At Vidi Corp, we specialise in enterprise BI migrations and modern analytics implementations. We’re the #1 BI consultancy in the world according to G2, and have delivered over 1,000 business intelligence dashboards for more than 600 clients across finance, healthcare, manufacturing, marketing, retail and professional services. Our consultants have hands-on experience migrating complex BI environments from legacy platforms into scalable Power BI ecosystems.
Power BI is gaining traction in 2026 as organisations consolidate their technology stacks around Microsoft. A lot of enterprises are rationalising legacy BI platforms in order to reduce costs, simplify governance and get their analytics in line with broader cloud modernisation initiatives such as Microsoft Fabric and Azure data platform adoption.
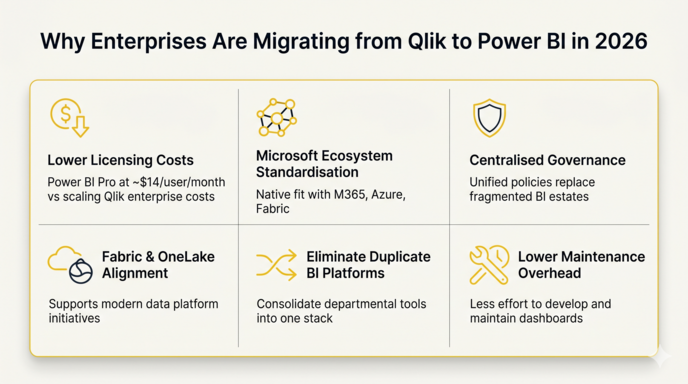
The main drivers for migration are:
Power BI licensing is often significantly cheaper at scale than maintaining separate Qlik environments. In 2026, Power BI Pro licenses typically cost around $14 per user/month, while Microsoft Fabric and Premium capacities support enterprise-scale deployments with centralised governance. Qlik Sense enterprise deployments often end up becoming more expensive as organisations scale users, servers and governed applications across business units.
A lot of Qlik developers also rely on workarounds to achieve functionality that is native in Power BI. For example, in Qlik there is no simple UI option to force a dimension filter across an entire sheet or chart collection. Developers often need to create custom actions or complex set expressions instead. In Power BI, this behaviour is handled much more naturally through relationships, slicer sync, filter panes and interaction settings. Power BI’s integration with Microsoft 365 and Azure significantly simplifies enterprise analytics workflows. Teams can collaborate directly in Microsoft Teams, export data to Excel, store reports in SharePoint and integrate with Azure SQL, Synapse, OneLake and Fabric Lakehouses without relying on multiple disconnected tools.
A lot of legacy Qlik environments also suffer from:
Organisations modernising their data platforms often align Qlik migration projects with broader Azure or Fabric initiatives. For example, companies moving towards Microsoft Fabric Data Lake architectures in 2026 often use that transformation program as the trigger to migrate reporting from Qlik into Power BI simultaneously.
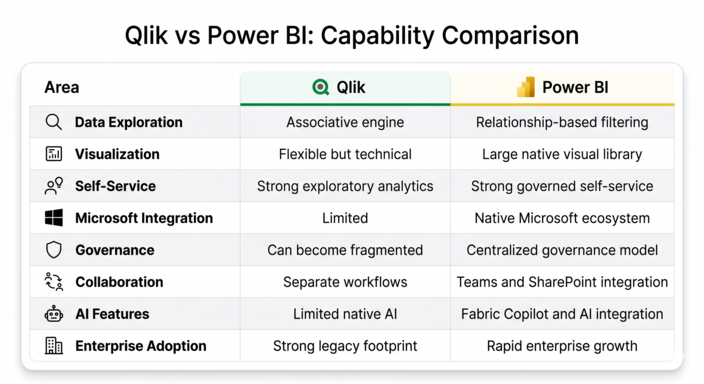
Before designing a migration strategy, organisations need a clear understanding of the differences between Qlik and Power BI capabilities. While both platforms support enterprise analytics, they approach data modelling, visualisation and self-service exploration in different ways.
Power BI offers a broad range of native visualisations out of the box, including KPI cards, decomposition trees, matrix tables, maps, waterfall charts, forecasting visuals and AI-powered insights. It also supports thousands of custom visuals through Microsoft AppSource and certified partner ecosystems.
Qlik’s core strength has historically been its associative exploration engine. Users can dynamically explore relationships between datasets using the green/white/gray selection model. This approach remains powerful for highly exploratory analysis and investigative workflows.
But Power BI now covers the vast majority of enterprise reporting requirements natively, including:
Power BI’s got a pretty impressive custom visual ecosystem going on these days – all the good stuff is now available through certified visuals, like:
The full article is actually a comparison table that lays out the main differences between Qlik and Power BI
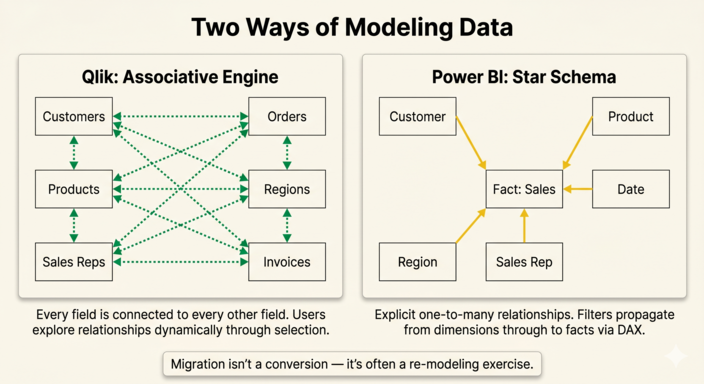
Qlik’s got this associative engine that lets you see how all the different things in your data relate to each other – it’s like a big network of relationships that just shows you right as you’re looking at it.
Power BI does things a bit differently – it’s based on a star schema and star schema modelling, with stuff like DAX measures and filter propagation between tables. It’s like trying to put together a big puzzle where you know what all the pieces are supposed to look like, so you can just build it up that way.
In Power BI, making a report is a lot more like engineering a build. You’ve got to:
So, this whole other way of thinking about data exploration is kind of a big deal.
Some of those Qlik apps can actually be easier to do in Power BI because the way you think about the data is more structured and easier to use. But if you were using the Qlik app to do some really associative kind of analytical work, then you’ll probably need to build a whole new data model to make it work in Power BI.
It’s not just a matter of training and stuff, though that’s part of it too. There’s a real conceptual shift going on here, and people sometimes need to get used to this whole new way of thinking about how data works.
Don’t try to rush into it without thinking about what you’re doing – that’s just going to end badly.
Some things to consider before you start:
Understanding how all that ETL logic is actually working in Qlik is a real challenge. There’s all this accumulated logic that’s been built up over the years, including things like:
And then you also need to decide which of that ETL logic should actually stay in Power BI and which should get moved upstream into something like Azure Data Factory or Fabric Dataflows.
You also need to get some non-technical stuff sorted out too, like:
And then there’s the question of whether you should just move all the dashboards over to Power BI one-for-one, or if you should actually take some time to rationalize the reporting and make it all a bit more standard.
Some of these environments have hundreds of Qlik apps just lying around – it’s a real mess. Often, you can end up with just a few dozen Power BI reports that are all actually useful and controlled.
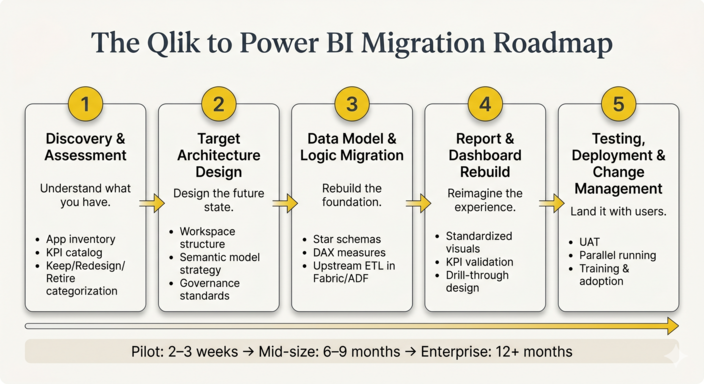
A successful Qlik to Power BI migration should be viewed as a transformation project that unfolds over time, not just a simple swap out of dashboards. Some companies start small with a Power BI implementation pilot that involves just a handful of their most critical applications, while others tackle hundreds of Qlik apps over the course of multiple years as part of a broader effort to modernize their data setup.
The specifics of the roadmap depend on several factors – how big the environment is, how much ‘brain power’ is tangled up in the business logic, and what kind of shape the existing data platform’s in. However, the biggest business intelligence success stories basically all follow a similar sequence of steps: discovery, architecture design, data model migration, dashboard rebuilding, testing, deployment, and ongoing fine-tuning.
One of the biggest mistakes companies make is treating migration as a purely technical undertaking. In reality, though, a successful project relies on a team effort involving BI developers, data engineers, IT staff, and business stakeholders working closely together. You need to figure out who’s in charge right from the start, or projects tend to stall when it comes time to validate KPIs and get user sign off.
Timelines vary a lot depending on complexity. A pilot involving just a handful of relatively simple Qlik apps might be done in a couple of weeks, but a large company with hundreds of applications, complicated data reload logic, and multiple business units might be looking at 6-12 months or more.
There’s tools out there that can automate some of the more repetitive work – they can be especially useful for taking stock of what you’ve got and figuring out how all the different components fit together. However, they don’t make the human element go away – you still need people to do the redesign, testing, and stakeholder validation to make sure the final Power BI setup really does support the business processes.
The very first phase of the whole process is getting a clear picture of just how complicated your Qlik environment is. A lot of companies think they’ve got a manageable number of apps, only to discover that they’ve got hundreds of dashboards, duplicated KPIs, undocumented dependencies, and old reports nobody really understands anymore.
First things first, you need to get a good inventory of all your Qlik View and Qlik Sense applications – this includes data models, scheduled data reloads, user groups, extensions, embedded calculations, and data sources. You also need to figure out how often each report is used and which teams rely on it for making operational or strategic decisions.
In cases where the Qlik environment has been around for a while, business logic can end up being pretty deeply embedded into load scripts and set analysis expressions. It’s not uncommon to discover that the same KPI is being calculated in a different way across multiple applications – and getting that all sorted out before you start rebuilding reports in Power BI is a pretty critical part of setting up a sustainable setup.
As part of the assessment phase, you also want to take a hard look at some operational metrics like:
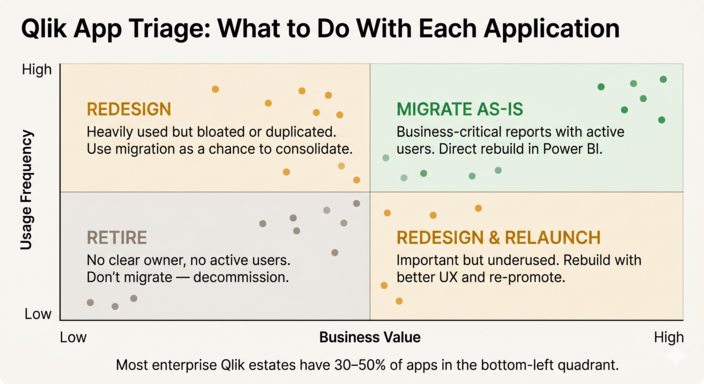
This part of the process often reveals opportunities to simplify the reporting landscape a lot. A lot of companies end up finding that they can either retire a lot of their old Qlik apps or consolidate them into standardized Power BI reporting suites.
You typically end up categorizing your apps into three groups:
By the end of the discovery phase, you want to have a clear plan for what apps to migrate, a rough idea of how long it’s going to take, and stakeholder buy in on the overall roadmap.
Once you’ve got a good handle on where you are today, the next step is designing the future-state business intelligence architecture for Microsoft analytics. This is a big deal – it has a huge impact on how scalable your setup is going to be, how easy it is to govern, and how sustainable it is over time.
A lot of companies use the migration process as an opportunity to standardize their analytics ecosystem around Microsoft technologies. That might mean setting up Azure SQL Database, Synapse, Fabric Lakehouse, OneLake, or Fabric Dataflows, depending on what kind of data strategy you’re in.
In this phase, you typically define:
One of the key decisions you’ll make is whether to centralize semantic models by business domain. In a lot of enterprise environments, that dramatically reduces duplication and improves KPI consistency.
For example, instead of building separate data sets for every finance report, you might create a centralized finance semantic model that supports multiple dashboards and reporting apps. You can then do the same thing for sales, operations, procurement, and HR reporting.
This phase is also where you need to formalize your governance standards – that means defining naming conventions, development environments, deployment processes, and workspace permissions before you start large scale report migration.
Companies that skip this step often end up recreating the same governance issues they had in Qlik, only now inside Power BI.
Getting Qlik load scripts and set analysis into a Power BI model that can scale is usually the hardest part of the migration.
A lot of legacy Qlik applications have years of accumulated transformation logic – some of it was originally created as a temporary workaround but ended up becoming a critical business process. Before you even start rebuilding anything in Power BI, you need to fully understand how the existing calculations work.
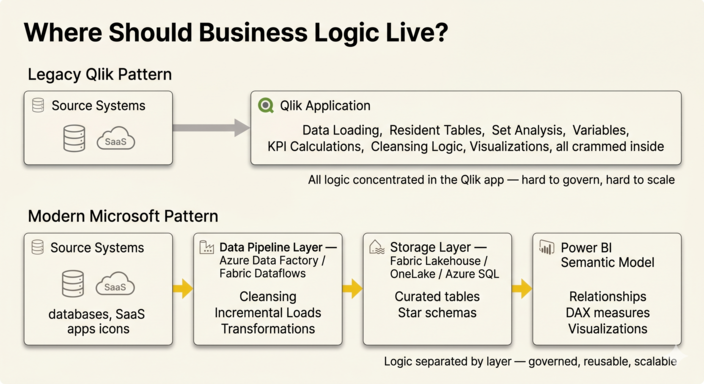
This phase usually kicks off with some serious digging – we’re talking reverse-engineering those Qlik scripts to figure out which transformations are worth reusing. Once you’ve got that sorted, it’s time to decide what logic should stay in Power BI and what can be handed over to those centralized data pipelines.
Nowadays, in a modern Microsoft environment, a whole lot of those transformations that used to live inside Qlik end up being migrated into:
What this means is your Power BI models are going to be cleaner, and you’ll have better governance in the long run. And that’s just the tip of the iceberg.
Developers are also going to need to go back and rethink the data model itself. The way Qlik’s associative engine works is totally different from Power BI’s tabular model, so many apps are going to need to have their schema redesigned rather than just relying on a simple conversion.
When it comes to data analytics best practices during this stage, you should be thinking about:
And let’s not forget about Power BI performance optimization – this is especially important here. Big datasets, poorly optimized DAX, or a weak relationship design can quickly blow up into a scalability nightmare once reports are deployed to a bigger user group.
Organizations that are planning on doing enterprise business intelligence deployments also need to start thinking about capacity planning, partitioning strategies, and refresh architecture – that’s a lot to take in, and it’s not something you want to leave until the last minute.
Once you’ve got the underlying models sorted, it’s time to rebuild those reports and dashboards in Power BI. Now, this is not just about slapping some new visuals on an old dashboard – it’s a chance to really take a step back and improve usability, simplify navigation, and standardize the reporting experience across the whole organisation.
Many Qlik environments just kind of… evolve over time, with different teams building dashboards independently. The result? Inconsistent layouts, duplicated metrics, and a really fragmented user experience. And that’s exactly what a Power BI migration gives you – a chance to introduce a more unified reporting framework.
The most successful migrations define a standard visual language right at the start. That means thinking about navigation patterns, color palettes, KPI formatting, filter behaviour, and drill-through design – all the things that make a report or dashboard actually usable.
This phase is also where you decide which data visualization dashboards should stay interactive Power BI dashboards, and which should become paginated reports for regulatory or operational reporting requirements.
Those KPI validation workshops are crucial here too. Business users need to be able to confirm that the Power BI outputs match the numbers they trust from Qlik before you roll those reports out to a wider audience. Even a tiny discrepancy can quickly erode confidence in the new platform.
When it comes to custom visuals, you need to be pretty careful. Power BI has a huge visual ecosystem, but you should be prioritising certified visuals over introducing unnecessary long-term support complexity.
Now here’s the thing – many BI migration projects fail not because of technical problems, but because users just don’t trust or adopt the new platform. And that’s why testing and change management are just as important as development itself.
Testing needs to happen in multiple stages throughout the migration process. Developers will usually start with some technical validation of data models and calculations before moving on to regression testing against existing Qlik reports.
Performance testing is just as important, especially for those large enterprise datasets. Slow refresh times or poor report responsiveness can quickly damage user confidence.
User acceptance testing needs to involve real business stakeholders – not just the technical teams. Finance, operations, sales and executive users all interact with dashboards in totally different ways, and their feedback will often reveal usability issues that developers wouldn’t even notice.
Most enterprise dashboards use structured Power BI deployment pipelines with separate development, test and production environments. Release schedules should also align with operational cycles like month-end close or quarterly reporting periods, to reduce disruption.
Change management is often totally underestimated during BI migrations. Users who’ve been working with Qlik for years need some support transitioning to new workflows, filtering behaviour and navigation patterns.
Organizations that see stronger adoption usually provide:
And sometimes you do need to run Qlik and Power BI reports in parallel for one or two reporting cycles before finally decommissioning legacy applications. That gives stakeholders time to validate outputs and build confidence in the new reporting environment.
Now many organisations really underestimate the Qlik to Power BI migration at the start of the project. They think it’s all about rebuilding dashboards in a different tool – but in reality, the biggest challenges come from hidden business logic, fragmented governance, and competing stakeholder priorities.
One of the most common risks is scope creep – once departments find out the migration is happening, they often start asking for extra KPIs, redesigns or brand new reporting capabilities. Without clear governance and prioritisation, projects can quickly get out of hand and blow past the original timeline and budget.
Another major challenge is underestimating the complexity of those existing Qlik applications. Many legacy environments contain years of embedded logic inside load scripts, variables and set analysis expressions. Some reports may also depend on undocumented manual processes or business rules that only a handful of users understand.
Timelines do vary depending on the maturity of the existing environment – smaller migrations can often be completed relatively quickly. But enterprise-scale migrations usually require a phased rollout approach.
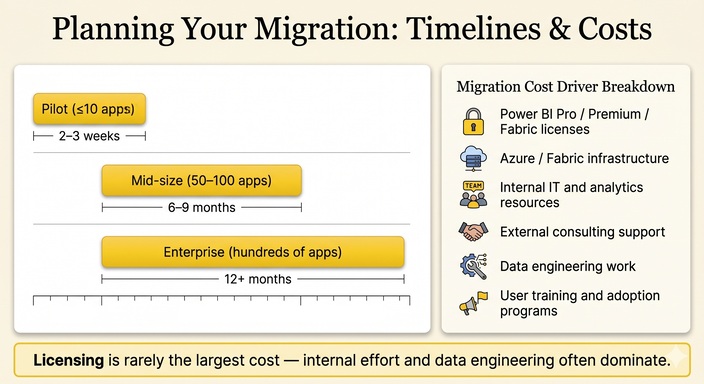
Of course, the size of your reporting estate is just one factor – data quality, governance maturity, user adoption requirements, and the health of your underlying data platform all have a pretty big impact on how long a project’s gonna take
Cost planning is just as important as project timelines. Lots of organisations focus on the cost of Power BI licences, but they tend to low-ball the overall investment needed to get your BI ecosystem up to speed properly.
Typical cost drivers include:
Strong governance is probably the best way to reduce migration risk – clear ownership, phased delivery, executive sponsorship and structured testing processes can all help you avoid the pitfalls of a complex project.
As more and more organisations are migrating their BI solutions, it’s not a shock that lots of them are turning to migration accelerators to speed up the process and reduce the amount of manual work. These accelerators can be a real game-changer when you’re dealing with large portfolios of Qlik apps that all follow a similar structure or pattern.
At Vidi Corp, we’ve found that our Qlik to Power BI migration accelerators can help organisations get the most technically complex Qlik reports migrated to Power BI in no time – and while that’s happening, we can also be training up your internal teams to take over and maintain the new environment.
Our accelerators are especially useful in the early stages of a project – they can accelerate some of the discovery process and help you identify applications, extract metadata, document dependencies and even get inside the logic of those pesky Qlik scripts.
They can also help generate some of the initial Power BI model structures or DAX templates to save you from having to do all the manual development work yourself.
However, you can’t treat accelerators as some kind of fully automated migration solution – the real complexity usually comes from things like redesigning the reporting experience, validating KPIs, simplifying governance and getting the new solution to align with modern business processes.
For example, a migration accelerator can tell you how a Qlik set analysis expression works technically, but it can’t tell you if that KPI definition is still relevant to the business or if the reporting workflow should be totally overhauled.
The organisations that get the most value from accelerators are the ones that have hundreds of similar Qlik apps, or where the reporting logic is pretty standardised, or where the existing environment is being replicated elsewhere and so on.
Manual redesign is usually the way to go for executive dashboards, advanced analytical applications or highly customised reporting workflows.
The most effective strategy is usually a hybrid one – use the accelerators to reduce the amount of repetitive work and documentation, and then get your experienced architects, developers and business stakeholders to make the big design and governance decisions.
Lots of organisations think that once they’ve reached the final “go live” stage of their migration project they can just sit back and relax – but in reality that’s when the real work is just getting started.
Once Power BI adoption starts to take off across the business you’ll find that reporting environments can grow and change very rapidly – without proper governance you’ll end up recreating the same old problems you had with Qlik – duplicate reports, inconsistent KPIs, fragmented ownership and uncontrolled self-service development.
Long-term governance should focus on maintaining consistency while still allowing teams to innovate and build new analysis.
One of the most important priorities after migration is semantic model consolidation – during large migration projects multiple teams often end up creating overlapping datasets and duplicate calculations – these need to be standardised into centralised, governed semantic models that support multiple reports across departments.
Performance optimisation also becomes a big deal as adoption grows – large enterprise datasets, frequent refresh schedules and complex DAX calculations can create scaling issues if you’re not on top of it.
Organisations typically optimise:
Many enterprises set up a formal Power BI Center of Excellence after migration – it’s usually responsible for defining governance standards, reusable templates, training programs, review processes and best practices for report development.
This helps organisations maintain consistency as more departments start creating their own analytics solutions.
Monitoring is another area that gets overlooked – Power BI provides extensive administrative and usage monitoring capabilities that can help you understand how reports are actually being used.
Teams should be regularly reviewing:
Organisations should also decommission Qlik in a phased way rather than simply throwing everything at a big changeover event. Trying to run both platforms simultaneously for a while reduces the risk of everything falling over and gives business users some breathing space to get used to the new way of doing things.
One of the key aims of migrating to Power BI is to give business users a lot more freedom to do their own analysis and to get better access to the data they need faster.
But no one wants to go down the route of giving business users total freedom to create their own reports without any rules to follow – that just leads to a whole load of fragmentation and a headache for everyone.
What it often comes down to is striking a balance between giving people the flexibility to get their heads down and start working on something, and keeping the business under some kind of control.
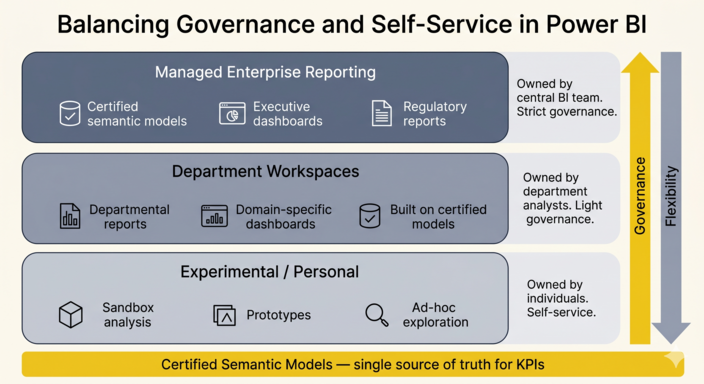
The organisations that get Power BI right usually keep managed enterprise reporting separate from the more ‘adhoc’ self-service stuff. They use certified semantic models to make sure everyone is using the same set of KPIs and business logic, and still give users the chance to build their own stuff on top.
Many organisations create separate workspaces for stuff like this:
Having these separate spaces helps to reduce the risk of some dodgy report creeping in and becoming a critical business issue without anyone really noticing.
Datasets that have been certified as ‘official’ are especially important in big organisations. They help people understand what they can trust and what’s just some skunkworks report that was thrown together by a bright spark somewhere.
Getting the training right is also a big part of safe self-service adoption. Different user groups need completely different learning paths.
For example:
So building some kind of user community can help a lot here. Lots of organisations create Teams channels or office hours sessions or internal forums for people to ask questions and share best practices.
Having a decent documentation strategy in place helps too. Clear naming conventions and report catalogs and governance guidelines all help to keep people on the right track and make them more self-sufficient over time.
Power BI and the Microsoft ecosystem are always changing rapidly, so it’s organisations that get their governance right while still encouraging self-service innovation that tend to do best in the long run.
Moving from Qlik to Power BI is a big opportunity to not just upgrade your reporting tools but your whole analytics operating model. If you do it properly, you can reduce costs and improve governance and get everyone on the same page with their KPIs, and start to build a really solid foundation for really modern self-service analytics.
At Vidi Corp, we help enterprises sort out those complex Qlik to Power BI migrations. We can help you get to grips with your data architecture, dashboard development, governance and automation and user adoption. If you are planning to move your Qlik reports to Power BI, get in touch with our team to chat about your migration roadmap and your modernisation strategy.


