

Government agencies are among the largest data generators in the world. Whether its public health, defence, transportation, procurement or something else, Government organisations pretty much throw off a massive amount of data every single day. And that’s where modern government business intelligence (BI) comes in – it’s that magical process of taking all of this data and turning it into actionable insights that actually make a difference to public services. This can include things like improving transparency, supporting policy decisions, reducing costs and just making things run a whole lot more efficiently.
As a business intelligence consultancy we’ve worked with loads of different public sector organisations, all the way from the UK Ministry of Defence down to local councils and healthcare organisations. Our teams have delivered over 1,000 BI dashboards and reporting solutions using tools like Power BI across a range of different projects that have all been aimed at helping public sector operations to work a lot faster and more efficiently.
But these days, business intelligence in government is about so much more than just dashboards and reports. It now combines data integration, governance, analytics, automation and even citizen-facing communication into a single, unified system that supports accountable and evidence-based decision making.
In this article, we are going to explore in a bit more depth what ‘business intelligence’ actually means for government agencies, and we will be covering topics like key government BI use cases, implementation best practices and some of the most commonly asked questions around BI for government agencies.
Government agencies collect vast amounts of data across taxation, healthcare, transportation, policing, elections, education, and social services – just to name a few areas. Federal departments spend a lot of time monitoring national spending and security operations, while local councils are busy analysing housing demand, waste collection performance, traffic congestion and citizen service requests in real-time.
For the public sector, this data has simply got too big and too complex to manage using spreadsheets and disconnected reporting systems alone. That’s where business intelligence tools come in, helping government agencies to combine information from multiple systems into a single, governed environment where leaders can see what’s going on, measure the impact of their policies and respond faster to changing public needs.
Tools like Power BI, Tableau and SQL Server give federal, state, and local governments the power to automate reporting, track KPIs, forecast service demand and identify operational bottlenecks. For example, healthcare organisations can use BI to forecast patient volumes, transportation departments can monitor infrastructure performance, and local councils can get a handle on service delivery trends across different regions and departments.
But effective business intelligence is not just about getting the data in and out quickly. Strong BI governance is also about ensuring data quality, transparency and accountability by making sure decision-makers have access to accurate and consistent information, which is particularly important in government, where a reporting error, fragmented systems or delayed insights can have a real impact on public services and budget allocation.
As public expectations just keep on rising, government agencies are increasingly turning to BI platforms to support evidence-based decision-making, improve operational efficiency and communicate performance more clearly to both internal stakeholders and citizens.
Business intelligence in the public sector is different to private sector BI, because the focus is not just on financial performance, but also on things like accountability, compliance, service quality and long-term social outcomes. Government agencies must balance efficiency with transparency and equitable service delivery across communities.
Modern BI platforms help public organisations to monitor key services and make better decisions. Education departments track school performance and attendance metrics, while emergency services are using BI to monitor 911 response times and staffing levels in real-time. Governments also use BI for resource allocation, fraud detection, regulatory oversight and citizen engagement to improve operational efficiency and build trust with citizens.
Public sector analytics is now an essential part of modern governance. Initiatives like Data.gov in the US, and open data platforms across the UK and EU, show just how governments are increasingly relying on data transparency and analytics to measure policy impact and improve public services.
At the same time, government data reporting has come a long way. Many agencies are ditching static PDF reports and disconnected spreadsheets in favour of automated dashboards and live reporting systems that get updated daily or even hourly using tools like Power BI, Tableau and SQL Server.
Business intelligence can support nearly every government department, from finance and public safety to healthcare, transportation and citizen services. However, some BI use cases consistently deliver the highest operational and strategic impact across city, county and state-level governments. Here are a few examples of how public sector organisations are using modern analytics, dashboards and automation tools to improve decision-making, increase efficiency and deliver better services to citizens.
Business intelligence is widely used by governments to make public information more accessible and show progress directly to citizens – and many government agencies now put Power BI dashboards right onto the public websites so residents can see for themselves how tax dollars are being used and how different public services are performing.
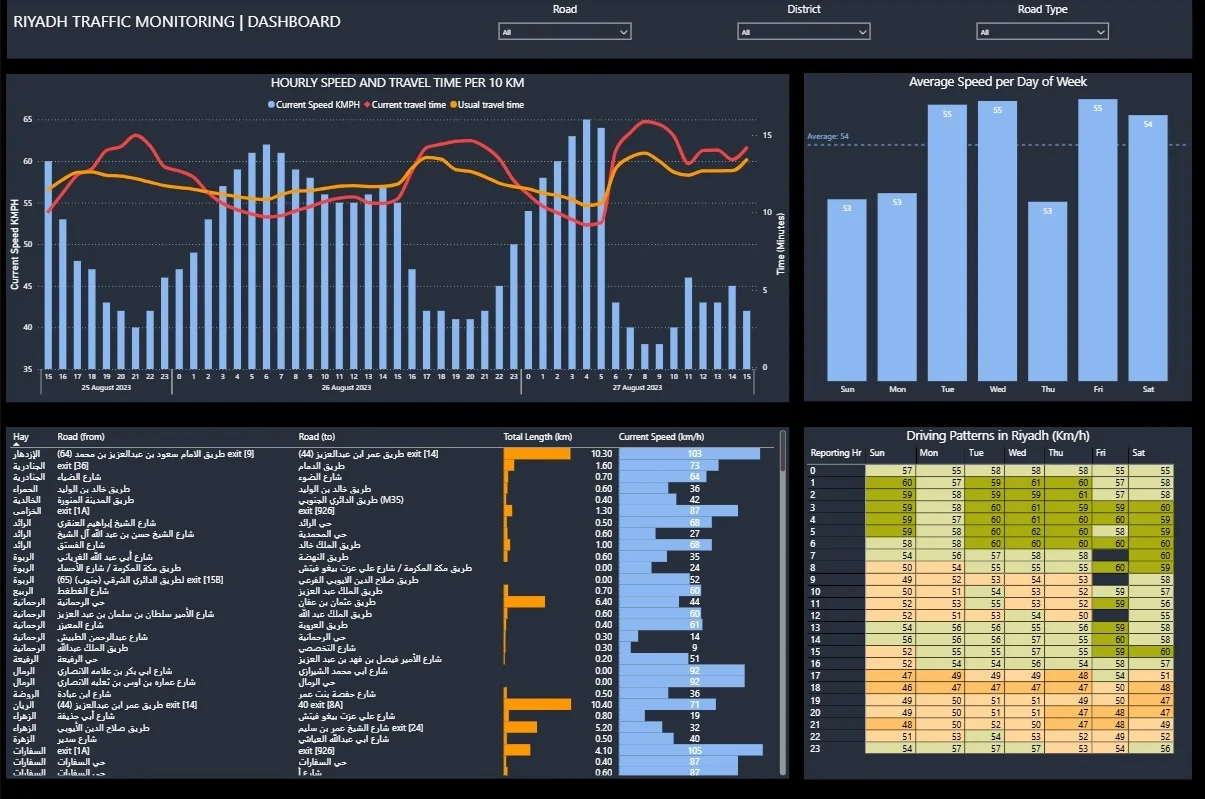
For example, our BI consultants put together a public-facing Power BI dashboard for a government organisation in Riyadh, Saudi Arabia, that was all about road safety and traffic analysis. The dashboard took a whole bunch of transportation and traffic data and used it to track road incidents, traffic congestion, and vehicle speeds across the city at different times and locations. We also did some pretty interesting analysis to show average traffic speeds by hour and day of the week, which times and places get really congested, and incident frequency trends over time – all that kind of thing. The data visualization dashboard also highlighted changes in traffic patterns over time, so stakeholders could see how traffic patterns changed on different days of the week, and especially during peak hours.
This type of BI solution helps governments be more open with information while at the same time supporting more informed decision-making around things like infrastructure. Citizens get to see traffic conditions, congestion trends, and road safety performance in real time – and transportation departments can use that info to identify high-risk times or situations, come up with better traffic management plans, and prioritise infrastructure improvements more effectively. Plus, automated reporting means that both the public and decision-makers get access to the latest transportation data in real time, rather than waiting on static reports that could be out of date by the time they see them
Operational business intelligence helps government agencies to see what’s going on, identify bottlenecks and improve how public programs are delivered. Its commonly used by public sector organisations that manage a lot of different projects, citizen interactions, applications, outreach programs or operational workflows across multiple teams and regions.
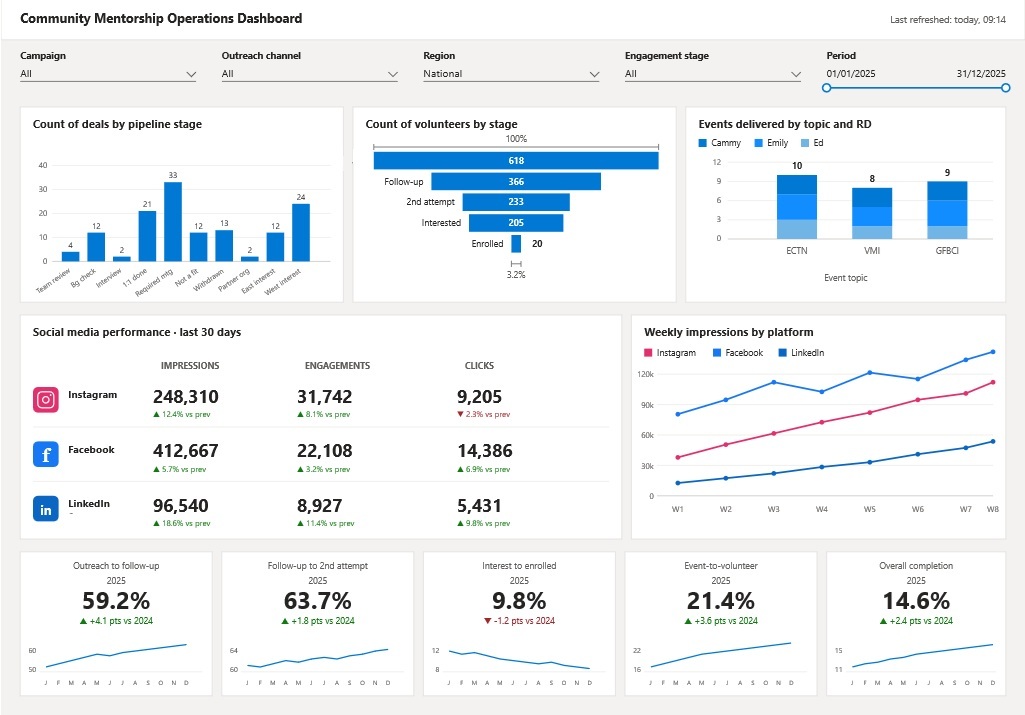
For instance, our BI consultants built a custom operational dashboard that gave a large US-based public initiative focused on community mentorship and rehabilitation some really useful insights into how well they were moving people through different stages of engagement. They had to work with HubSpot data to get a handle on the full engagement funnel of volunteers and participants across multiple outreach campaigns and mentorship stages. The analysis covered a lot – from mentor pipeline tracking and volunteer onboarding stages to event participation metrics and conversion rates between each stage of the process. And then there was all the social media analytics from Instagram, Facebook and LinkedIn to round things out (public awareness, engagement trends and campaign reach etc.) so they could see what was going on across each different audience. The dashboard also included filters by campaign, outreach channel, region and engagement stage – which meant leadership teams could dive right in and see operational performance in real-time.
This operational BI solution gave the initiative a much clearer picture of how well they were moving people through the process and where participants were dropping out. Teams could not only see which outreach campaigns were generating the most engagement but also where the mentorship stages were causing delays, and which communication channels were delivering the strongest awareness results. What’s more the automated reporting process also meant they didn’t have to do as much manual export from HubSpot and spreadsheet analysis – and that meant leadership could keep a much closer eye on programme performance and make decisions a lot faster.
Financial business intelligence is becoming really important for local governments to keep track of large-scale housing and financial transformation programmes. Councils and housing departments are relying more and more on operational dashboards to track accommodation supply, financial pressures, contractor performance and savings initiatives that directly impact budget sustainability and public service delivery.

For example, our BI consultants worked with a UK local authority to come up with a Power BI reporting framework to help them improve the financial sustainability of their temporary accommodation programme. The financial dashboard brought together all the housing operations data, financial models and programme management metrics into one single reporting environment. The analysis covered temporary accommodation supply levels, void turnaround times, spot purchase costs, acquisitions, block bookings, subsidy loss and savings achieved against targets (so they could really see where they stood). We also created some really useful visuals like savings trajectory charts, waterfall charts comparing planned versus actual savings and forecasting models that linked operational activities (like reducing voids or increasing housing supply) to measurable financial outcomes. The reporting structure was designed to be useful for both the operational teams and Cabinet-level stakeholders, with automated exports and live data refresh capabilities built right in.
The dashboard gave the housing and finance teams a much clearer picture of what was going on across multiple housing workstreams and helped decision-makers see how individual operational changes affected long-term financial sustainability. They could monitor risks, compare projections to actual outcomes and identify delays in contractor mobilisation or housing supply increases before they had a major impact on budgets. The automated reporting environment also meant they didn’t have to rely on fragmented spreadsheets and static reports – and that meant faster governance reviews, clearer stakeholder communication and more efficient programme oversight.
Business intelligence dashboards are really widely used by government agencies to monitor project spending, control budgets and improve financial oversight across departments and public initiatives. This type of operational reporting is especially important for councils, infrastructure programmes, housing initiatives, and grant-funded projects where costs have to be tracked closely against approved budgets and funding allocations.
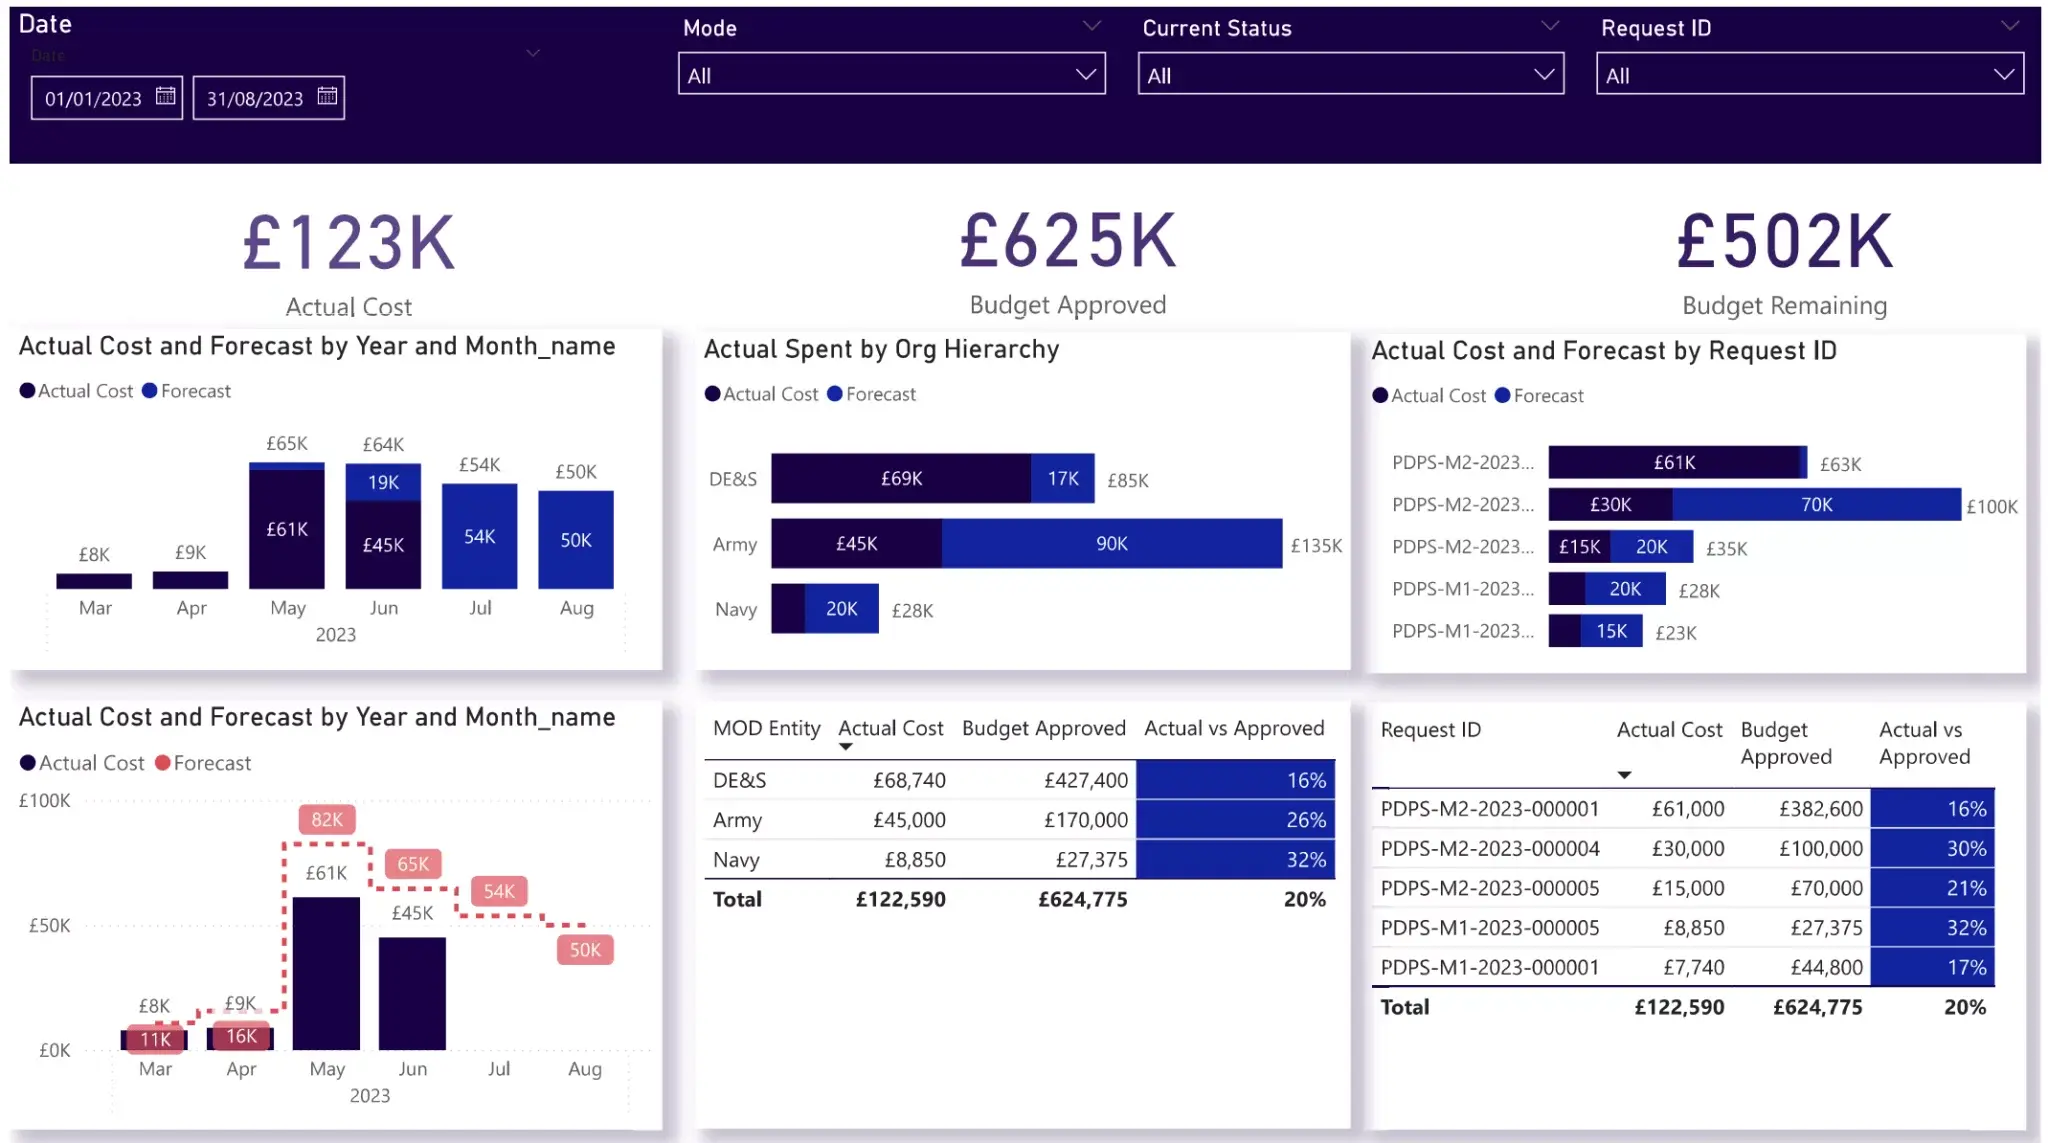
For instance, our BI consultants developed a Power BI budget control dashboard that enabled project managers and finance teams to monitor project costs in real-time (no more waiting for the monthly reports to get an update on where the budget was going). The project management dashboard analysed actual project spending, approved budgets, forecasted costs and remaining budget availability across multiple projects and initiatives – so they could see exactly where the budget was going. The financial data was broken down by department, resource type, workstream and operational initiative to show them where the budget was being consumed. The dashboard also visualised monthly actual versus forecasted costs – which helped teams identify overspending risks early on and improve financial planning. In many cases this reporting was integrated with project management and finance systems to combine budgeting, forecasting, invoicing and profitability analysis all in one reporting environment.
This type of BI solution really helps government organisations get a handle on financial governance and maintain stronger control over public spending. Project managers can quickly identify cost overruns, monitor spending trends and assess whether projects are still financially sustainable before issues start to escalate. Automated dashboards replace fragmented spreadsheet tracking with live reporting – which means finance teams, operational managers and senior stakeholders get a much clearer picture of the budget while at the same time supporting more accurate forecasting and faster decision-making.
Business intelligence is playing an increasingly important role in education departments and public school systems. School districts use BI dashboards to monitor strategic objectives, measure student outcomes, identify underserved groups and check whether long-term education initiatives are delivering measurable results across different schools and communities.
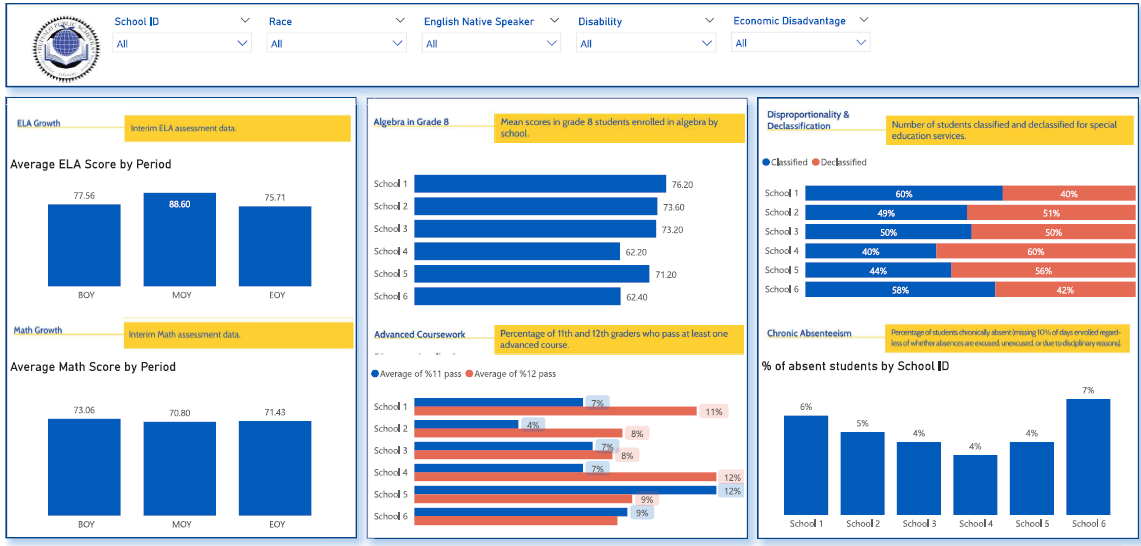
For example, Our BI consultants put together a Power BI strategy dashboard for a big public school district in the US to see how they were doing against their five-year strategic plan. The dashboard was connected straight to the district’s ERP system and automatically refreshed every day so they could keep an eye on how things were going – the operational and academic performance in real time. The analysis was focusing on key strategic objectives like getting the gap in academic performance between ethnic minorities and other students down, getting more kids involved in after school activities, getting parents more engaged, and getting more kids into the schools they wanted to go to. It was also looking at literacy and maths performance, the number of kids skipping school, the performance of special education kids, the percentage of kids getting into gifted and IB programs, suspension rates, and all the diversity stuff for new hires.
This education BI solution gave school administrators and district leadership a much clearer idea of how their strategic initiatives were going over time. By comparing what was happening at the start of the year, the middle of the year, and the end of the year, the leadership teams could see if all their interventions were actually helping student outcomes and quickly spot any schools or groups of kids that were falling behind. The dashboard also did away with manual reporting, putting in automatic daily reporting which gave them much better visibility and let them make faster, evidence based decisions about how to spend budgets, student support programs, staffing strategy and community engagement initiatives.
Microsoft Power BI is just one of the most widely used business intelligence tools in the public sector. A lot of government agencies already work within the Microsoft ecosystem, so using Power BI is a no-brainer because it is already integrated with Microsoft 365 and fits right into their existing IT set up.
Another big advantage is that the total cost of Power BI licensing is really low. Analysts can use Power BI Desktop to connect to all sorts of data sources – Excel spreadsheets, CSV files, SQL Server, cloud platforms, APIs, and ERP systems – to build dashboards and automated reports without having to shell out a lot of cash for new infrastructure. They can then publish those reports through Power BI Service for controlled sharing within the organisation.
Power BI is also super popular with governments because of its strong security and compliance features. Agencies can apply row-level security, permission controls, data anonymisation, and Microsoft Entra ID authentication to keep sensitive information safe while still enabling secure collaboration and public reporting.
Lots of agencies also embed Power BI dashboards into public websites and open data portals. During the COVID-19 pandemic, for example, health departments used Power BI to show infection rates, hospital capacity, and vaccination rates for both internal decision-makers and the public.
A lot of government BI projects start with a pilot dashboard that’s focused on a single operational problem or reporting requirement. Over time, those projects usually expand into broader analytics programmes that bring together multiple departments, data sources, and reporting processes into a single business intelligence environment.
For hourly or daily rate engagements, agile project management is usually the best approach. BI consultants and internal stakeholders work through short sprints with dashboard improvements delivered every few weeks. This way, government teams can test out early versions of dashboards, refine key performance indicators, adjust visualisations, and keep on improving reporting based on operational feedback – rather than waiting months for a final product.
Fixed-price government BI projects are usually bigger and more structured. These projects often start with planning a Business Intelligence strategy and a mock-up phase where dashboards, KPIs, user roles, and data sources are all defined before development starts. We’ve also found that using AI tools like ChatGPT and Claude to generate dashboard mockups can be a huge help – it cuts down on the amount of manual design work needed.
Once requirements are approved, the next stage is getting data in order and building a reporting model. This involves automatically pulling data from all sorts of sources – ERP systems, finance platforms, CRMs, spreadsheets, APIs, and operational databases – into a central reporting environment. After the data is cleaned and structured, analysts build the formulas and logic needed to calculate KPIs and performance metrics accurately.
The final stages are all about designing data visualisations, deploying reports, and getting stakeholders on board. Dashboards are built for different groups of stakeholders, securely published through platforms like Power BI Service, and integrated into operational workflows. User training is also super important to make sure departments understand how to interpret the reports, drill down into the data, and use BI insights in day-to-day decision-making.
Government agencies need to be able to show that their business intelligence initiatives are delivering value for taxpayers. Clear evidence of operational improvement is a great way to build support from agency leadership, legislators, funding bodies, and the public – and also justify future investments into data infrastructure and analytics capabilities.
One of the clearest ways to measure BI success is through operational metrics. A lot of agencies cut report production times down from weeks to hours by automating data collection and dashboard refreshes. BI platforms also help improve service delivery by speeding up things like permit approvals, benefit processing, emergency response times, and helping departments allocate staff and budgets more efficiently.
A great example of this is a local government that used to struggle with monthly spreadsheet reports to track housing and infrastructure projects. Before they implemented Business Intelligence, their operational reviews were often held up because teams were stuck consolidating reports from multiple departments for days on end. Two years after they started using automated Power BI dashboards, leadership were able to keep an eye on KPIs every day, spot potential budget blowouts sooner and respond to operational risks a whole lot faster. On top of that, they’d significantly reduced the effort needed for manual reporting and got a much clearer view of project delivery across departments.
You should also be looking at the softer benefits of business intelligence when deciding if your implementation has been a success. Having access to good data in the first place can really help policy discussions because it gives decision-makers a single, reliable source of truth that they can rely on during planning meetings and council reviews. It’s not uncommon for agencies to see a boost in citizen satisfaction, fewer complaints from the public and better communication with the people who are supposed to be overseeing things through more transparent and accessible reporting.
And don’t forget to keep an eye on how your BI platform is being used over time. Some of the things you can track include how many of your team are actually using the dashboards, how often they’re looking at reports, how much collaboration is going on between different departments, training completion rates and how many departments are using the shared data models you set up. High adoption rates are often one of the best signs that BI is actually delivering real value for the organisation in the long run.
Business Intelligence is fast becoming a core part of the toolkit for modern government agencies. From reporting and financial oversight to public transparency and strategic planning, BI platforms help public sector organisations make better decisions faster while also boosting accountability and service delivery.
As governments deal with growing piles of data across departments and systems, tools like Power BI are giving them a way to centralise reporting, automate analysis and communicate the insights to both internal stakeholders and the public.
At Vidi Corp, we’ve helped put Power BI dashboards, reporting automation and business intelligence solutions in place for government agencies, public initiatives and big organisations in the UK and the US. If you’re getting ready to kick off a new BI project or give your reporting processes a modernisation, get in touch and we can talk about how we can help with your Power BI implementation.


