
Higher education institutions generate vast amounts of data, but turning that data into meaningful insight remains a challenge. Business Intelligence helps colleges and universities bring academic, operational, and engagement data together to support better decisions and measurable outcomes.
As a higher education business intelligence consulting, we have worked with universities like Stanford and Imperial College London to design BI solutions that move beyond static reports. Our experience spans academic performance tracking, attendance monitoring, marketing analytics, financial reporting, and inclusion-focused dashboards, all built to support real decision-making.
In this article, we explain what Business Intelligence means in a higher education context, why it matters, and how it is applied in practice. We also share real-world BI use cases, key benefits for institutions, and common challenges to consider when implementing BI at scale.
Business Intelligence (BI) in higher education refers to the use of data, reporting, and analytics tools to support better decision-making across colleges and universities. It brings data together from systems like student information, learning platforms, finance, and admissions to create a clear, shared view of performance.
Instead of working with disconnected reports, BI helps institutions understand what is happening across academics, operations, and finance in one place. Leaders can track trends, spot issues early, and make informed decisions based on reliable data rather than assumptions.
In practice, BI in higher education is commonly focused on four core areas. Strategy analytics tracks progress against institutional goals, attendance analytics monitors student engagement, marketing analytics measures recruitment and application performance, and financial analytics provides visibility into revenue, costs, and funding efficiency. Together, these insights help institutions improve outcomes, allocate resources more effectively, and plan with confidence.
Business Intelligence plays a critical role in helping higher education institutions make better decisions. It gives leaders and administrators a shared understanding of performance across academics, operations, and finance.
One of the biggest benefits of BI is its impact on student success. By analysing data on attendance, engagement, and performance, institutions can identify trends early, spot at-risk students, and provide targeted support before problems escalate.
BI is also essential for strategic planning and resource allocation. Universities can evaluate the effectiveness of programs, optimise budgets, and ensure resources are invested where they deliver the most value.
Finally, BI enables evidence-based decision-making across the institution. With reliable data to guide policy changes and long-term planning, higher education organisations can adapt to changing demands while improving operational efficiency and educational outcomes.
Business intelligence supports work right across an institution, not just one team. These are the areas where universities and colleges use it most.
The examples below show how our data visualization consultants applied business intelligence in practice across key areas such as academic performance, attendance, marketing, finance, DEI, and student engagement. If any of those look relevant, you can ask our consultants to build a similar dashboard for your organization!
Student success analytics looks at how students are doing by bringing assessment results together with attendance and support data. In some cases students also draw on outside help such as math tutors online to build confidence in a subject, alongside the support their institution provides.
The same approach works in higher education. Universities and colleges watch the same core signals, grades, attendance, and use of support services, and read them together to find students who are drifting toward withdrawal. Framed as retention or early-alert reporting, it lets an advisor reach a struggling student in week four rather than finding out at the end-of-term results. The side-by-side comparison in the case study below, across schools and student groups, is the same comparison a university runs across faculties, courses, and cohorts.
In the case study below, we worked with a public school district to analyze academic performance across schools, particularly in literacy and math. While performance data, absenteeism records, and special education information were available, analysing these datasets together to identify patterns and risks was difficult and time-consuming.
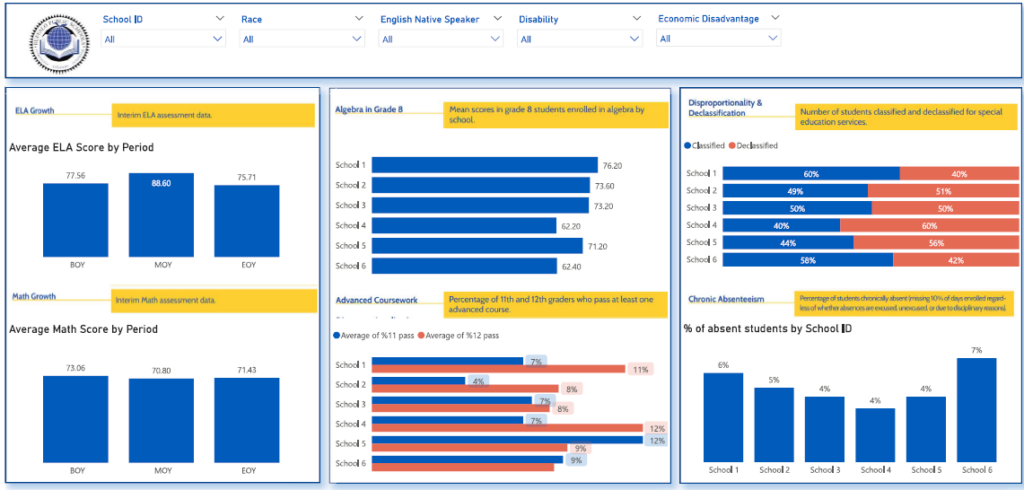
We designed an academic performance dashboard to measure student results in literacy and math assessments by school. Additional tabs analysed absenteeism trends and special education needs, enabling side-by-side comparison across schools and student groups.
The dashboard allowed leaders to identify performance gaps, schools with elevated absenteeism, and areas where additional special education support was required. By viewing academic results alongside attendance and support needs, the institution gained a more complete picture of student outcomes, enabling earlier intervention, better resource planning, and more effective support strategies across the district. At the same time, students managing heavy workloads sometimes look for ways to write my paper for me when trying to keep up with academic expectations.
Attendance Analytics helps institutions monitor student engagement by tracking presence and absence at lectures and sessions. In a real-world implementation, the university used QR codes via QR tools such as Uniqode’s QR Code Generator to record attendance, requiring students to scan a code before each lecture. While this approach captured detailed data, the institution needed a more reliable way to analyse attendance patterns and identify disengagement early.
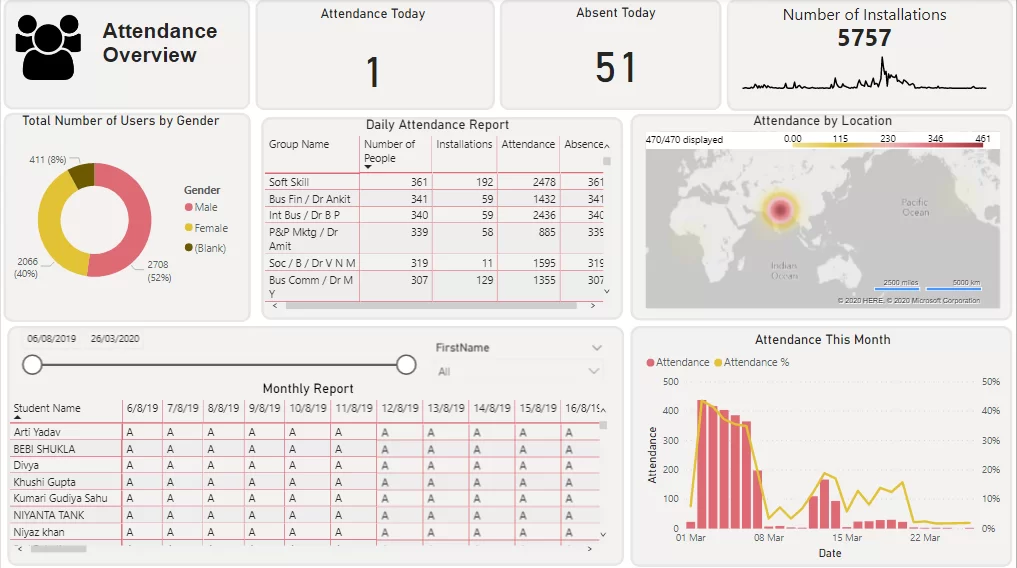
Our Power BI consultants analysed student attendance and absences on a daily basis. At a group level, the dashboard showed total students per group, how many had installed the attendance app, monthly attendance counts, and recorded absences.
At the student level, the report displayed daily attendance status using simple indicators for presence and absence, with the ability to filter by date range and student name. Users could also export attendance records to Excel for further analysis or reporting.
The dashboard enabled staff to monitor attendance in near real time and quickly identify groups or individual students at risk of disengagement. By automating attendance reporting and combining group-level and student-level insights, the university improved oversight, supported earlier interventions, and reduced manual reporting effort.
Marketing Analytics helps higher education institutions understand how prospective students and families discover and engage with their digital channels. In this engagement, we worked with a community college that needed clearer visibility into the performance of its marketing efforts and the effectiveness of its website in attracting local audiences.
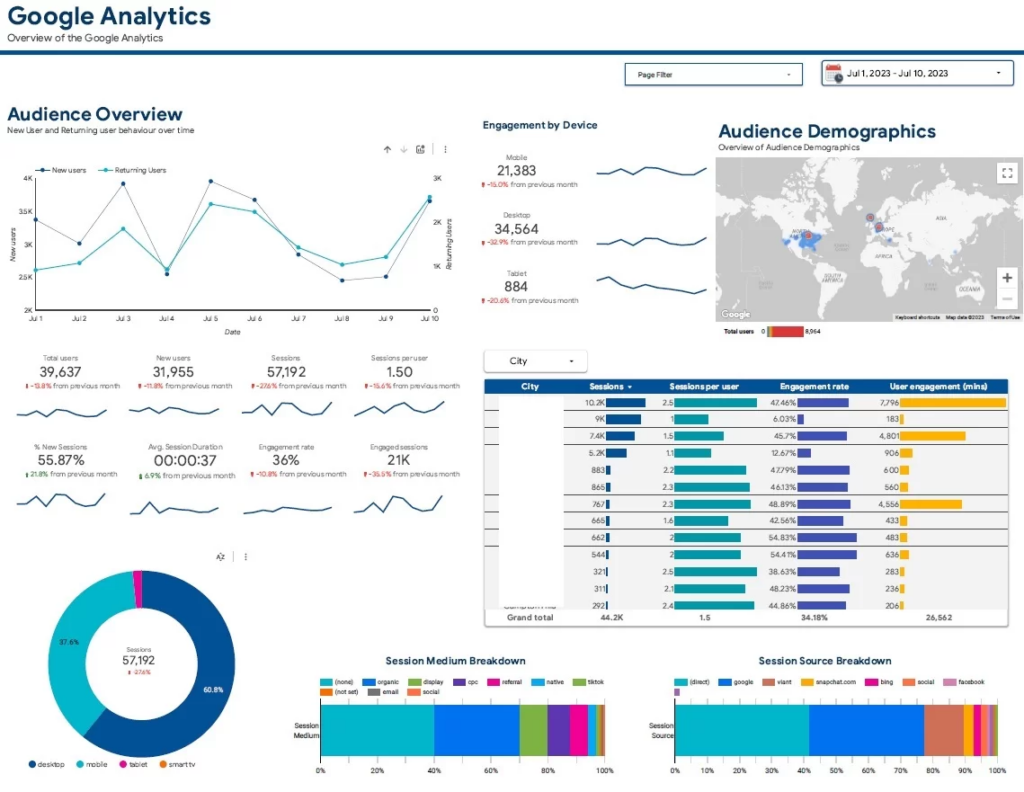
Our Google Tag Manager consultants set up tracking of online events in Google Analytics 4 (GA4) and visualised the data in Looker Studio.
The first page of the dashboard measured total website users and analysed where they came from. Since the college primarily targeted local families, we visualised website visitors by city to identify how many relevant visitors the marketing team managed to drive to the website. Session source and medium analysis highlighted the most effective channels driving traffic to the website.
The dashboard gave the marketing director a clear view of which locations and channels delivered the highest engagement. These insights helped refine targeting, optimise marketing spend, and focus efforts on the sources that most effectively reached prospective students and their families.
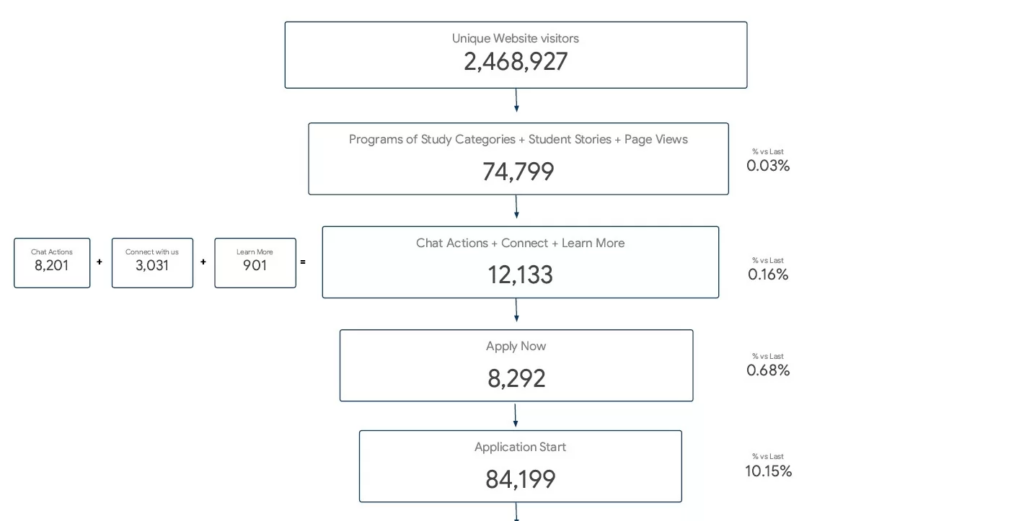
Our marketing analytics consultants also analysed the college’s marketing funnel to assess how effectively website visitors convert into applications. The top of the funnel focused on traffic to key student experience and course pages, while the middle of the funnel highlighted micro-conversions such as enquiries and “learn more” interactions.
At the bottom of the funnel, the analysis tracked application starts and completions, helping the college identify drop-off points and opportunities to improve conversion performance across the journey.
Financial Analytics helps higher education institutions understand the financial performance of their programs, campuses, and student population. We recently worked with the CFO of a university in Norway who needed a clearer view of financial outcomes across the institution.
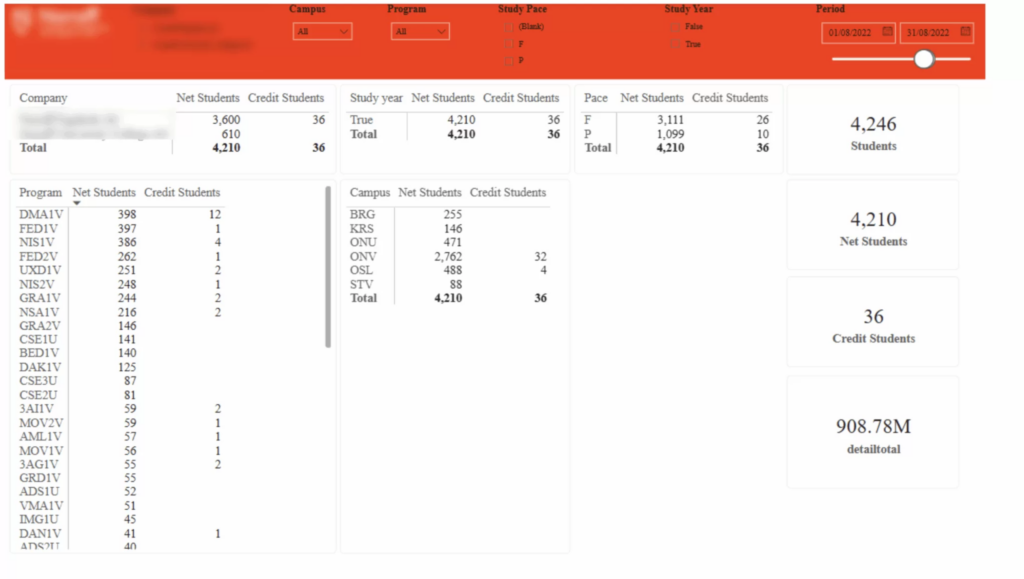
Our Power BI developers built a dashboard using data from Salesforce CRM and a SQL database that stored financial records. The dashboard analysed the total number of enrolled students, broken down by program and campus, providing visibility into how revenue and enrolment were distributed across the university. We also analysed students who had been issued credit notes, highlighting cases that required special financial management.
The dashboard enabled finance leadership to quickly identify trends in enrollment, monitor financial exceptions, and better understand the financial impact of different programs and campuses. These insights supported stronger financial planning, improved oversight of special cases, and more confident, data-driven decision-making at the executive level.
Behavior and workforce diversity analytics helps institutions track disciplinary trends and check how closely their hiring reflects the makeup of their student body. In this example, the institution wanted the diversity of its staff to match the diversity of its students.
In higher education the same two questions apply. On conduct, universities look at whether disciplinary cases fall unevenly across student groups, which is part of how they meet access and inclusion commitments. On hiring, they compare the makeup of new staff against their student population and their own equity targets. Reading both in one place shows leadership where student experience and staffing are out of step, which is harder to see when conduct data sits with student services and hiring data sits with HR.
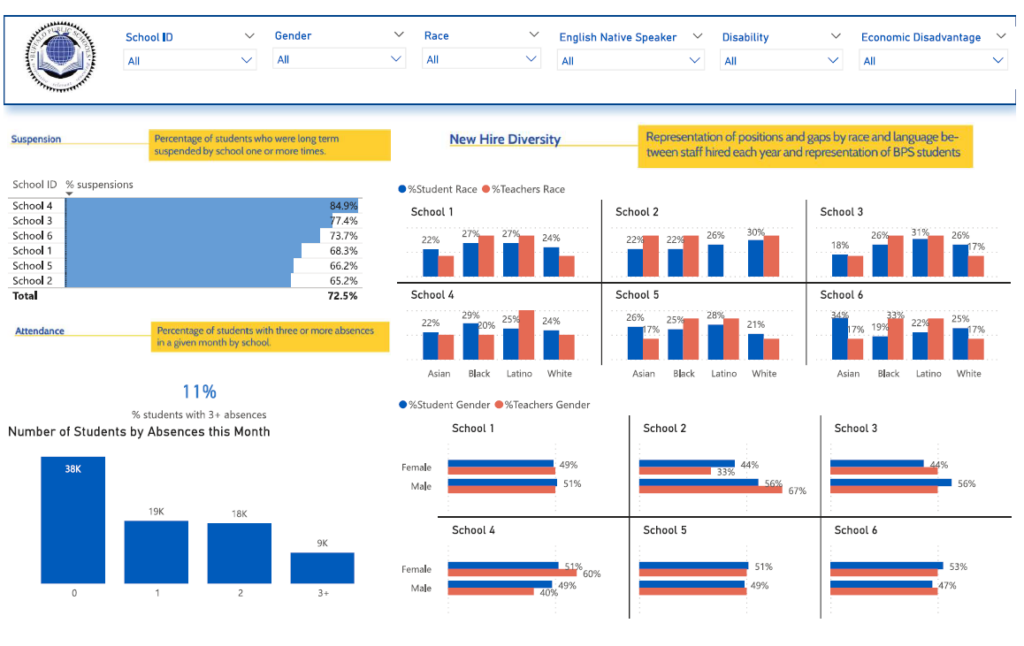
We developed a dashboard that analysed suspension rates across different student groups, highlighting where suspension percentages were highest. The final tab of the report also measured new hire diversity, comparing recruitment outcomes against the school’s overall demographic distribution.
The dashboard enabled leadership to identify student groups most affected by suspensions and design targeted interventions to reduce disciplinary actions. At the same time, HR teams gained clear visibility into how well hiring practices aligned with diversity goals. Together, these insights supported fairer disciplinary policies, more inclusive hiring decisions, and stronger alignment between student and staff demographics.
Student retention analytics helps institutions understand why students leave by tracking exit surveys and the reasons students give for going. In this example, the institution wanted to see completion rates for its exit surveys, the reasons behind each departure, and how satisfied families were with the school places they were offered.
In higher education the same questions sit at the center of retention work. Universities run exit and withdrawal surveys for the same reason, to find out why students drop out or fail to re-enroll, and reading those reasons by faculty, course, or campus shows leadership where attrition is concentrated and what is driving it. Swap schools for departments and school-choice satisfaction for course or offer satisfaction, and it is the same view a university uses to spot at-risk cohorts early enough to act.
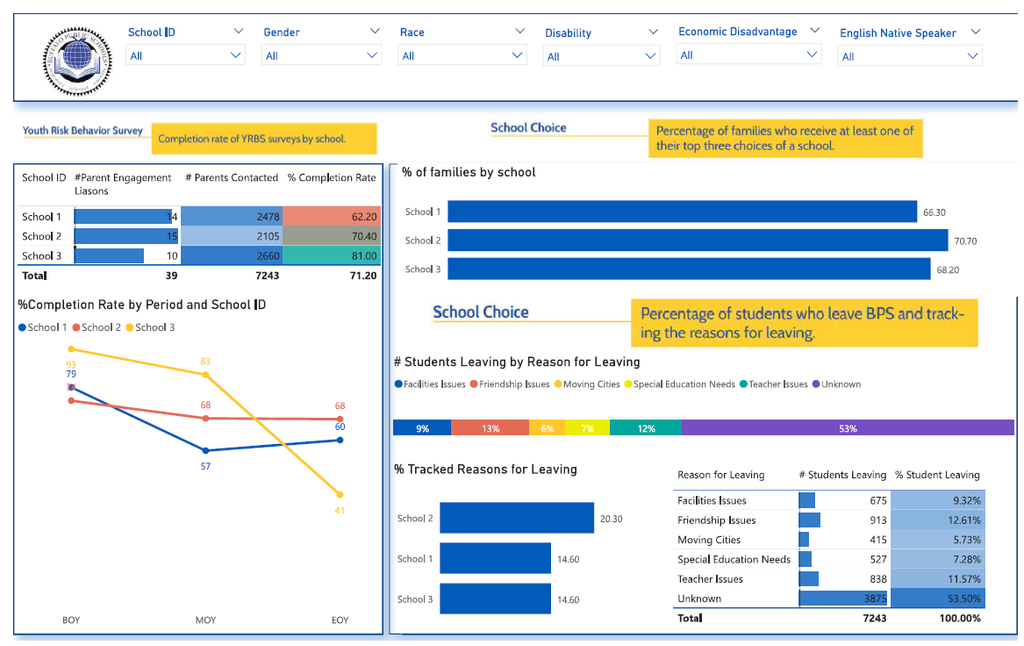
Our data analytics consultants built a BI dashboard that measured exit survey completion rates across the schools and broke down the reasons students left, from facilities and teaching to moving away. It also showed the share of families who received at least one of their top three school choices, set out by school so leaders could compare across the district.
The dashboard gave leadership a single view of where students were disengaging and why, rather than piecing it together from separate reports. Seeing response rates, exit reasons, and choice satisfaction side by side made it easier to see which schools were losing students, and for what reasons, in time to respond. A university would read the same page to flag rising withdrawal in a faculty or cohort before it showed up in the enrollment numbers.
Business Intelligence helps higher education institutions make better use of their data across academics, operations, and planning. Below are the key benefits of using Business Intelligence in higher education institutions.
Data-Driven Decision Making
BI enables leaders to base decisions on up-to-date data rather than assumptions. Dashboards provide real-time visibility into key areas such as enrollment, attendance, academic performance, and finances, supporting more confident and timely decisions at every level.
Improved Student Outcomes
With access to detailed performance and engagement data, institutions can identify students at risk earlier and intervene proactively. By analysing trends in attendance, assessments, and behaviour, BI supports targeted academic support, improved retention, and better overall student success.
More Efficient Resource Allocation
BI helps institutions understand where resources deliver the most value. By analysing program performance, staffing levels, and operational costs, universities can allocate budgets more effectively and avoid underutilisation or unnecessary spend.
Increased Operational Efficiency
Automated data collection and reporting reduce manual effort across departments. Instead of relying on spreadsheets, staff can access consistent dashboards, saving time and reducing the risk of errors.
Customised and Shareable Reporting
BI tools allow institutions to build dashboards tailored to their specific needs, whether for academic teams, finance, marketing, or leadership. Reports can be securely shared across departments, ensuring everyone works from the same version of the data and improving collaboration.
Better Planning and Forecasting
By analysing historical trends, BI supports forward-looking planning. Institutions can forecast enrollment, anticipate demand for courses, and identify potential retention risks, enabling proactive planning.
While Business Intelligence delivers significant value, implementing it in higher education comes with a set of challenges that institutions need to plan for. Below are the most common considerations when adopting BI across academic and operational environments.
Data Quality and Integration
Higher education data often sits across multiple systems, such as student information systems, learning platforms, finance tools, and CRM solutions. Inconsistent data definitions, missing records, and poor data quality can limit the reliability of BI insights if not addressed early.
Privacy and Data Security
Institutions handle sensitive student and staff data, making privacy and security a critical concern. BI implementations must comply with data protection regulations and ensure that access to reports is tightly controlled based on user roles.
Adoption
Even well-designed dashboards can fail if users are not aligned or trained. Staff may be accustomed to spreadsheets or manual reports, so adoption requires clear communication, stakeholder involvement, and ongoing support.
Scalability
BI platforms depend on reliable data pipelines and underlying infrastructure. Institutions must ensure their systems can support automated refreshes, growing data volumes, and future reporting needs without performance issues.
There is no single best tool for higher education BI. It comes down to what an institution already runs and how much its teams want to build for themselves. And it is rarely one product doing everything, more a set of BI tools layered together, each handling a job the others cannot:
Whichever platform ends up on top, it comes back to what sits beneath it. A dashboard is only ever as good as the data feeding it, so most of the real work happens down in the warehouse and integration layers, getting the sources talking and the numbers agreeing before anyone builds a single chart. And student data comes with obligations, FERPA among them in the US, so wherever that data is kept or moved, access has to be controlled by role from the very start.
One thing that puts institutions off BI is the feeling that it means months of planning before anything useful shows up. It does not have to work that way. The projects that go well deliver something usable early and grow from there, so value turns up in weeks rather than quarters.
Weeks one to three: quick wins. Start with a source you already have and get something live. A common opener is checking the Google Analytics tracking on your site and building a first dashboard from that data, since it needs no new systems and gives staff a working report to react to straight away. Early dashboards like this tend to surface the data problems worth fixing before they turn expensive.
Month one to two: the data foundation. Once a quick win has shown what BI can do, the next step is a data warehouse that brings the main sources together, the CRM, the student records system, attendance, and finance, so everything built later draws from one reliable base rather than a set of separate exports.
From there: one dashboard at a time. With the foundation in place, dashboard development moves quickly, roughly a week per report: agree what it needs to answer, settle the KPIs, connect the data, and build it. Enrollment one week, retention the next, finance after that. The goals and metrics get set for each dashboard, where they actually mean something, rather than in one long exercise at the very start.
Working this way keeps the project moving and lets leadership see results at every stage, which makes the case for the next phase far easier than a plan that asks for everything before it shows anything.
Not every BI consultancy has real experience in higher education, and the gap tends to show up fast once a project is underway. A few things are worth checking before you commit.
Sector experience is the first. A partner that has worked with universities already knows how student records systems are set up, how enrollment and term cycles run, and the kind of reporting boards, funders, and accreditors expect. That saves you explaining how an institution works before anyone gets started.
It also helps to notice whether a partner leads with data or with dashboards. The hard part of almost any project is data integration, pulling the source systems together and cleaning up what comes out of them, so be wary of anyone keen to jump straight to building charts. Ask how they handle messy or scattered data, because that is usually where projects stall.
Platform fit matters too. You want a partner comfortable in the tools you already run or plan to run, whether that is Power BI, Tableau, or Looker Studio, rather than one steering you toward whatever they prefer to work in.
Student data also comes with obligations, FERPA among them in the US, so a partner should be able to explain early how they manage access and handle sensitive records. And because dashboards need maintaining as data sources change and new questions come up, someone who stays on to support the work will serve you better than one that builds it and moves on.
Business Intelligence is no longer a nice-to-have in higher education. It has become a critical capability for institutions that want to improve student outcomes, operate more efficiently, and make decisions based on evidence rather than assumptions.
As the examples in this article show, BI can be applied across academic performance, attendance, marketing, finance, inclusion, and student engagement. When data is brought together into clear, accessible dashboards, leaders gain the visibility they need to act early, allocate resources effectively, and plan with confidence.
For institutions exploring Business Intelligence or looking to improve existing reporting, the next step is understanding which use cases matter most and how your data can support them. Contact us today to discuss how Business Intelligence can be tailored to your institution and start building reporting that supports better decisions!


