
Automated financial reporting allows businesses to generate accurate, real-time financial insights without manual spreadsheet work. Instead of exporting data, updating formulas, and reconciling multiple files every month, companies can rely on structured systems that refresh automatically and deliver consistent reports.
Choosing automated financial reporting software is really a choice between three routes. You can push your existing accounting system further, buy a specialist reporting product that sits on top of it, or build a custom BI layer that models your data the way your business actually works. Most comparison articles skip that decision and jump straight to a list of tools, which is why so many finance teams end up paying for software that duplicates something they already have.
This guide is written for CFOs, financial controllers and finance leads who are comparing options. It covers six tools that cover the realistic range of choices, explains which buyer situation each one fits, and sets out what each will cost you once integration and implementation are counted. If you have already chosen a direction and need the build process, our financial reporting automation implementation guide covers that end of the work.
Automated financial reporting software takes the manual work out of pulling numbers together for month-end reporting. Instead of someone copying figures out of your accounting system into Excel, checking formulas and formatting slides by hand, the software connects directly to your data sources and refreshes the reports on its own. On the Power Platform, that usually means Power BI dashboards pulling live from Dynamics 365, QuickBooks or your general ledger, with Power Automate handling the scheduling, approvals and distribution around them.
The point isn’t just speed, though that’s the part people notice first. It’s consistency. When a report builds itself from the same connected sources every time, you stop worrying about a broken formula or an outdated tab making it into the version your CFO sees. You get the same definitions and the same structure every month, whether it’s a board pack, a departmental P&L or a cash flow summary, and your finance team spends its time interpreting the numbers instead of assembling them.
If you are a small business with relatively simple reporting needs, the native reports inside cloud accounting platforms may be sufficient. These tools can automatically generate P&L, Balance Sheet, and Cash Flow statements without additional systems.
However, as soon as reporting becomes more complex, businesses typically need a combination of systems. Cloud Accounting Software or an ERP handles transactions and financial data storage, while a dedicated reporting tool transforms that data into structured dashboards, forecasts, and executive-level insights.
In the next sections, we’ll break down these categories and review the specific tools used in each.
| Tool | Best-fit situation | Existing-system fit | Principal reporting outputs | Key limitation or setup dependency | Cost basis |
| QuickBooks Online | Single-entity company that needs standard statements produced and circulated on a schedule | It is the accounting system, so nothing to integrate | P&L, balance sheet, cash flow, AR and AP aging as tables; scheduled PDF or Excel by email | Limited custom KPIs and no real multi-entity consolidation; class and location tracking only on higher plans | Published per-company subscription tiers; US list prices changed during 2026 |
| Xero | Single-entity company wanting more control over report layout than QuickBooks offers | It is the accounting system | Core statements, custom report layouts, a light built-in dashboard, Analytics Plus on higher tiers | Each organization is a separate subscription, so groups pay per entity and consolidate elsewhere | Published tiers, named differently by region; UK prices rose on 1 September 2026 |
| Oracle NetSuite | Multi-subsidiary business that needs finance, inventory and operations in one system | Replaces the accounting system, so this is a system project, not a reporting project | Saved searches, SuiteAnalytics workbooks, role-based dashboards, consolidated statements | Getting data out to Power BI or Tableau needs SuiteAnalytics Connect or a SuiteQL-based connector | Quote only: base platform, users, modules, then implementation |
| Sage Intacct | Mid-market finance team with several legal entities and project or fund accounting | Replaces the accounting system, finance first rather than operations first | Dimensional financial reports, role-based dashboards, continuous consolidation | Operational and non-finance data still has to be integrated from elsewhere | Quote only: core financials, named users, modules, entities |
| Fathom | Repeatable monthly management pack or advisor reporting on top of an existing ledger | Sits on top of QuickBooks, Xero, MYOB, Sage Accounting or a spreadsheet | Branded PDF management packs, KPI dashboards, three-way forecasts, consolidated groups | Built around accounting data; blending in CRM, operations or marketing data is not what it does | Published tiers based on the number of company files you connect |
| Power BI | Custom model combining finance with operations, CRM or several source systems | Sits on top of anything, given a connector | Interactive dashboards, paginated statement-style reports, scheduled delivery to email or Teams | Nothing is prebuilt; someone has to build the model and own it afterwards | $14 per user per month Pro, $24 Premium Per User, capacity from around $263 per month, plus build cost |
Cloud accounting software includes tools like QuickBooks Online, Xero, and FreshBooks. These platforms are primarily designed for bookkeeping and transaction management. While they play a critical role in financial processes, they should not be considered fully automated financial reporting tools.
Their main strength lies in data aggregation. Cloud accounting platforms typically integrate with banks such as Wise or Payoneer and sales channels like Stripe or Shopify. These integrations automatically pull transactions into the system and structure them within the general ledger. This creates a clean and reliable financial data foundation, which is essential for accurate reporting.
Most cloud accounting tools provide standard financial reports such as Profit & Loss, Balance Sheet, and Cash Flow statements. These reports are usually available in multiple views, including month-to-date, year-to-date, and year-over-year comparisons. For small businesses with straightforward reporting needs, this may be sufficient.
However, their custom reporting capabilities are limited. Complex analysis, advanced KPIs, consolidated reporting across entities, or detailed forecasting often require exporting data to Excel or connecting the accounting system to a dedicated reporting tool. As a result, cloud accounting software should be seen as the data backbone of financial reporting, not the complete reporting solution itself.
QuickBooks Online is one of the most widely used cloud accounting platforms for small and mid-sized businesses. It allows users to record transactions either manually or automatically through bank and payment integrations, and then categorize those transactions into the correct general ledger accounts. It also provides functionality to reconcile payments with invoices, helping ensure that revenue and cash records are accurate.
Once transactions are properly recorded and reconciled, users can leverage QuickBooks’ built-in reporting functionality The platform offers standard financial reports such as Profit & Loss, Balance Sheet, and Cash Flow statements. Reports can be generated for different time periods and scheduled to be automatically exported to PDF or Excel and sent via email to stakeholders or use a custom QuickBooks Power BI connector to visualize the tables with a Power BI template.
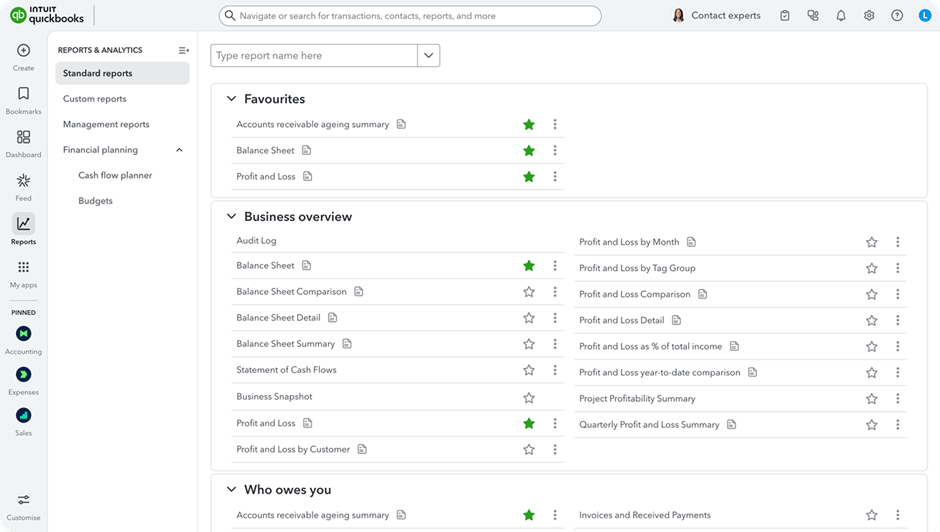
Most QuickBooks reports are presented in a structured table format. While they are not highly visual, they are interactive. Users can easily drill down from account categories into individual transactions, which makes it simple to investigate variances or unusual balances.
QuickBooks also offers limited customization options. Users can modify reporting periods, add or remove columns, and apply filters to adjust the level of detail. However, advanced KPI modelling, multi-entity consolidation, and executive-level dashboards typically require exporting data or integrating QuickBooks with a dedicated reporting tool.
Xero offers similar bookkeeping and reconciliation functionality to QuickBooks Online. Businesses can record transactions manually or automatically through bank feeds and payment integrations, then categorize them into general ledger accounts. In practice, many accountants find that day-to-day bookkeeping tasks can be completed faster in Xero due to its streamlined interface. Using a Xero Power BI connector to pull the tables and visualise the data in Power BI could make the process seamless.
One important distinction is that Xero reports only show reconciled transactions. If a transaction has not been reconciled, it will not appear in financial reports. This makes the reconciliation process critical, as incomplete reconciliations can lead to missing figures in your P&L or Balance Sheet.
Xero provides the same core financial reports as QuickBooks, including Profit & Loss, Balance Sheet, and Cash Flow statements. It also offers slightly stronger customization capabilities. Users can adjust layouts, create custom report formats, and modify grouping structures to better match internal reporting needs.
It also includes a built-in dashboard with simple data visualizations such as revenue, expenses, bank balances, and outstanding invoices. This dashboard can be customized to display selected metrics and charts. However, the visualizations are limited to basic summaries, and it is not possible to build complex formulas or advanced KPI models directly within the dashboard. For more sophisticated reporting, businesses typically connect Xero to a dedicated reporting or BI tool.
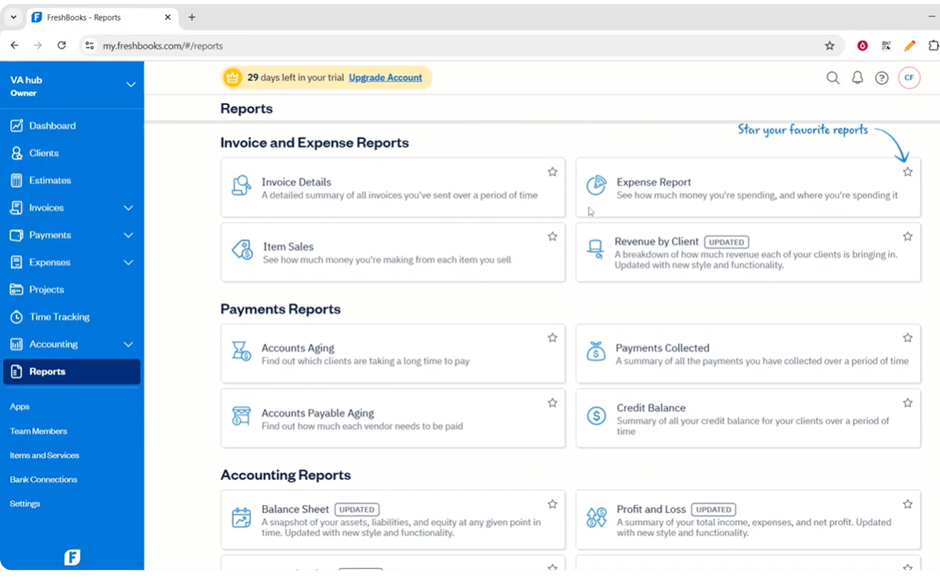
FreshBooks is less popular than QuickBooks Online or Xero and is primarily used by small businesses and freelancers. Its core focus is bookkeeping, invoicing, and expense tracking rather than advanced financial reporting.
The platform allows users to create invoices, record expenses, reconcile payments, and manage basic accounting processes. It offers a limited set of financial reports, such as Profit & Loss and tax summaries, but the reporting depth is more restricted compared to QuickBooks or Xero.
FreshBooks does not provide a customizable dashboard with visualizations like Xero. Reporting is mostly presented in a simple table format, with minimal flexibility for advanced analysis. For businesses that require more structured KPI tracking or executive-level reporting, FreshBooks would typically need to be connected to an external reporting tool.
Enterprise Resource Planning (ERP) systems include platforms such as Oracle NetSuite and Sage Intacct. Unlike cloud accounting tools, ERPs are designed to unify data across the entire organisation, not just finance.
An ERP consolidates information from finance, operations, inventory management, procurement, and supply chain into a single system. For example, in manufacturing projects we’ve worked on, the ERP did not only stored financial transactions but also tracked production volumes, warehouse movements, supplier performance, and order backlogs. This creates a much more connected data environment.
ERPs also support automation of core business processes. This can include automated inventory replenishment, purchase order creation, revenue recognition rules, approval workflows, and multi-entity consolidation. As a result, they improve operational efficiency as well as financial control.
However, ERPs are significantly more expensive than cloud accounting tools and typically require implementation support. They are often not affordable or necessary for early-stage startups.
While ERPs provide pre-configured financial and operational reports, their main purpose is to act as a central data backbone for the organization. For advanced financial analytics, KPI modelling, and executive dashboards, businesses often integrate their ERP with a dedicated reporting or business intelligence tool.
Oracle NetSuite is a full-scale ERP system that goes far beyond traditional accounting software. In addition to finance modules, it includes integrated CRM, inventory management, procurement, and HR functionality. It also supports multi-currency, multi-tax, and multi-subsidiary consolidation, making it suitable for international and multi-entity organizations.
NetSuite offers hundreds of pre-built reports covering finance, sales, inventory, and operations. It also provides strong customization capabilities. Unlike most cloud accounting tools, NetSuite allows users to build pivot tables, charts, and more advanced saved searches directly within the system. Its native reporting functionality supports joins between different data tables, enabling more complex cross-functional analysis.
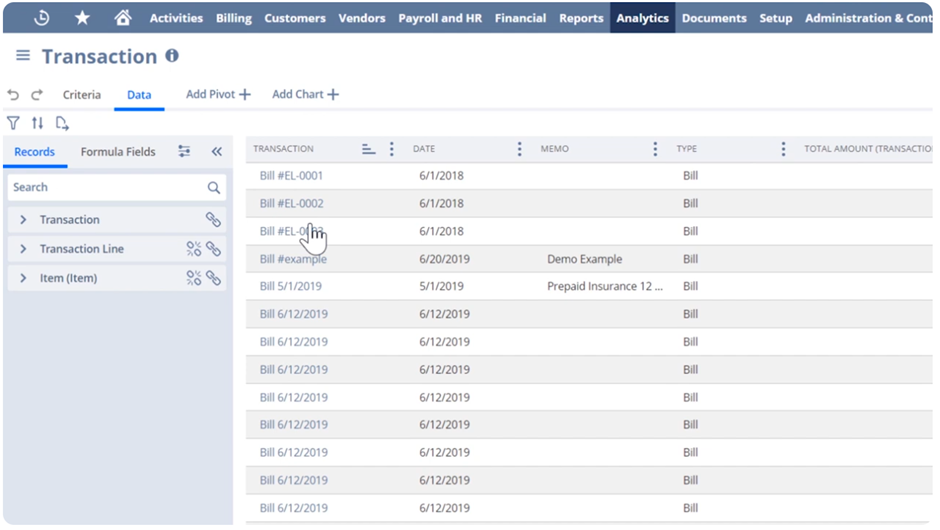
Users can also create custom dashboards tailored to different roles, such as CFO, Sales Director, or Operations Manager. These dashboards can include KPI scorecards, trend charts, and real-time operational metrics pulled directly from live system data.
For more advanced data extraction and external reporting, NetSuite offers the SuiteAnalytics Connect package, which costs approximately $500 per month as an add-on. This package provides an ODBC connector that allows businesses to automatically extract data from NetSuite into external reporting tools such as Power BI or Tableau. This makes it easier to build advanced financial models, executive dashboards, and consolidated reporting outside of the ERP environment.
Sage Intacct is primarily designed for small and mid-sized businesses that have outgrown tools like QuickBooks Online or Xero. It is particularly strong in project accounting and multi-entity consolidation, making it popular with professional services firms and growing multi-entity organizations.
At its core, Sage Intacct is a financial management system. However, it offers a wide range of add-ons and third-party integrations that can extend it toward full ERP functionality. Businesses can connect CRM, HR management, and inventory management applications. Despite these extensions, finance remains the central focus of the platform.
Sage Intacct provides pre-set dashboards tailored to different industries, such as SaaS and professional services. It also offers role-based dashboards for positions like Financial Controller and CFO. This allows leadership to access relevant KPIs immediately without building reports from scratch.
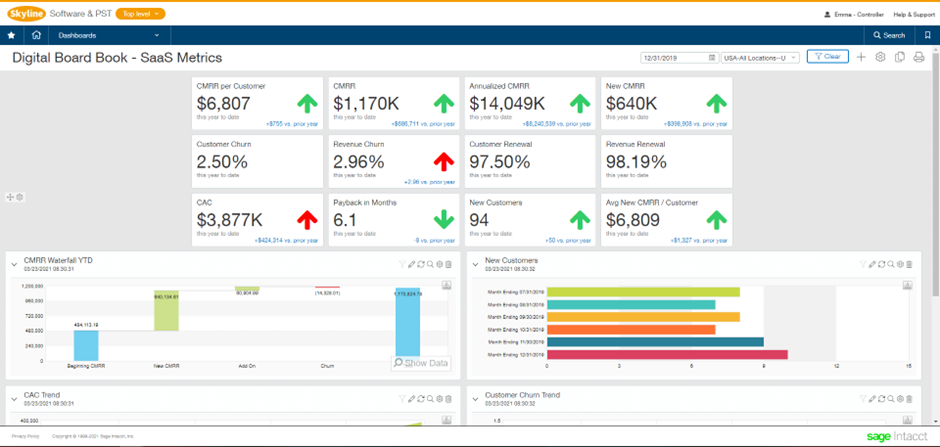
The native reporting functionality inside Sage Intacct is highly customizable. Users can build their own dashboards using drag-and-drop tools, apply conditional formatting, and design reports that match internal reporting structures. This makes it significantly more flexible than most cloud accounting platforms while still being more finance-focused than broader ERP systems like NetSuite.
Reporting tools such as Fathom Reporting and Power BI are designed specifically for analysis and visualization. Unlike cloud accounting platforms or ERPs, they are not built for bookkeeping, reconciliation, or transaction processing.
Their main purpose is to transform financial and operational data into structured dashboards, KPI reports, forecasts, and executive summaries. These tools sit on top of your accounting system or ERP and turn raw data into clear insights that support decision-making.
Fathom Reporting is a strong choice for businesses and accounting firms that need structured, out-of-the-box financial reports based on their accounting data. It is commonly used by accounting practices and outsourced CFOs to prepare and share performance reports with clients.
Fathom integrates directly with systems like QuickBooks, Xero, and MYOB, automatically pulling financial data into its reporting environment. Reports can be white-labelled, which makes the platform particularly suitable for external reporting. Accounting professionals can present branded, client-ready reports without exporting data into separate tools.
The platform also allows firms to manage multiple clients in one interface. Advisors can quickly scan performance across their entire portfolio and immediately spot unusual changes in revenue, margins, or cash flow.
Fathom includes a drag-and-drop interface for building dashboards and designing visual reports. Users can embed graphs directly into PDF reports, making it easy to produce structured management packs or investor updates.
However, Fathom has limitations. It is not designed for complex modelling or advanced formula creation. It also has limited capability to combine data from non-accounting sources. If you need to blend marketing, operations, CRM, and financial data into a single dashboard, Fathom is not the right tool. In those cases, a more flexible business intelligence platform is required.
Power BI is Microsoft’s business intelligence platform designed for advanced data modelling, automation, and visualization. It connects to 250+ data sources and starts at around $14 per user per month for the Pro license. Unlike accounting systems, Power BI is built specifically for reporting and analytics.
Power BI is best suited for fully custom, automated financial dashboards. It provides maximum flexibility for building financial statements, KPI dashboards, forecasts, and executive reports. Because it supports a wide range of data connectors, you can combine financial data with marketing, operations, CRM, HR, and supply chain data. This allows organizations to analyze the full financial impact of business initiatives rather than reviewing departments in isolation.
It is especially powerful for organizations already using Microsoft tools such as SharePoint, Dynamics 365, Azure, or Microsoft Fabric. Integration is seamless, which reduces setup time and makes it easy to embed financial dashboards into existing workflows, Teams channels, or internal portals.
Power BI also supports advanced features such as embedding visuals into PDF reports, though this requires technical setup. For complex implementations, working with experienced Power BI developers is recommended.
Another major advantage is AI capability. Using Microsoft Fabric, businesses can build AI data agents that allow stakeholders to ask questions in natural language and receive answers directly from live data. This reduces dependency on analysts and provides immediate insights to business users. Setting these up is quite a technical process, so we recommend you speak to Microsoft Fabric consultants about AI analytics.
There are also licensing advantages when Power BI is used alongside other Microsoft services. For example, certain Microsoft Office E5 licenses include Power BI functionality, reducing incremental cost.
At Vidi Corp, we offer free Power BI templates for QuickBooks Online and Xero that already contain the required formulas to ensure your numbers reconcile correctly.
Before you shortlist anything, work out which category you are actually shopping in. Six categories come up repeatedly in finance reporting projects, and each answers a different question.
The question here is whether the platform you already pay for can produce the statements and the scheduled outputs you need. For a single entity on a clean chart of accounts, the answer is often yes. The limits usually start to bite at one of three points: when you need a KPI the ledger does not hold, when you need to consolidate more than one set of books, or when the pack has to combine finance with something else.
If the requirement depends on inventory, projects, revenue recognition rules or several legal entities, you may be looking at a source system problem rather than a reporting problem. That is a much bigger decision. Replacing your accounting platform to fix a reporting gap is rarely the cheapest route, so be clear about which of the two you are solving.
Financial reporting sits on top of your ledger and produces a repeatable management pack, an advisor report or a standard performance analysis. If your requirement is a monthly pack that looks the same every month and draws on accounting data alone, this category is usually the fastest and cheapest way there.
Custom Business Intelligence and data integration are the right category when you need a model rather than a report. Bespoke KPIs, several non-accounting sources, budget and forecast comparisons held outside the ledger, or an integrated management reporting environment all point here. The trade-off is that you are buying capability, not a finished report.
Business Intelligence Consulting services sit a step earlier in that process, covering the diagnostic and design work before a model gets built: mapping data sources, defining what the KPIs should actually measure, and deciding how the pieces fit together
Sometimes the numbers are already right, and the pain is everything after that: assembling the document, getting it approved, and getting it to the right people on the right day. If that describes your month-end, look closely at scheduling, review and distribution features rather than at modeling power, because you may need a workflow component on top of whichever reporting tool you choose.
These categories are an editorial framework for thinking, not a compliance guarantee. A product sitting in the consolidation category does not automatically satisfy your auditor, and a BI tool does not automatically satisfy your group reporting requirement.
If you would like a second opinion on a shortlist, send us five things: your accounting or ERP system, how many entities you report on, the outputs you have to produce, who receives them, and the one limitation that pushed you into looking. That is usually enough for us to tell you whether you need a product, a connector or a project, including when the honest answer is that your current system can already do it.
Where a custom build is the right answer, that is the work we do. Our clients include Dermalogica and Tikkurila, and the CFO of Neterra Telecom used the reporting transformation we delivered as the centrepiece of an award-winning finance function project.
It’s any tool that pulls your financial data from its source and turns it into a finished report without someone manually copying and pasting numbers or rebuilding a spreadsheet every cycle. That can be a Power BI dashboard connected to your ledger, a scheduled Power Automate flow that assembles a PDF and emails it out, or a full reporting environment that combines several data sources into one recurring output.
A well-built spreadsheet still needs someone to open it, refresh the data and check that nothing broke. Automated reporting software removes that step entirely. The connections, calculations and formatting are set up once, and after that the report generates itself on schedule, which is the main thing that separates it from even the most polished manual workbook.
Most setups connect to your accounting or ERP system as the core source, whether that’s Dynamics 365, QuickBooks or something similar, and then layer in whatever else feeds your reporting, such as a CRM, a budgeting tool or operational data sitting outside the ledger. The right mix depends on what your reports actually need to show.
Most setups connect to your accounting or ERP system as the core source, whether that’s Dynamics 365, QuickBooks or something similar, and then layer in whatever else feeds your reporting, such as a CRM, a budgeting tool or operational data sitting outside the ledger. The right mix depends on what your reports actually need to show.


