
Retail business intelligence is the process of collecting, analysing, and presenting retail data to understand how a retail business is performing. It uses data from systems such as point-of-sale platforms, ecommerce stores, marketing tools, and inventory systems to produce reports that help retailers monitor operations and evaluate business performance.
As a business intelligence consulting company, we have developed 1,000+ reporting dashboards for retailers, ecommerce businesses, and distributors that need better visibility into sales performance, inventory levels, marketing activity, and customer behaviour. These dashboards combine data from multiple retail systems and present it in structured reports that managers and executives can easily review.
This article explains what retail business intelligence is, why it matters for the retail industry, and how retailers use BI dashboards to analyse different areas of their business. It also covers practical retail BI use cases, important retail KPIs, common implementation challenges, best practices, and the tools used to build modern retail reporting systems.
Retail business intelligence (BI) refers to the use of data analytics tools and technologies to collect, analyse, and visualise retail data in order to support better business decisions. It transforms raw data from systems such as point-of-sale platforms, ecommerce stores, marketing tools, and inventory systems into insights that retailers can use to improve operations and strategy.
Retail BI dashboards help businesses monitor key areas such as sales performance, inventory levels, marketing effectiveness, and customer behaviour. By analysing this information, retailers can identify trends, detect operational issues early, and optimise pricing, promotions, and product assortments.
Modern retail BI solutions often combine technologies such as data warehousing, analytics and visualisation tools, cloud platforms, retail BI tools, and artificial intelligence to process large volumes of data and turn them into insights for managers and executives. Retail BI tools help retailers analyse sales performance, manage inventory levels, forecast demand, and understand customer behaviour.
Additionally, robust data storage is a foundational component that supports the integration and accessibility of retail data for BI solutions, ensuring real-time and user-friendly access to information across business applications.
Implementing retail business intelligence doesn’t have to be a process you plan for months unless you run an enterprise-level company. Most SMEs in retail can achieve some quick wins in a matter of weeks.
There are a few questions you need to answer before you start with your hands-on implementation though:
If you have answers to these questions you now know what output you want (analysis and dashboards) and the input (raw data). Now we need to plan how to transform this data into dashboards.
At this stage you need to select the BI tool for your project. Most companies go for either Tableau or Power BI for creating their dashboards. Honestly, in our experience, both tools are pretty similar in terms of pricing and capabilities. Picking one is mostly a matter of personal preferences.
The next step is building your data integrations. Our goal is to automatically extract data from the sources and make it easily accessible for Power BI or Tableau. You can either find ready-made data integrations to your sources or write your own code for extracting data from an API. AI makes the technical barrier to writing API integrations from scratch a lot lower. You can read more about this in our guide to vibe-coding an API integration for Power BI.
You would end up with a Python code that you could use for your data extraction. This code extracts the data automatically into a data warehouse. You can read about the costs, architecture and most commonly used technologies in our business intelligence data warehouse guide.
Finally, it’s time to build your KPI dashboards. You would code the formulas for your main metrics in Power BI or Tableau and visualize the results. The goal here is to make your dashboards easy to read so management can see when to re-stock on certain products or renegotiate payment terms with suppliers.
Our dashboard development consultants have developed retail business intelligence solutions for clients like Dermalogica, Ray Ban and 700+ others. We are showing the most common requests we receive below.
Retail brands operating multiple physical stores need clear visibility into how each location and product line performs. Without centralized reporting, it becomes difficult to understand which stores are products are driving revenue. Retail business intelligence dashboards help consolidate this information, allowing management teams to quickly identify performance trends and make informed decisions
Our Power BI experts developed the dashboard above for a jewelry retailer using the data from Shopify POS.
Users can switch between these metrics using slicers and dynamically change the breakdown by product category, collection, or sub-collection. Selecting a store in the bar chart filters the rest of the report, allowing management to analyse product performance at the store level and compare performance across locations.
This structure supports faster merchandising and operational decisions. Management can evaluate how newly launched collections perform compared to core products. Store managers can identify the product categories driving revenue in their location. Regional leaders can compare stores to identify performance gaps and opportunities.
Online retailers depend heavily on digital marketing channels to generate traffic and sales. However, marketing data is often spread across multiple platforms such as Google Ads, Facebook Ads, Amazon and ecommerce systems. Without a unified view, it becomes difficult to understand which channels drive revenue, how marketing spend affects profitability, and where optimisation opportunities exist.
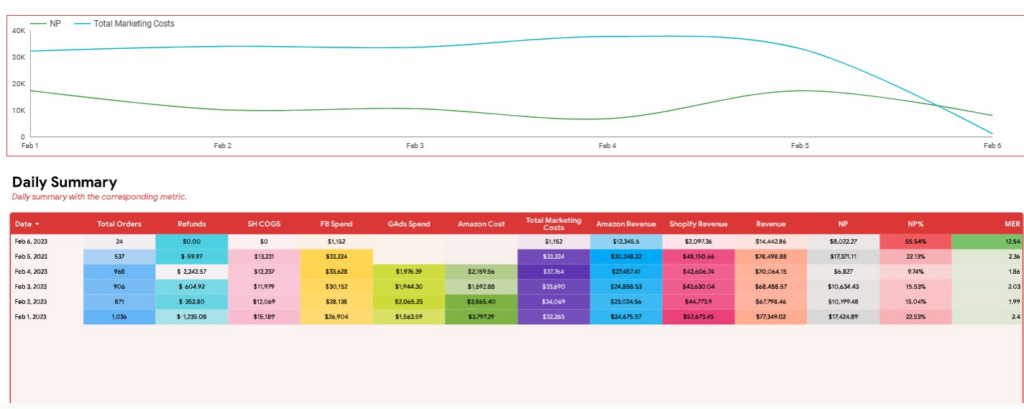
Our BI experts developed a dashboard for an online retailer that sold through Amazon and Shopify. They used Facebook, Google and Amazon Ads for promoting products. We combined all of this data together to calculate the overall return on marketing spent.
This dashboard drills down further into campaigns, ad thumbnails and keywords that generate revenue. The marketing team uses this information to further optimise their PPC ads and produce future ad creatives.
Effective inventory management is critical for retail businesses, especially when a lot of money is tied up in inventory. It is even more important for retailers that sell perishable goods. Without proper analysis, companies risk tying up capital in slow-moving items or running out of popular products that sell the most. Retail data analytics helps businesses monitor stock movement, understand demand patterns, and maintain the right balance between product availability and inventory investment.
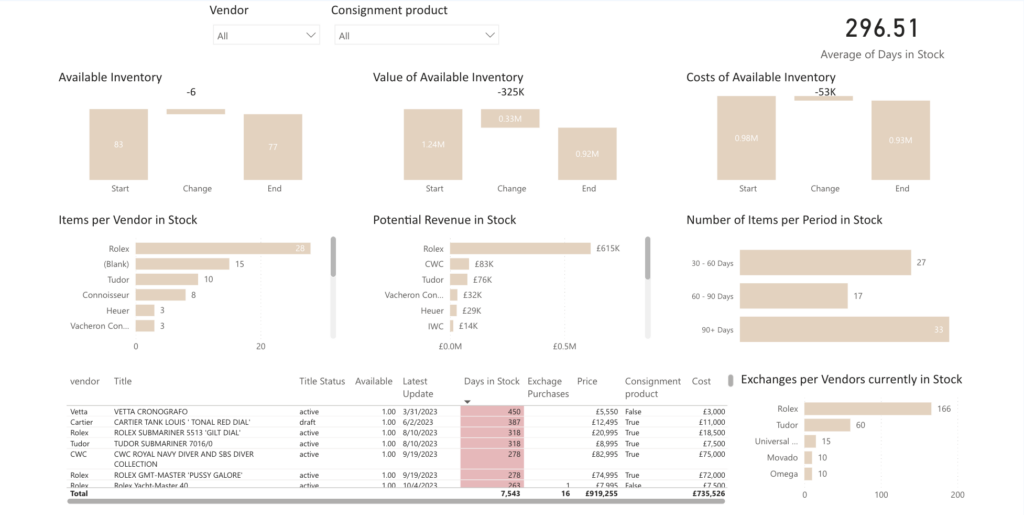
Our Tableau specialists developed the dashboard above for the company that sells luxury watches. It analyses how long items typically remain in stock. By examining inventory turnover alongside sales trends, the report highlights which watch brands sell quicker than others. This visibility allows management to detect slow-moving items early and adjust purchasing strategies accordingly.
If you are running a more common retail brand and have a warehouse management system, this analysis would be a bit different. You would typically analyze number of goods coming in and out and calculate re-order points. You can view our Power BI warehouse dashboard example if you are interested in this type of analysis.
Retailers need a clear understanding of how different products and product groups contribute to overall store performance. Without structured analysis, it becomes difficult to identify which products generate the most revenue, which deliver the highest margins, and where pricing or promotion strategies should be adjusted. Retail business intelligence dashboards help managers evaluate product performance and make more informed merchandising decisions.
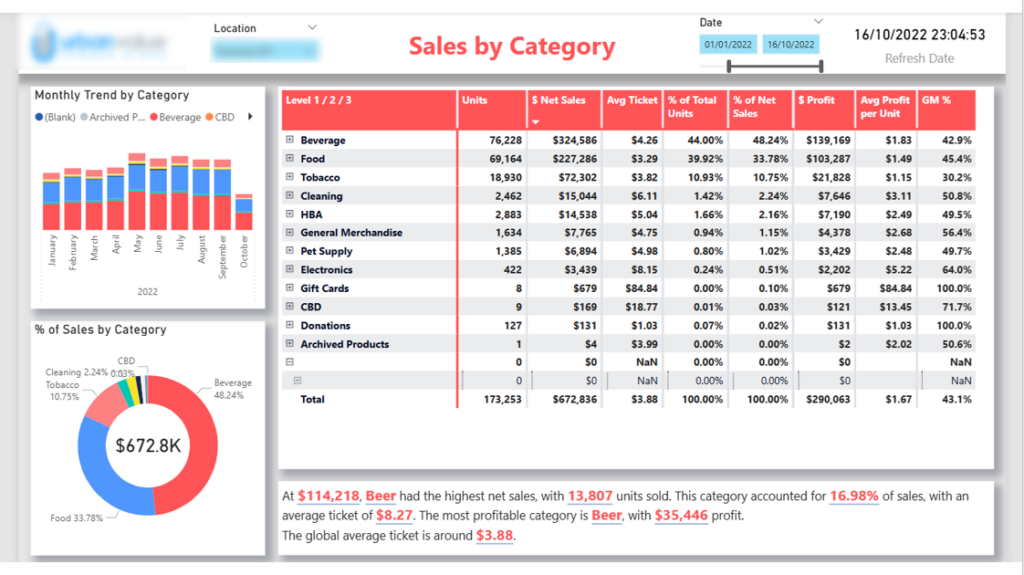
Our team developed the dashboard above for a supermarket brand to analyze the revenue from food, beverages, and tobacco. The report provides a clear overview of product performance, allowing users to track sales trends, compare product groups, and understand how different categories contribute to overall store results.
These insights help retailers optimise product assortment, evaluate pricing strategies, and assess the impact of promotions. By understanding which products drive both sales and profitability, management can make better decisions about shelf space allocation, promotional focus, and future assortment planning.
Retail brands that sell through large retail partners like Target or Walmart often need a dashboard to manage these relationship. Without structured reporting, it becomes difficult to track sales and plan further inventory top-ups. Business intelligence KPI dashboards help teams monitor sales performance and respond faster to changes in demand.
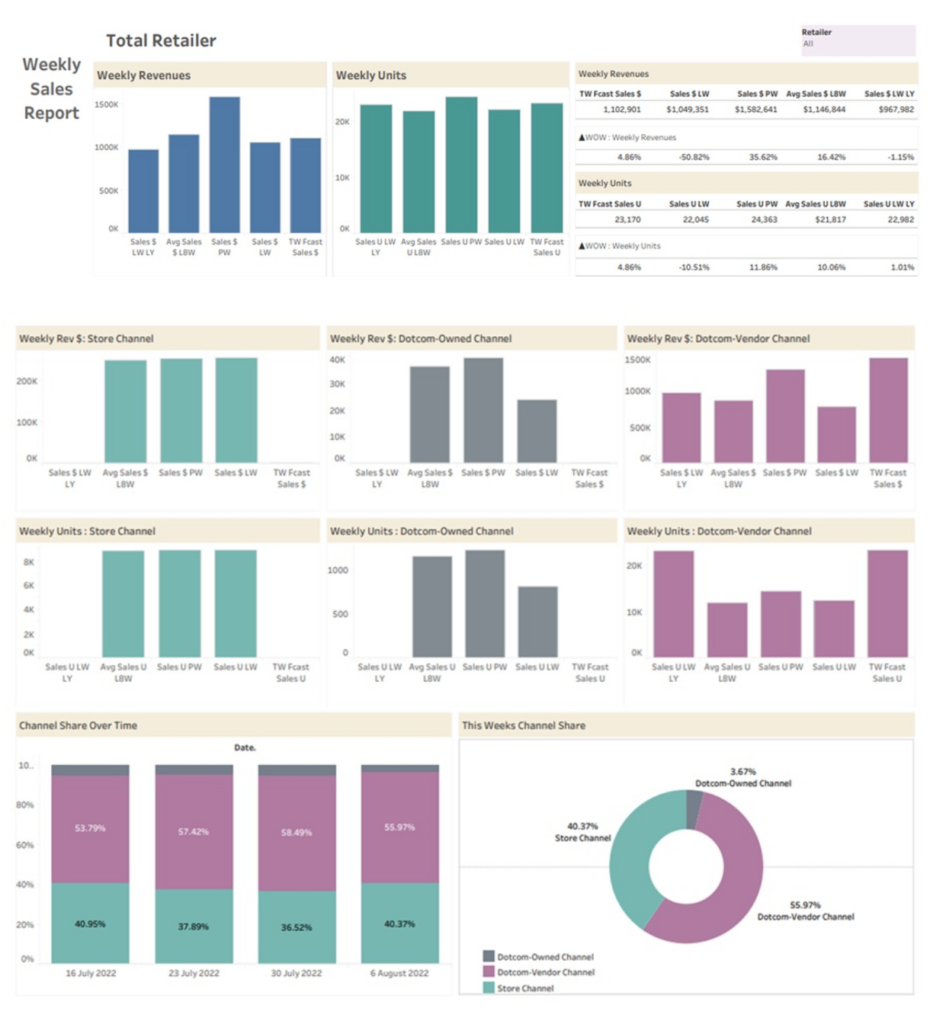
Our DOMO consultants developed the dashboard above for a brand that sells through Target. It analyses weekly sales performance and compares current results over time to detect changes in product demand. When sales accelerate, the clients contact Target offering them to buy another batch of their products to avoid stockout.
The dashboard also breaks down performance by sales channel, separating brick-and-mortar store sales from online sales. This allows teams to identify which channel requires attention and take targeted actions, such as improving online product listings or adjusting packaging and in-store presentation. By combining weekly monitoring with channel analysis, the dashboard turns sales data into a practical decision-making tool for retail teams.
Retailers need to understand how customers behave inside their stores in order to improve sales performance and customer experience. Without this analysis, it becomes difficult to identify peak shopping hours, measure how effectively store visits convert into purchases, or detect missed sales opportunities. Retail business intelligence dashboards help connect customer activity with revenue performance in a single view.
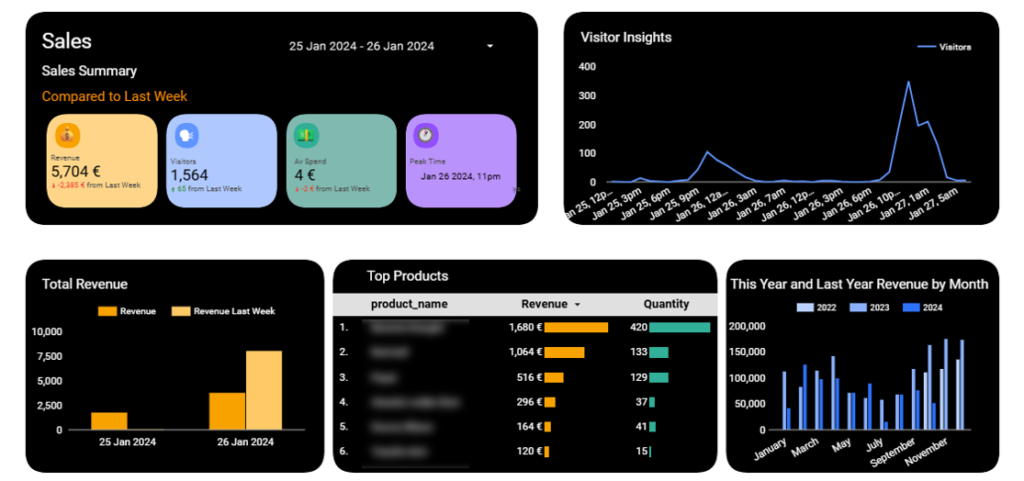
Our data visualization specialists developed this dashboard combining foot traffic data from door sensors with sales data from the POS system. By analysing visitor numbers alongside revenue and quantity sold, retailers can evaluate how customer traffic throughout the day translates into actual sales.
The dashboard highlights visitor trends, peak store hours, and changes in sales performance compared with previous periods. By analysing these patterns together, management can measure visitor-to-customer conversion and identify times when high traffic does not translate into expected revenue.
These insights help retailers better understand customer behaviour in physical stores. Teams can optimise staff scheduling during busy periods, improve in-store sales engagement, and adjust store operations to ensure that customer visits are more effectively converted into purchases.
Retailers and distributors that import products need clear visibility into how goods move through their supply chain. Without structured reporting, it becomes difficult to understand where products are sourced from, how shipment volumes change over time, and how import tariffs affect overall costs. Business intelligence dashboards help organisations analyse supply chain activity and identify opportunities to improve efficiency and reduce costs.
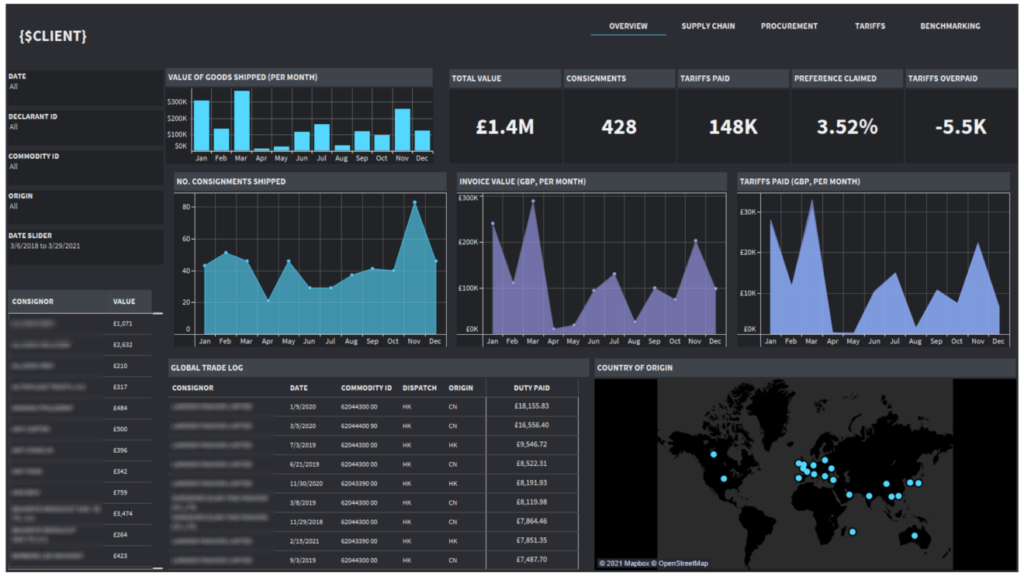
Our Power BI developers built a dashboard that analyses purchasing and import activity across the supply chain. The report shows where goods are sourced from by country and tracks shipment volumes, import values, and tariffs paid over time. This allows management to understand how sourcing decisions and logistics operations impact financial performance.
The dashboard also highlights imports that fall under preferential trade agreements and compares tariffs that were paid with tariffs that could have been applied. This makes it easier for businesses to detect inconsistencies, identify potential overpayments, and ensure that preferential tariff rates are correctly utilised.
These insights help organisations optimise sourcing strategies, reduce unnecessary import costs, and improve visibility across international supply chains. By analysing supplier locations, shipment activity, and tariff structures together, businesses can make more informed decisions that protect margins and improve supply chain efficiency.
Retailers operate in highly competitive markets where pricing, product assortment, and promotions constantly evolve. Without proper data analysis, it becomes difficult to understand how competitors position their products and how those strategies influence customer demand. Retail business intelligence helps organisations analyse market trends and benchmark their performance against competitors.
Competitive analysis dashboards combine internal sales data with external market information such as competitor pricing, product availability, promotions, and market share indicators. By analysing these factors together, retailers can better understand how their products perform relative to the broader market.
These insights help businesses identify pricing opportunities, detect shifts in competitor strategies, and respond faster to changes in the market. Retail teams can adjust pricing, refine promotional campaigns, and optimise product assortments to maintain competitiveness while protecting margins.
Competitive analytics ultimately supports more informed strategic decisions, enabling retailers to position their products effectively and respond proactively to market dynamics.
Retail businesses process large volumes of transactions across stores, ecommerce platforms, and payment systems. Without proper monitoring, fraudulent activities such as suspicious transactions, refund abuse, or unusual purchasing patterns can go unnoticed. Retail business intelligence dashboards help organisations detect anomalies in transaction data and identify potential fraud risks early.
Fraud detection analytics typically involves monitoring transaction behaviour across multiple dimensions, including payment methods, purchase frequency, refund activity, and unusual spending patterns. By analysing these patterns over time, dashboards can highlight transactions that deviate from normal behaviour and require further investigation.
Retail teams can use these insights to detect issues such as repeated high-value refunds, unusual purchasing behaviour, or abnormal activity associated with specific accounts or locations. Visualising these patterns makes it easier for management and finance teams to quickly identify suspicious activity and investigate potential fraud.
By improving visibility into transaction data, fraud detection dashboards help retailers reduce financial losses, strengthen internal controls, and maintain trust with customers and partners.
Retailers receive large volumes of customer feedback through product reviews, social media, customer support interactions, and online ratings. Without analysing this information systematically, it can be difficult to understand how customers truly feel about products, services, or the overall brand experience. Retail business intelligence dashboards help organisations analyse customer sentiment and identify patterns in feedback.
Sentiment analysis uses natural language processing techniques to evaluate customer comments and classify them as positive, negative, or neutral. By analysing reviews and feedback at scale, retailers can detect recurring themes related to product quality, delivery experience, pricing, or customer service.
Dashboards visualising sentiment trends allow management to quickly identify areas where customers are satisfied and where improvements are needed. For example, sudden increases in negative sentiment around a product or service can signal operational issues that require immediate attention.
These insights help retailers improve customer experience, refine products and services, and respond proactively to customer concerns. By incorporating sentiment analysis into retail analytics, businesses gain a deeper understanding of customer perception and can make more informed decisions to strengthen brand loyalty.
Retail BI dashboards are most useful when they focus on the metrics that directly reflect business performance. Tracking the right key performance indicators (KPIs) allows retailers to understand what drives revenue, monitor operational efficiency, and detect potential issues early. While the exact KPIs may vary depending on the business model, several metrics are commonly used across retail analytics reports.
Together, these KPIs provide a strong foundation for retail business intelligence dashboards and help organisations monitor performance across sales, inventory, and customer behaviour.
Strong customer relationships are at the heart of every successful retail business. Business intelligence empowers retailers to understand their customers on a deeper level by analyzing customer data, purchasing patterns, and feedback across multiple channels. This data-driven approach enables retail businesses to deliver personalized experiences, improve customer satisfaction, and foster long-term loyalty.
By leveraging business intelligence solutions, retailers can segment their customer base and identify key trends in customer behavior. This helps to create targeted marketing campaigns that resonate with specific customer segments, increase the effectiveness of marketing efforts and drive higher engagement. BI tools also help retailers optimize pricing strategies to better meet customer expectations and maximize customer lifetime value.
Business intelligence can also be used to enhance customer service by identifying areas where improvements are needed. By analyzing customer feedback and service requests, retailers can pinpoint pain points in the customer journey and implement changes that improve customer satisfaction. Personalized marketing campaigns, informed by customer data and preferences, further strengthen the bond between retailers and their customers.
Business intelligence provides retailers with practical tools to improve how they plan, operate, and grow their business. By analysing data from sales, marketing, inventory, and customer interactions, BI helps organisations move away from guesswork and base decisions on reliable information.
One of the key benefits is better visibility across the business. Retail teams can easily see how stores, products, and sales channels perform in one place. This makes it easier to identify trends, detect operational issues, and understand what is driving revenue or causing performance declines.
BI also helps improve customer retention by identifying loyal customers, tracking repeat purchase behavior, and providing insights into loyalty metrics. Business Intelligence enables retailers to design and evaluate effective loyalty programs that drive engagement and repeat business.
Additionally, business intelligence helps retailers optimise inventory and merchandising decisions. By analysing sales patterns and product performance, businesses can ensure that the right products are available at the right time while reducing excess stock and improving cash flow.
Another important benefit is improved marketing effectiveness. BI dashboards allow retailers to evaluate how marketing campaigns perform across different channels, helping teams allocate budgets more effectively and focus on strategies that generate the highest return.
Finally, business intelligence enables more confident decision-making. Instead of relying on manual reports or fragmented data sources, managers can access up-to-date dashboards that provide clear insights into current performance. This allows retailers to react quickly to changes in demand, customer behaviour, and market conditions.
While business intelligence offers significant benefits, implementing BI in retail also comes with several challenges. Retail businesses often operate across multiple systems, including point-of-sale platforms, ecommerce stores, marketing tools, inventory systems, and supply chain software. Bringing all of this data together into a single reporting environment can be complex and requires reliable data integration.
Another common challenge is data quality and consistency. Retail data is often collected from different sources that may use different formats, naming conventions, or update frequencies. Without proper data preparation and validation, dashboards can produce misleading insights or incomplete analysis.
Retail organisations may also face challenges related to data accessibility and reporting processes. In many companies, data is still stored in spreadsheets or separate systems, which makes reporting time-consuming and difficult to scale. Building automated dashboards requires establishing reliable data pipelines and structured data models.
Finally, successful BI adoption requires training and organisational alignment. Even the most advanced dashboards provide little value if teams do not understand how to use them or integrate them into their daily decision-making processes. Retail businesses that invest in clear reporting structures and user-friendly dashboards are more likely to fully benefit from business intelligence.
To get the most value from retail business intelligence, companies should follow a structured approach when designing dashboards and analytics processes. The following best practices help ensure that BI systems deliver reliable insights and support better decision-making across retail operations.
Retail businesses use a range of business intelligence tools to collect, analyse, and visualise data from multiple sources. These tools help organisations combine information from point-of-sale systems, ecommerce platforms, marketing channels, and inventory systems into a single reporting environment.
One of the most widely used BI platforms is Microsoft Power BI, which allows retailers to build interactive dashboards and analyse data from many different systems. It is commonly used for tracking sales performance, inventory levels, and marketing analytics.
Tableau is another popular data visualisation platform that helps retailers explore complex data sets and create detailed analytical reports. It is often used by organisations that require advanced visual analytics and flexible reporting capabilities.
Retail teams also use tools such as Looker Studio to build marketing and ecommerce dashboards, especially when analysing data from platforms like Google Analytics, Google Ads, and ecommerce systems.
These BI tools typically integrate with retail data sources such as Shopify, Magento, WooCommerce, POS systems, CRM platforms, and ERP systems using data connectors. By combining these data sources in a single dashboard, retailers gain a clearer view of their business performance.
Business intelligence in retail continues to evolve as companies adopt new technologies to better understand customers, optimise operations, and improve decision-making. With growing volumes of data coming from ecommerce platforms, physical stores, and digital marketing channels, retailers are increasingly relying on advanced analytics tools to extract meaningful insights.
One of the key trends is the use of predictive analytics, which helps retailers forecast demand, anticipate customer behaviour, and plan inventory more accurately. By analysing historical sales and seasonal patterns, businesses can make more informed decisions about purchasing, pricing, and promotions.
Another important trend is the increasing use of real-time dashboards. Retail managers can monitor sales, inventory levels, and marketing performance as data updates throughout the day, allowing them to react quickly to changes in demand or operational issues.
Retailers are also integrating artificial intelligence and machine learning into their analytics platforms. These technologies help identify patterns in large datasets, automate reporting, and generate insights that would be difficult to detect through manual analysis. As a result, BI systems are becoming more proactive, helping businesses predict trends and respond faster to market changes.
Retail businesses generate large amounts of operational data every day, but without the right reporting systems it can be difficult to understand how the business is performing. Retail business intelligence helps organisations organise this data into clear dashboards that allow managers to monitor sales, inventory, marketing performance, and customer behaviour in one place.
As shown throughout this guide, retail BI dashboards support many areas of the business, from store performance and inventory management to marketing analysis and supply chain monitoring. With the right analytics tools and reporting structure, retailers can identify performance trends, improve operational efficiency, and make more informed decisions.
If you are looking to implement retail business intelligence dashboards or improve your existing reporting systems, our BI consultants can help. We design and develop customised analytics solutions that integrate data from your retail platforms and present it in easy-to-use dashboards.
Contact us to discuss how we can help you build a retail business intelligence solution tailored to your business!


