

Hospitality businesses, such as hotels and restaurants, that are still making decisions based on intuition or ‘what worked last season’ are quietly losing guests, revenue, and market share to data-driven competitors.
Hotel data analytics flips the script by helping you spot booking trends, understand guest behaviour, and act quickly in ways that grow your business.
At Vidi Corp we have created custom data analytics solutions for chains like AC Hotels and boutique hotels in Europe. We have summarised our experience working on data analytics consulting projects in this article, showing with real examples, tools, key metrics, and practical steps.
Hoteldata analytics means analysing and interpreting data to improve the operations of a hotel. Importantly, hotel data analytics covers more than just room rentals since hotels also operate Food & Beverage departments, leisure centers and more. The primary data sources include guest, booking, and operations data from the booking and point of sale systems.
You already collect so much data through your POS, booking engine, social media and review platforms. Analytics helps you connect the dots.
It shows what’s working, what’s not, and where you’re wasting time or money.
And it helps you do something about it.
Data analytics falls into four types, and each answers a different question about your hotel. Most properties start with the first and add the others as their data matures.
This is the foundation. It turns your historical data into something you can read at a glance: last month’s occupancy, ADR and RevPAR, or revenue split by room type and booking channel.
Descriptive analytics won’t tell you why the numbers moved, but it gives you an accurate picture of the past. If your management reporting still lives in spreadsheets, the first job is usually to automate it using tools like Power BI. It pays off quickly, because your access to data becomes more real-time and you can make informed decisions more frequently.
Once you know occupancy dropped in March, the next question is why. Diagnostic analytics digs into the data to find causes and patterns. That might mean drilling from a headline figure down into individual channels, comparing corporate against leisure bookings, or spotting that the dip lines up with a competitor’s rate cut.
This is where interactive business intelligence dashboards earn their keep. Your revenue manager can explore the data and answer the question directly, instead of waiting a week for an analyst to run the numbers.
Predictive analytics uses past patterns to forecast what comes next. In a hotel, that means demand forecasting by date, predicting cancellations and no-shows, or estimating length of stay on an incoming booking. It relies on statistical models and machine learning, so it needs a good volume of clean historical data to work well.
It’s worth being honest about the limits. A forecast is a probability, not a guarantee. It gives you a real planning edge, but it won’t predict next quarter exactly, and accuracy slips when market conditions change.
The last type goes beyond forecasting to recommend an action. Prescriptive analytics weighs the options and their likely outcomes, then suggests the best move. In a hotel, that looks like setting dynamic room rates by date, deciding how much inventory to release to each OTA, or matching staffing to forecast occupancy.
It’s the most powerful of the four, and the most demanding. You need reliable data and solid predictive models underneath. You also need a clear definition of what “best” means (more RevPAR, higher occupancy, or better margin) before the recommendations are worth acting on.
In practice, these four types aren’t a strict ladder you climb one rung at a time. A hotel might run mature descriptive reporting alongside a single well-chosen forecasting model. The right mix depends on the decisions you’re trying to make and the quality of the data behind them.
Based on our experience creating custom KPI dashboards, the following KPIs are most common in hotel data analytics projects:
Our business intelligence consultants delivered data analytics projects for hotels ranging from single properties to multi-site chains. Here are three examples of the dashboards and models we’ve built.

This dashboard is built for hotel owners and revenue managers who run one or more properties. It pulls every performance KPI into a single view, so the team can see how the business is doing without opening a stack of separate reports. It suits hotel groups whose data sits in a property management system but never lands in one place.
We built this dashboard for an Australian hotel chain that stored its data in RMS Cloud. Our data engineers created an automated pipeline that extracts the data and loads it into a SQL Server database. The dashboard then tracks room revenue, average daily rate, occupancy and booking trends, and splits income across rooms, food, drinks and commissions.

A second view shows total bookings per month and the status of each one. The team can select a single metric and see it across every chart at once. Each metric breaks down by day of the week and compares the current year against the last.
A final view sets out the average daily room rate by month for every room category. This gives managers a clear read on how their pricing moves through the year. They can see which categories hold their rate and which soften in the off-season, then adjust with real evidence behind the decision.
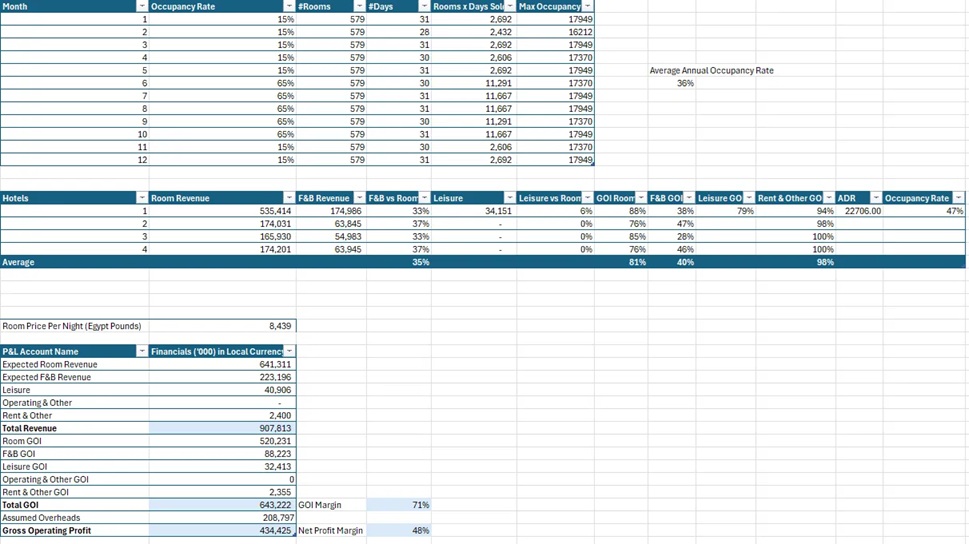
This model is aimed at investors weighing up whether to buy a hotel. It estimates the returns a property could generate before any money changes hands. It fits private investors and acquisition teams who need a clear financial picture of a target property.
Our data visualization consultants built this model for an investor looking at a hotel in Egypt. We started from the known room count and a set of occupancy assumptions, then projected expected room, food and beverage, and leisure revenue. From there it calculates gross operating income and profit, landing on a GOI margin of 71% and a net profit margin of 48%.
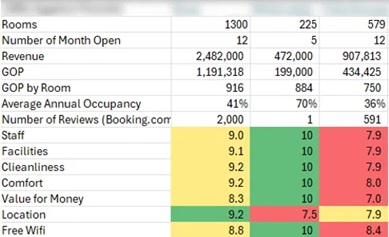
We also benchmarked the hotel against nearby competitors using guest-review scores from Booking.com. The model scores each property on staff, cleanliness, comfort, facilities, value for money, location and wifi, and flags the weak areas in red. For this hotel, staff service and value for money came out as the lowest-scoring areas.
The review benchmark turns a purchase decision into a plan. An investor can see not only whether the numbers work, but exactly where the hotel trails its neighbours and what staff training would need to fix after a purchase. That makes it easier to price the deal and prepare an operational plan from day one.
Food and Beverage (F&B) Staff Cost Dashboard
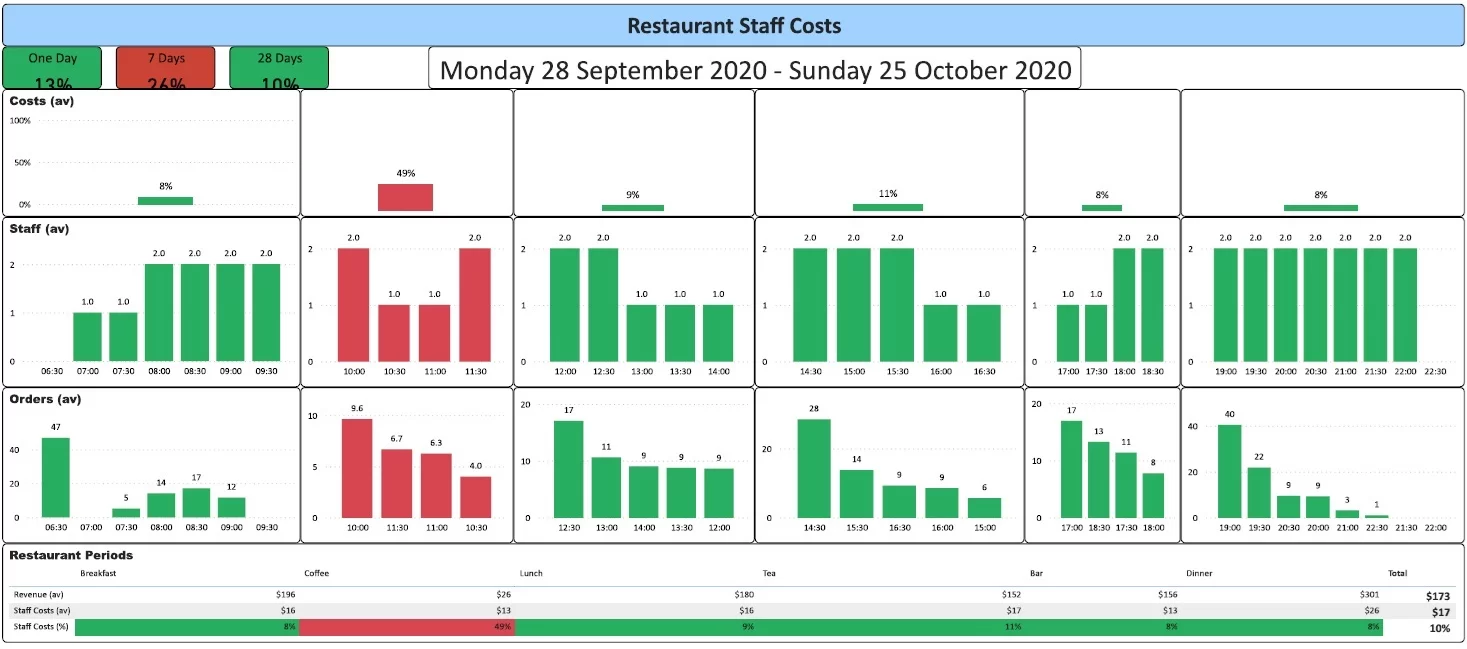
Built for hotel food and beverage managers, this restaurant KPI dashboard controls staff costs without leaving a shift understaffed. It covers every service period, from breakfast and lobby coffee through to the bar and dinner. It suits hotels that run their own restaurants, bars and in-house dining.
Our dashboard consultancy created this dashboard to match staffing to demand across the day. It breaks each service period into half-hour slots and shows three things side by side: staff on shift, orders taken and revenue. Staff cost as a share of revenue sits at the top, with colour coding that turns red when a period runs too high.
With this view, managers can see exactly where they are paying for staff who have too little to do. A mid-morning coffee period running at 49% staff cost stands out immediately against a dinner service at 8%. The team can then adjust rosters period by period, protecting service at busy times and margin at quiet ones.
In the case studies above, you saw how others use their data to stay ahead. Now, we’ll talk about how yours can start working for you, too.
Raise or drop prices based on demand, seasons, or booking trends so you stop leaving money behind.
See guest preferences and personalise offers, room setups or menus because, as you know, it’s not the food or the bed people pay for, it’s the experience.
Examine your competitors’ pricing, promotions and reviews with analytics to know where you stand, what to improve, and how to outdo them.
Analytics lets you observe trends on which days or seasons are usually busy so that you can plan staff, supplies and inventory ahead.
You not only see which channels converted for bookings or walk-ins, but you also see which ones attracted high-paying guests.
You can keep tabs on delays, complaints, and service times, then fix what’s slowing things down or annoying your guests.
Analytics helps you recognise repeat guests so you can reward them and ensure their return without having to offer discounts all the time.
Know when extra hands need to be called in or when stock needs replenishing, so you are ready without overstaffing or wasting supplies.
Depending on what you want to improve in your hospitality business, you will most likely find yourself carrying out the following types of analytics:
See which items or services bring in the most revenue, how sales trend over time, and where to focus promotions.
Study how well your team is doing. Service speed, table turnover, staff attendance – all of it shows where things are smooth or slow.
Take notice of when people book, how long they stay, if they even show up, and what channels attracted them.
Find out which discounts bring repeat guests and which ones only eat into profits. Not every offer helps your business.
Keep an eye on how money flows daily, weekly, and monthly. Helps you manage cash, stock, and overall business health.
Your data already lives in the tools you use daily. This is a breakdown of the different places you can get data for hospitality analytics:
| Data Source | Data | Use |
| Booking Systems | Check-in/check-out dates, room/table type, booking channel | Observe booking trends, adjust pricing, and plan staff shifts |
| Guest Feedback | Reviews, surveys, ratings, and social media comments | Improve service, fix pain points, and find out what guests love |
| Operational Data | Staff shifts, service time, inventory levels, and wait times | Reduce delays, manage costs, and improve daily operations |
| CRM System | Guest profiles, preferences, and stay history | Personalise offers, track loyalty |
| Market Data Tools | Competitor rates, market demand, and local events | Benchmark pricing, predict high-demand periods |
| Website & Social Media | Page visits, clicks, engagement | Measure campaign success, find top channels |
Once you know where your data is coming from, the next step is choosing a tool that helps you analyse it.
The most common tools for data analytics are Power BI, Tableau, and Looker Studio. This breakdown should guide you in deciding which one of the three is best for your business:
| Tool | Use if | Budget |
| Power BI | You prefer clean visuals, easy report sharing, and already use Excel or other Microsoft tools in your workflow. | Free to $20/user/month |
| Tableau | You need really powerful dashboards, love to explore your data in depth, and want less restrictions on design. | $15 to $70/user/month |
| Looker Studio | You want to use a free tool with good integration to Google Sheets, Ads, or the rest of Google’s products. | Free |
AI has moved from buzzword to practical tool in hospitality, and analytics is where it’s making the most tangible difference. The reason is simple: hotels, restaurants and venues generate enormous amounts of data across bookings, EPOS systems, guest feedback and staff rotas, and AI is very good at finding patterns in data that would take a human analyst weeks to spot.
Traditional forecasting leans on last year’s numbers and a bit of intuition. AI-driven forecasting takes in far more signals at once: local events, weather, school holidays, competitor pricing, even booking pace in the days leading up to a date. That means sharper predictions for covers, occupancy and staffing needs. For a restaurant, better forecasting translates directly into less food waste and fewer shifts where you’re either overstaffed or turning tables away because the kitchen can’t keep up.
Hotels have used revenue management systems for years, but AI has made them accessible to smaller operators. Instead of setting rates by season and hoping for the best, AI models adjust pricing continuously based on demand signals. The same logic is creeping into restaurants through off-peak offers and booking platform incentives. It works, but it needs guardrails. Left unchecked, aggressive dynamic pricing can erode guest trust, so the best implementations keep humans in the loop for the rules that matter.
Reading every review across Google, TripAdvisor and booking platforms is impossible for a busy operations team. AI sentiment analysis reads all of it and surfaces the themes: which dishes get mentioned negatively, which staff members get praised by name, whether complaints about wait times are getting worse. This turns thousands of unstructured comments into a handful of clear, prioritised actions.
Perhaps the most immediate win is how AI changes the reporting workflow itself. Tools like Copilot in Power BI let managers ask questions in plain English, such as “how did Sunday lunch covers compare to last month”, and get an answer without knowing how to build a report. That lowers the barrier for general managers and head chefs who need insight but don’t have time to learn a BI tool properly.
AI in hospitality analytics is only as good as the data feeding it. If your EPOS, booking system and rota software don’t talk to each other, an AI layer on top won’t fix that. The unglamorous work of integrating data sources and cleaning up what goes in still comes first. Get that foundation right, though, and AI stops being a gimmick and starts paying for itself in tighter margins, better staffing decisions and happier guests.
Ironically, data analytics is 80% preparation and 20% actual analysis. This is the point many businesses miss. So, if you want to implement analytics and implement it right in your hospitality business, follow these steps:
Data analytics doesn’t start with ‘data’. It starts with you. Your business – the specific problems you want to solve. So, before anything else, figure out what you want to achieve in your business. It could be to increase direct bookings, reduce labour costs, or improve review scores. This guides everything that comes after.
When the business objective is set, the next step is combining your systems and data sources to see if you have the necessary data to meet it. You also want to make sure the data is accurate, consistent, and trustworthy for further analysis and use.
You probably have useful data sitting in three to five systems. That’s good, but analytics help you better when you’re able to connect all your data logically. To do this, you can use any of the tools mentioned above to integrate data from your key systems (PMS, CRM, POS). Depending on your use case, you may need something custom, i.e. custom connectors, to correctly integrate your data.
This can’t be over-emphasised. You need tools that match your team’s skill level, your business goals, and your data size. No point paying for a tool that’s too complex to use or doesn’t connect to your systems. Go back to your objectives, then choose the one that helps you connect, visualise, and act on your data with ease.
You already have the data. Now it’s time to use it to make clearer decisions, improve guest experience, and grow sustainably. If you’d like a smoother, hands-off way to start, reach out to Vidi Corp Data Analytics Consultancy. We’ll help you make sense of your data and turn it into tangible results.
The four types are descriptive, diagnostic, predictive and prescriptive analytics. Descriptive analytics tells you what happened, such as last month’s occupancy or covers. Diagnostic analytics explains why it happened by digging into the underlying data. Predictive analytics forecasts what’s likely to happen next, like demand for a bank holiday weekend. Prescriptive analytics goes one step further and recommends what you should do about it, such as adjusting room rates or staffing levels. Most hospitality businesses start with descriptive reporting and build towards the more advanced types as their data matures.
Yes, and most hotels are already collecting far more data than they realise through their property management system, booking engine, EPOS and guest feedback channels. The gap is rarely in the data itself but in how it’s used. Larger chains typically run dedicated revenue management and business intelligence functions, while independent hotels often rely on basic reports from individual systems. Bringing that data together into a single dashboard is usually where smaller operators see the quickest wins, because it replaces hours of manual spreadsheet work with an up-to-date view of performance.
The most common uses are revenue management, demand forecasting, staffing optimisation and guest experience monitoring. Hotels use analytics to set room rates based on booking pace and local demand, while restaurants use it to forecast covers, plan rotas and reduce food waste. Guest-facing applications include analysing reviews and feedback at scale to spot recurring problems, and using booking history to personalise offers. Operationally, analytics also helps with procurement, energy usage and identifying which revenue streams, such as food and beverage or events, are actually profitable once costs are allocated properly.
Hotels collect booking and reservation data, guest profiles and stay history, room revenue and occupancy figures, EPOS transactions from restaurants and bars, channel and commission data from OTAs, housekeeping and maintenance records, and guest feedback from surveys and review platforms. Many also gather website analytics, email engagement data and loyalty programme activity. Under UK GDPR, hotels need a lawful basis for processing personal data and should only hold what they genuinely need, so good analytics practice goes hand in hand with good data governance.
The core difference is the metrics and the pace of decision-making. Hotel analytics centres on occupancy, average daily rate and RevPAR, with pricing decisions made days or weeks ahead of arrival. Restaurant analytics revolves around covers, average spend per head, table turnover and gross profit on menu items, with decisions often made daily or even within a service. Hotels also deal with longer booking windows and channel commissions, while restaurants face sharper margin pressure and higher demand volatility. The underlying approach is the same, but the dashboards and KPIs look quite different.


