
Connect Stripe to Power BI and start making sense of your payment and subscription data right away. Our Power BI Template App for Stripe includes pre-built dashboards, a solid data model, DAX measures, and visualizations – all you need to do is plug it in and start using it.
Our template is different from all the others because we are a certified Stripe partner. Our Power BI Stripe connector is certified by their team for data security and technical capability and is available on Stripe marketplace.
Built to work seamlessly with the Vidi Corp Stripe Power BI Connector, this template is perfect for SaaS companies, subscription businesses, finance teams and business analysts who want to quickly get a handle on their revenue, subscriptions, customer retention, refunds and payment performance in one easy-to-use reporting solution.
Building a Power BI dashboard for Stripe from scratch takes about 40 working hours and requires importing data, designing a data model, creating relationships, writing DAX measures and developing reports. Our Power BI Template App for Stripe does all of that for you in about the time it takes to grab a cup of coffee.
The template includes everything you need to get started – data model, calculations & visualizations – all ready to go. Once connected, you can customise every report to meet your business needs.
Creating a Stripe reporting solution from scratch is a time-consuming, often frustrating process that requires a team of experienced Power BI developers.
Our template gives you a ready-made foundation so you can skip weeks of development work and deliver professional reports right from the get-go. Instead of building dashboards, your team can focus on what really matters: analysing performance and making better business decisions.
Many businesses use Stripe Data Pipeline in conjunction with a cloud database before they can even start building Power BI reports. This not only increases implementation time but also ongoing infrastructure costs.
As a Stripe-approved app, Our Connector comes with a SQL Server database and works seamlessly with the Power BI Template App for Stripe, providing you with a simpler and more cost-effective reporting solution.
Stripe makes it tough to get visibility into upcoming subscription renewals which means revenue forecasting is a real challenge.
The Renewals dashboard helps finance managers get a better view of future recurring revenue, identify upcoming renewals and plan cash flow with more confidence.
Subscription businesses need more than just payment reports – they need visibility into customer retention, churn and recurring revenue trends.
The Retention dashboard helps founders, finance leaders, customer success teams and product managers get a better understanding of subscription performance, identify retention issues and evaluate customer cohorts over time.
The template is designed for subscription businesses that rely on Stripe for payment processing & recurring billing.
Typical users include:
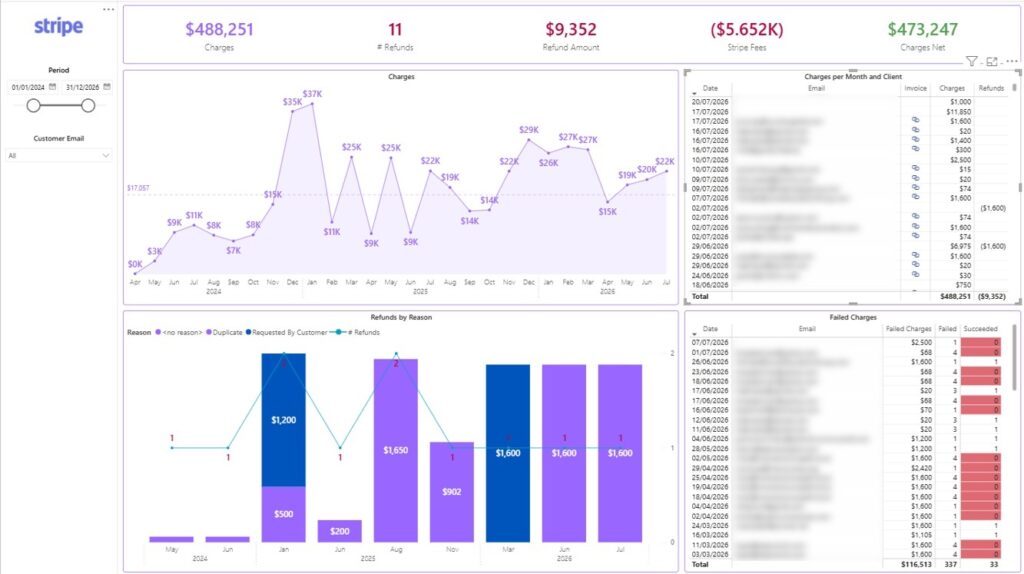
The Overview dashboard gives finance teams, operations managers and customer support complete visibility into Stripe payment activity.
It tracks charges, refunds, Stripe fees, failed payments, refund reasons and customer transactions all in one place. Users can search by customer email, review invoice PDFs and investigate payment history without needing direct access to Stripe.
Revenue operations teams can also identify failed payment retries and prioritise customers who require manual follow-up to recover lost revenue.
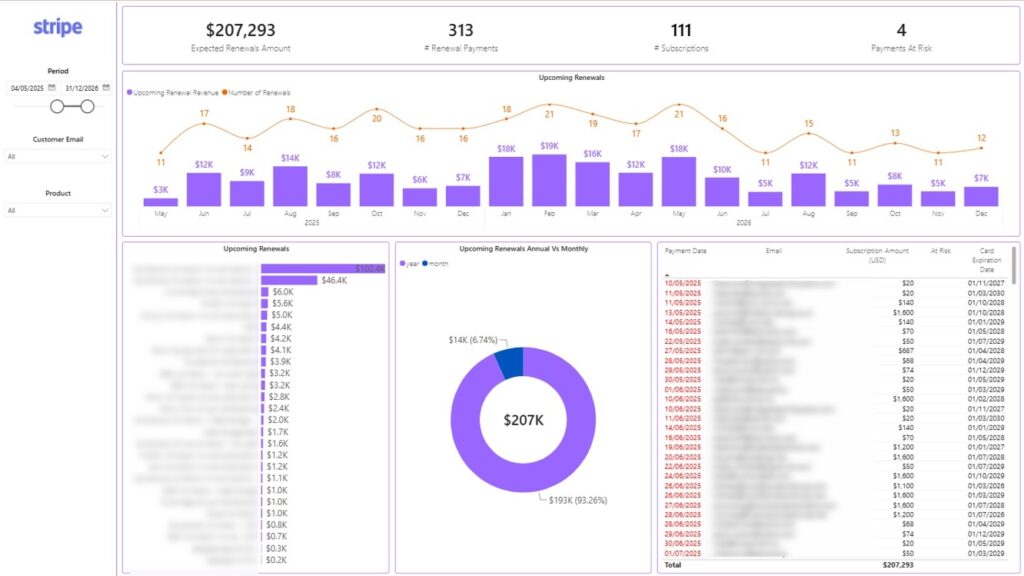
The Renewals dashboard gives visibility into subscription renewals that Stripe reporting doesn’t easily provide.
Finance managers can forecast recurring revenue by month or day and analyse upcoming renewals by product and billing frequency. Customer success teams can identify subscriptions with expired payment cards and contact customers before renewal failures occur, helping reduce involuntary churn.
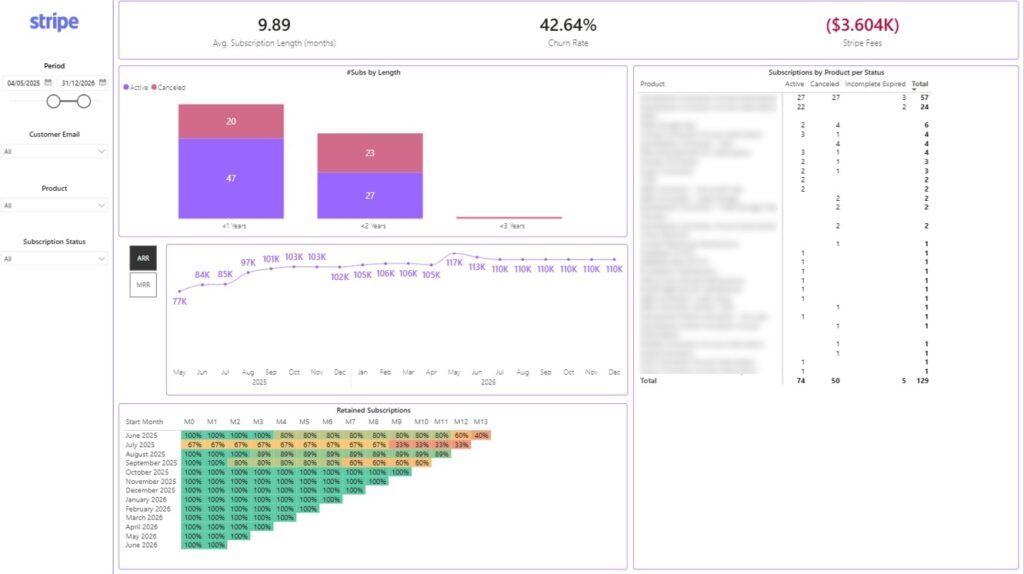
The Retention dashboard helps subscription businesses measure long-term customer performance.
Track active subscriptions, recurring revenue trends, cancelled subscriptions, subscription duration and product performance all from a single dashboard. Cohort analysis allows founders, finance teams, marketing teams & product managers to evaluate customer retention and understand which acquisition channels & products generate the highest long-term value.
Getting started is easy.
Follow this video guide below for a more detailed description on how to install this app.
The template automatically loads your Stripe data into a pre-built Power BI model with ready-made calculations and reports. Every dashboard can be customised to meet your reporting needs.
Stop building Stripe reports manually and chuck the fragmented payment reporting.
Deploy a professional Power BI Template App for Stripe in minutes and start monitoring revenue, renewals, retention, refunds and payment performance with pre-built dashboards that you can customise as your business grows.
Most users can connect the template and start analysing Stripe data in under 5 minutes. Can I Make My Own Custom Dashboards?
Yes, you can actually customise just about anything – reports, visuals, measures, and even the whole dashboard. It’s all easily done using the same tools and functionality that you’re used to in Power BI.
Absolutely – your data stays right where it belongs, within your own reporting setup, and gets refreshed over to us in a super secure way, all thanks to the solid work of the Vidi Corp Stripe Power BI Connector.
Don’t worry, we’ve got you covered – every purchase of ours comes with 3 full months of actual technical support to get you all set up and running.
We make sure your reports are always bang up to date by refreshing the Stripe data every 6 hours.


