
Property management data analytics is the secret to unlocking a clear picture of how your properties and portfolios are doing. By combining data from leasing, maintenance, finance and other business systems, property managers get a complete view of their performance – no more sifting through separate reports.
At Vidi Corp, we’ve delivered 1,000+ property management business intelligence solutions for property managers, real estate agencies, and investors. Our team crafts custom Power BI dashboards that tuck together data from all sorts of business systems, helping organisations get a grip on their portfolio performance, automate reporting & get valuable insights from key operational and financial metrics.
In this guide we’re going to break down what property management data analytics is all about, why it matters, the type of analytics that can help, some common use cases you may find useful, what key performance indicators (KPIs) are worth tracking, and the software used to make modern property management reporting solutions a reality.
Property management data analytics gets to the bottom of how your property portfolio is really performing. It’s all about piecing together information from every area of your portfolio – leasing, finance, maintenance, and property management systems all get pulled together in one place, so your teams don’t have to jump from app to app to get a complete picture.
The data ends up being presented in a way that makes sense for your people – through reports and dashboards that let you dig into portfolio performance, see how your properties stack up against each other, keep tabs on trends, and get the answers you need to make day-to-day decisions about operations and finances.
Property management companies are swamped with data pouring in from all sorts of different systems every day. Lease agreements, maintenance requests, financial transactions, property inspections and tenant records – you name it – are all too often scattered across separate apps and software, making it a real challenge to get a clear picture of how your whole portfolio is performing.
Now when your property portfolio starts to grow, the task of getting some meaningful reports out of all that data becomes a nightmare. Managers are struggling to compare one property to another, get a handle on the financials, monitor maintenance activity, and then somehow put together reports that’ll satisfy all their stakeholders. Trying to use spreadsheets or manually collecting data from multiple systems can turn what should be a simple task into a major headache and put your reports at risk of being all over the shop.
For these very reasons data analytics has become a crucial part of property management for businesses today. It gives you a way to bring all that property management data together and actually make sense of it – which makes it easier to get a handle on how your portfolio is performing and support the reports you need to give to your stakeholders.
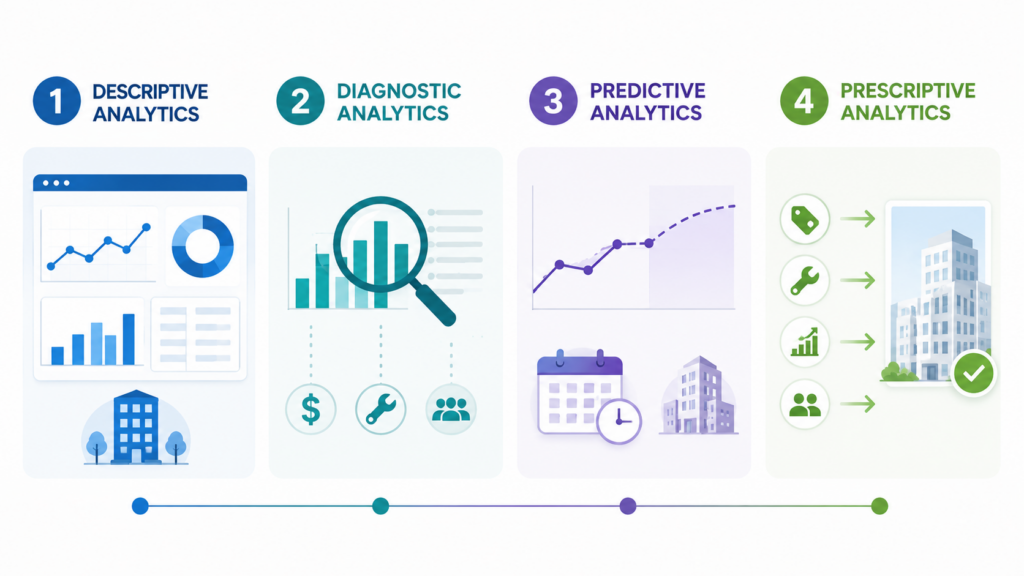
Property management data analysis can be broken down into four types: descriptive, diagnostic, predictive, and prescriptive analytics. Each one answers a different question that helps run a property – looking back at past performance, trying to figure out what went wrong, forecasting what’s going to happen next, or telling you the best course of action to take.
Descriptive Analytics
Descriptive analytics is all about telling the story of what happened. It’s basically just a way to report on historical data through reports and dashboards. That way property managers can see how their portfolio performed over a particular period of time.
For instance, occupancy rates, rental income, maintenance costs, how many lease renewals they got, how many work orders were filed, and monthly financial reports are all examples of things explained through descriptive analytics. It’s the foundation for day-to-day reporting and keeping track of how you’re doing.
Diagnostic Analytics
Diagnostic analytics sets out to figure out why something happened. Descriptive analytics tells you occupancy dropped; diagnostic is where you go digging for the reason behind it. It’s the needle-in-a-haystack part – sifting through the data to find the one or two factors actually driving the change.
For example, a property manager might ask “why did occupancy go down?” or “why did maintenance costs jump?” or “where did we end up overspending on operating expenses?” By drilling into the numbers and looking for patterns across properties, time periods, and cost categories, managers can trace a problem back to its root cause.
Predictive Analytics
Predictive analytics tries to tell you what is going to happen next by taking historical data, statistical models, and machine learning algorithms and running them through a computer.
In the world of property management, predictive analytics can be used to forecast occupancy, predict when equipment is likely to break, figure out how much maintenance is going to cost in the future, or even predict rental demand based on market trends and historical performance.
Prescriptive Analytics
Prescriptive analytics takes it a step further and tells you what you should do. It uses all the data it’s got, as well as some business rules to give you a plan for how to run your property.
For example, it might recommend that you raise the rent, or that you schedule some preventative maintenance on certain equipment, or that you should focus on specific properties that need some extra love and care.
Property management data analytics has a hand in just about every part of running a property – from setting the right rents and keeping units filled to reining in maintenance costs and staying on top of the finances. Below are some of the most common use cases, along with examples of the Power BI dashboards we’ve built to help property managers turn everyday operational data into decisions they can actually act on.
Pricing rentals can make all the difference in how quickly you fill units, how much cash you bring in each month, and just how profitable your real estate portfolio ends up being. If you set rents too high you’re just begging for the phone to stop ringing, and underpricing your properties? Forget about raking in the long-term revenue.
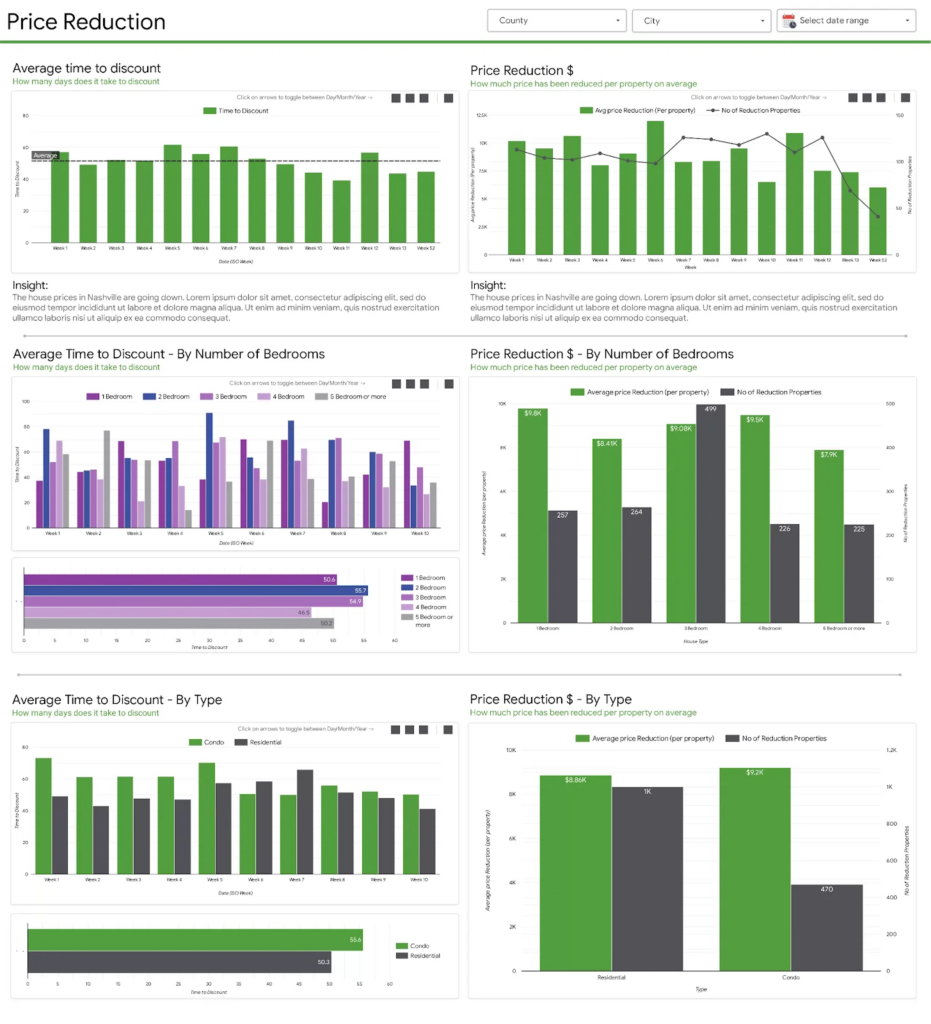
Property managers can breathe a little easier thanks to data analytics – it lets them keep a close eye on what’s happening in the market and adjust those rental prices based on facts rather than just making wild guesses. I mean, take the pricing analytics dashboard that our business intelligence consultants built for a client. This thing puts together a whole picture of the market: it tracks all the listings that get reduced, how long it takes to get the first price cut, how big those cuts are on average, and which property types get slashed most often. Plus it gives users a way to spot the areas where your pricing strategy is just not cutting it and needs to be overhauled.
With these insights on hand, property managers can finally see just how their pricing stacks up against the rest of the market, find the overpriced properties and get them back in line, and respond a heck of a lot faster when demand starts to shift. And the end result? Vacancy periods get chopped way back, occupancy goes up, and you can rake in that rental income without losing your shirt to keep up with the competition.
Occupancy and vacancy rates have a huge impact on a rental property’s income and how the portfolio performs overall. To make good calls on pricing and marketing, you need a clear read on your local rental market – how much competing supply is out there, how strong demand is, and how quickly units are actually getting leased. That’s where property management data analytics comes in: it helps you keep units from sitting empty longer than they should.
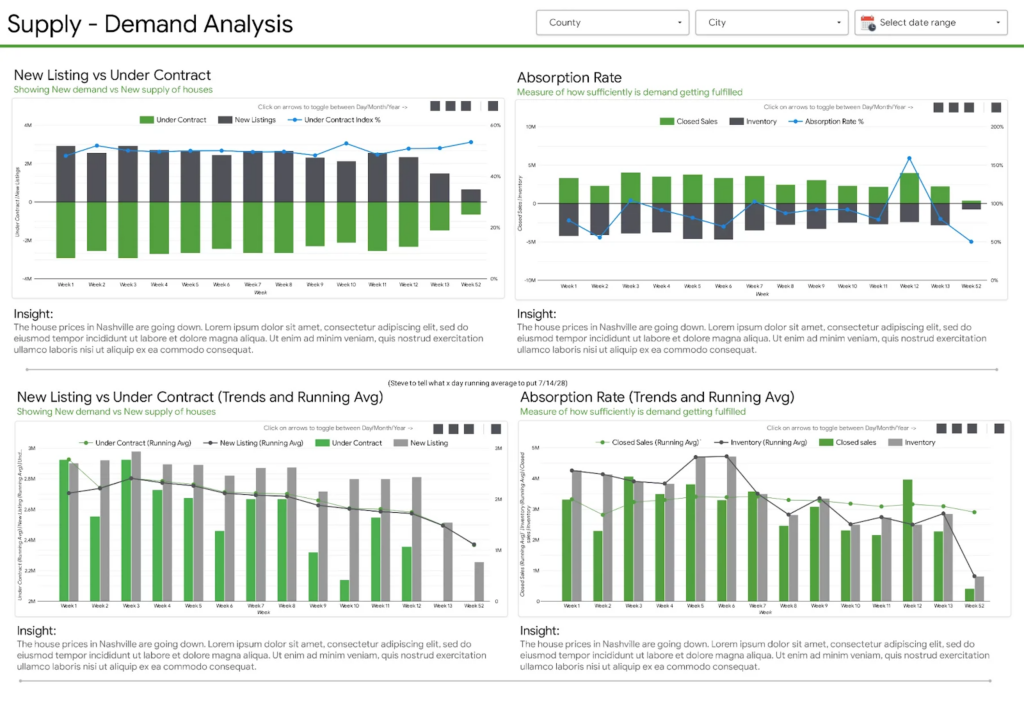
Our team of Power BI consultants built a dashboard that tracks supply and demand across different areas. It keeps an eye on how many units are coming onto the market each month, how many have already been taken, and how many are still available. It also calculates the absorption rate – essentially how quickly available units get leased in a given area – so you can gauge how healthy local demand is and whether there’s room to push rents up or a need to sharpen your pricing.
With this analysis you can compare how different areas are performing and spot where demand is heating up or cooling off. All of it feeds into smarter decisions about pricing, marketing spend, and where to focus your leasing effort. The payoff is fewer units sitting vacant and steadier occupancy across the portfolio.
Turning leads into signed leases is only half the battle in keeping properties filled – the other half is knowing which lead sources actually deliver results, rather than just generating a bunch of tyre kickers. The bottom line is that when it comes to property management, you need to know which channels are worth the investment and which are just a waste of time. That’s where data analytics comes in – it can show you which channels are paying their way and which are just making a racket.
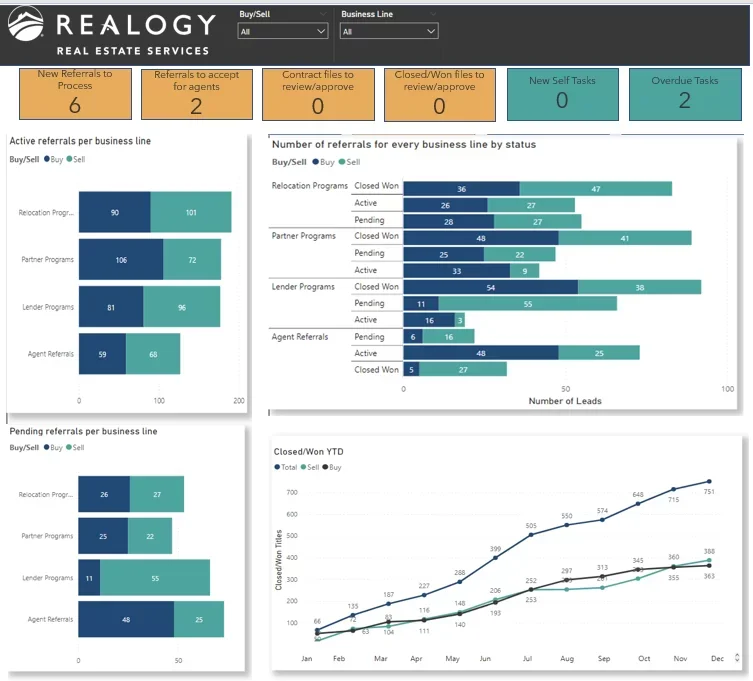
Our team put together an analytics dashboard that’s got all the details on active, pending and won deals for each lead source, so you can get a quick idea of which channels are churning out lots of leads and which are actually delivering closed deals. Forget about judging a source on lead volume alone – you can now compare the real quality of each one. You can see which channels are consistently moving deals through the pipeline and which ones tend to stall early on.
This helps property managers budget where it really matters by backing the sources that deliver results and cutting back on the ones that don’t. And the result? A better return on investment, a more predictable pipeline of deals and fewer units sitting empty.
Running a successful leasing team is about more than just counting how many deals get closed – you need to be tracking how each individual agent is actually doing their job. What you really want to be looking at – and actually use to get control of the process – is how each agent is handling their referrals, their to-do list and their overall workload.
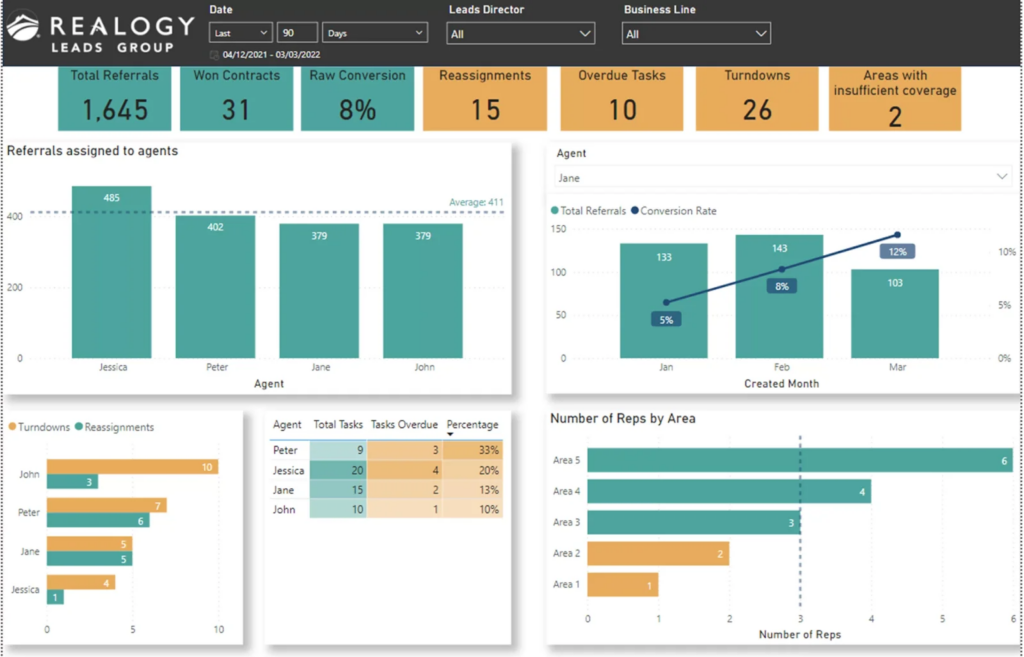
Working with our team of data visualization consultants, this client got a custom dashboard that pulls all their agent activity straight out of Salesforce into one easy to read view – total referrals they’ve received, conversion rates, completed tasks and how much each agent has on their plate. And it’s also tracking how referrals are moving through the pipeline which makes it dead easy to spot the bottlenecks: referrals waiting to be assigned, follow-ups falling through the cracks and workloads getting unevenly spread across the team. Some leasing teams are also reducing this follow-up burden by deploying conversational AI in real estate to handle first-contact enquiries automatically before they ever reach an agent.
All this analysis makes a big difference in spreading referrals evenly, getting the team to follow procedure and coaching each agent on what the numbers actually say rather than just making an educated guess. Keep an eye on productivity and conversion and you end up with a much smoother leasing operation, stronger conversions and more predictable results across the whole team.
Keeping a tight lid on operating expenses is crucial if you want to keep your rental properties profitable. Property management data analytics gives the people in charge a clear picture of how much they’re raking in from rentals, what it costs them to keep the properties running, and the profit margins on each one. That’s a powerful tool for spotting where costs are creeping up – and acting on it before things start to go downhill for the bottom line.
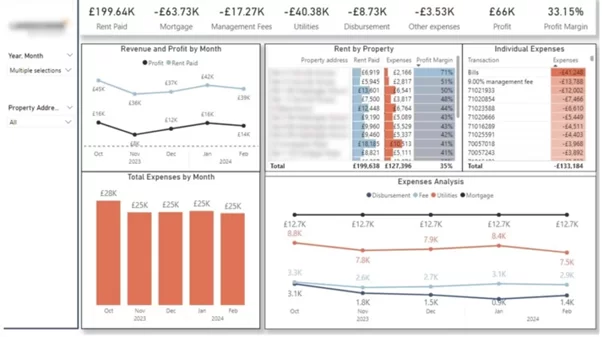
Our team has been working with a residential property management company with a portfolio of 30 properties – and the dashboard they helped them build really does all the hard work for them. It breaks down the numbers month by month; shows them the profit margins on each property; and breaks down the operating expenses, so they can see at a glance what they’re spending on mortgage payments, utilities, management fees and all the rest. Plus, it’s got interactive filters so the users can drill down and see individual property data and compare their performance across the whole portfolio.
This kind of analysis makes it a lot easier for property managers to spot the properties that aren’t pulling their weight, figure out where unexpected expenses are coming from, and see how their properties stack up against each other in terms of profitability. The insights you get from it also help with budgeting – do it more effectively, cut costs where you need to, and make sure resources are being thrown at the properties that will give you the best return.
Financial planning involves more than just taking a monthly glance at those profit and loss statements. Good property management data analytics lets managers keep tabs on revenue, operating expenses, Net Operating Income (NOI) and profitability in the moment – hence they can pick up on financial trends as they develop and make some much more informed budgeting decisions.
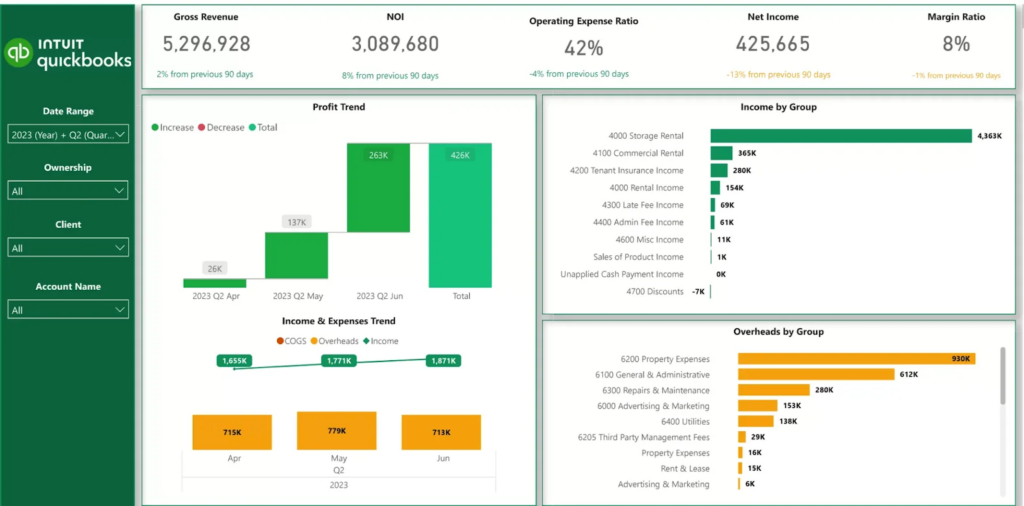
Our data analysts put together a financial performance dashboard to give a complete view of how a property portfolio is performing financially. It looks at the key metrics like gross revenue, NOI, net income, operating expense ratio, and profit margin, breaking down income and expenses into things like rental income, property expenses, repairs & maintenance costs, utilities, and management fees – all the sorts of things that add up to the bottom line. And by visualising trends over time, our users can get a feel for how profitability is changing, and what’s driving those changes.
This is all the information that property managers need to keep a close eye on financial performance, spot where operating costs are on the rise, and forecast future profitability with a whole lot more confidence. When you know which income streams and expense categories have the biggest impact on your margins, you can do a better job of budgeting, allocate your resources in a more effective way, and work towards your long term investment plans.
Equipment breakdowns come out of the blue and can knock a big hole in your budget, shut down operations and generally leave tenants feeling pretty disappointed. Property management data analysis helps organisations keep tabs on their equipment health, track down persistent maintenance headaches, and spot potential failures before they become a problem. Doing it this way allows maintenance teams to make sure they’re doing the right servicing at the right time, sort out emergencies in a jiffy, and keep their most important gear running for a long time.
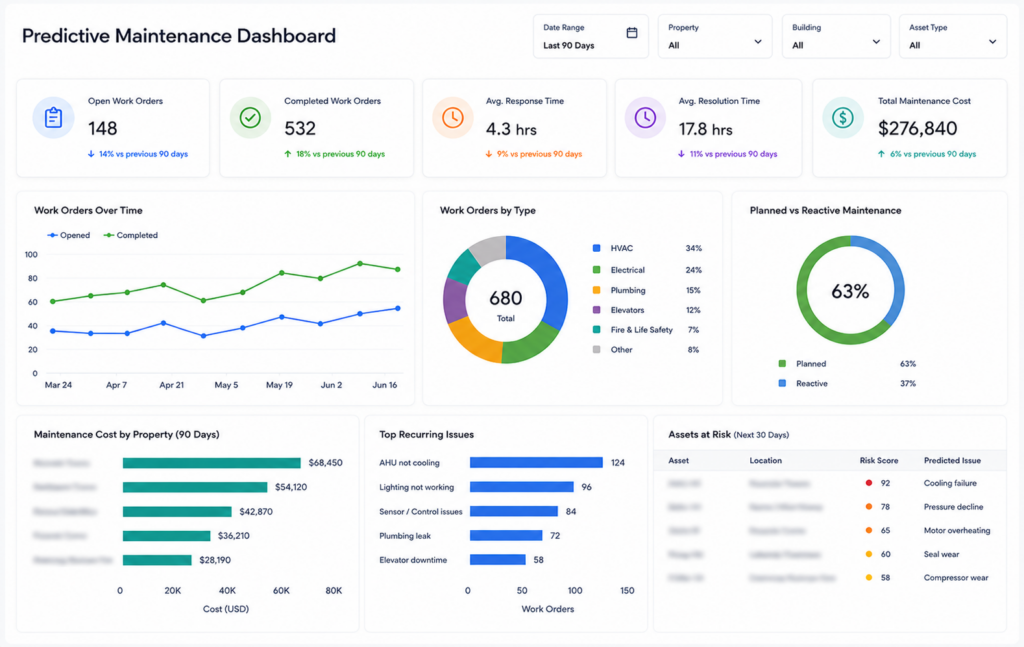
Our Business Intelligence team built the dashboard below to give property managers a real handle on how their maintenance is performing across the whole portfolio. It keeps track of open and finished work orders, how long it takes the maintenance team to get to a problem and then sort it out, the total maintenance costs, and trends in work orders over the months. The dashboard also digs into maintenance activity by equipment type, compares planned maintenance to emergency repairs, highlights maintenance costs by individual property, flags up any recurring problems and works out which gear is at risk of failure using risk scores and an idea of the maintenance it’ll need.
Thanks to this analysis, the client was able to identify the high-risk gear before it failed, make sure they were doing the right maintenance at the right time, and allocate their maintenance team more sensibly across the whole portfolio. By cutting back on emergency repairs, sorting out problems a bit earlier and generally doing a better job of planning maintenance, the client was able to bring down their long term maintenance costs, get more out of their equipment and generally give tenants a better experience.
Late rent payments can really hit a business where it hurts when it comes to cash flow, especially when you’re juggling a huge portfolio of properties. Property management data analysis lets you keep an eye on how your rent is being collected, find out who’s behind on their payments, and take a closer look at what’s causing any trends you see in payments across different properties, tenants, and time periods.
Reporting on rent collection rates, outstanding balances, overdue invoices, and how long it takes to actually get paid – as well as delinquency rates by property – is pretty standard. By regularly checking over these numbers, you can spot any problems earlier, figure out where to focus your collection efforts, and get a much better sense of just how much outstanding rent is affecting overall performance for your portfolio.
It’s generally cheaper to keep hold of the tenants you’ve already got than to go out and find new ones. Property management data analysis lets you keep an eye on how well you’re doing on tenant retention, work out what is making lease renewals happen (or not) and figure out why tenants are choosing to leave in the first place.
Property managers often look at tenant retention rates, turnover, how much maintenance has been needed, how satisfied the tenants are and how occupancy is going for the whole portfolio in order to pick up on any patterns that might be emerging. These reports help you work out whether your retention strategies are doing the job, or whether things are changing over time, and which properties might need some extra attention.
Lease renewals are crucial for keeping the place occupied and getting a steady income from rent. Property management data analysis gives you a clear view of when leases are up for renewal, what kind of renewals you’ve got happening and how your leasing activity is looking overall – which makes it a lot easier to plan for renewals.
Reports often track leases that are about to expire, how many of those renewals are actually happening, how long the average lease is for, and how well each property (or region) is doing on renewals. Keeping an eye on these metrics lets you predict when you might have some vacancies coming up, and make sure you’re getting the word out to tenants on time – as well as measure just how good your renewal strategy really is.
Property management companies monitor a wide range of KPIs to measure operational efficiency, financial performance, leasing activity, and tenant satisfaction. While the exact metrics vary by organisation, the following KPIs are among the most commonly used to evaluate individual properties and entire portfolios.
| KPI | Description |
|---|---|
| Occupancy Rate | Percentage of occupied units. |
| Vacancy Rate | Percentage of vacant units. |
| Days Vacant | Average number of days a unit remains vacant before being leased. |
| KPI | Description |
|---|---|
| Rental Income | Total rental revenue generated. |
| Rent Collection Rate | Percentage of rent collected on time. |
| Rent Arrears | Total outstanding rent owed by tenants. |
| Net Operating Income (NOI) | Income remaining after operating expenses. |
| Operating Expense Ratio | Operating expenses as a percentage of revenue. |
| Profit Margin | Overall profitability of a property or portfolio. |
| KPI | Description |
|---|---|
| Lease Renewal Rate | Percentage of tenants renewing their leases. |
| Lead-to-Lease Conversion Rate | Percentage of enquiries converted into signed leases. |
| Average Lease-Up Time | Average time required to fill a vacant unit. |
| KPI | Description |
|---|---|
| Open Work Orders | Number of unresolved maintenance requests. |
| Completed Work Orders | Number of completed maintenance requests. |
| Average Response Time | Average time taken to respond to maintenance requests. |
| Average Resolution Time | Average time required to complete work orders. |
| Planned vs Reactive Maintenance | Ratio of scheduled maintenance to emergency repairs. |
| Maintenance Cost per Property | Total maintenance spend for each property. |
| KPI | Description |
|---|---|
| Tenant Retention Rate | Percentage of tenants who renew or remain after lease expiry. |
| Tenant Satisfaction Score | Tenant feedback collected through surveys or reviews. |
Having all these KPIs on hand helps property managers keep an eye on things and spot any changes that might need looking into in more detail. Many companies display all these numbers in snazzy dashboards that let managers drill down and look at how things are doing by property, region or even just reporting period.
Property management data analytics really helps organisations stay on top of how their portfolios are performing, make better sense of operational and financial data, and generally just do a much better job of reporting. The benefits we’ve seen from our clients after they’ve implemented our business intelligence and reporting solutions are pretty darn impressive.
Getting a Clearer Picture of Your Finances
Property management analytics brings all sorts of financial info together from different systems, making it way easier to keep an eye on revenue, expenses, cash flow and profitability across the board. You can finally start to get to the bottom of why your financial performance is doing what it’s doing, without having to manually trawl through a million different reports.
One of our real estate investment clients found that the dashboard we set up helped them really understand what was driving the ups and downs in their monthly revenue and profits. They even used the reports to spot some unexpected expenses from their property management company – and were able to save a pretty penny in the long run.
Reporting That’s Actually Useful
Let’s be real, manually pulling together property management reporting from different systems can be a real time-suck. Automated dashboards save the day by keeping reports up to date and making sure you don’t have to spend all your time stuck in a sea of spreadsheets.
One of our clients actually saw a 40% boost in reporting accuracy, and even better – they saved 50 hours a week that they used to waste on manually preparing reports.
Decisions Made With Confidence
When you’ve got a steady flow of good information coming in from across your portfolio, it becomes way easier to evaluate performance and keep an eye on the key metrics that really matter. This means you can finally stop relying on clunky, manually-prepared reports, and have way more faith in the info you’re using.
One of our clients was able to get their management team to start monitoring key business metrics every single day, thanks to automated reporting. And the real estate dashboards we built for them helped them get a handle on their 21-property portfolio’s performance – wow.
No More Slaving Away Over Reports
By automating the data collection and reporting process, you and your team can finally break free from all those tedious, repetitive, administrative tasks and start to get on with doing the things that matter – like actually analysing the results.
One of our clients was able to implement Power BI dashboards and automated reporting, and they finally broke free from the drudgery of manually preparing quarterly lead reports.
A property management analyst digs into data related to how properties are running and making money – and then presents the results in reports that help property managers, asset managers and top executives see where things are going well or need some work. They basically help these folks understand how their properties and collections of properties are doing – and it’s up to the analyst to figure out what metrics to track, what numbers to keep an eye on, and what trends to look out for.
The specifics of the job can vary pretty widely depending on the company, but it often involves things like crunching numbers to see how full the buildings are, how much rent is coming in, how much it costs to keep things running, and so on. They often also spend their time unpicking why things are changing – if occupancy rates are up, but revenue isn’t following suit, for example – and putting together management reports that help property bosses know what’s going on.
In doing all this, a property management analyst will usually be working with all sorts of systems – the property management software, accounting systems, CRM tools, and business intelligence platforms like Microsoft Power BI, Microsoft’s Fabric, Tableau, and Qlik. These tools let them yoke together data from all these different places and spit out reports that are exactly what whoever’s asking for needs to see.
Property management analytics is all about using software to make sense of business data. In most organisations, it’s a combination of different property management systems, accounting software and business intelligence platforms that help keep an eye on how the business is doing and enables them to produce useful reports.
Property Management Software – The Essentials
Property management systems keep track of all the day-to-day stuff like tenant info, lease agreements, who’s in the building and who’s paying their rent. Some of the most well-known platforms are Yardi and AppFolio but there’s also Buildium, MRI Software, Entrata and RealPage worth considering.
Accounting and Financial Systems – Running the Numbers
Accurate financial reporting is all about combining data from accounting platforms, so you can look at how much rental income is coming in, what you’re spending and what the budget looks like. You might be using QuickBooks, Xero, Sage, even Microsoft Dynamics 365 Business Central or NetSuite to keep track of it all.
Business Intelligence Platforms for Property Management – Making Sense of It All
Property management business intelligence platforms are pretty powerful tools that let you bring data from multiple business systems together into reports that are easy to read and work with. That means you can look at operational and financial performance in one place without having to keep switching between different apps. And the likes of Microsoft Power BI & Tableau are amongst the most popular of those.
If your data is scattered across loads of different systems you’ll also need to get some data connectors that allow you to move all that information into your reporting platform. We’ve developed a set of Power BI data connectors that can link up your accounting software, CRM, marketing platforms and other business apps – so you can automate data refreshes, and ditch the hassle of running manual imports.
Data Storage and Integration – Keeping It All in One Place
Lots of organisations also use cloud databases, data warehouses and integration tools to make it easier to collect data and keep reports up to date. And if you’re using Microsoft SQL Server, Azure SQL, Snowflake, Azure Data Factory or Power Automate then your data is probably already being kept consolidated and up to date.
Implementing these data pipelines often requires specialist expertise. Our data engineers design and maintain the infrastructure that connects business systems, automates data flows, and prepares data for reporting in platforms such as Power BI and Microsoft Fabric.
Multifamily analytics is a complex beast – managing multiple apartments within one building or across a whole bunch of communities. But because these big portfolios are generating a ton of data on leasing, maintenance, finances and tenants, making sense of it all is crucial to keeping track of how each property is doing and the whole portfolio too.
Multifamily property managers rely pretty heavily on data to keep tabs on things like occupancy rates, lease renewals, rent collections, how long it takes to get maintenance done and how much it costs to keep everything up and running – and of course net operating income. A lot of organisations even keep a close eye on how happy their residents are, how well they retain tenants and how often those fancy amenities get used – all part of getting a good sense of how their communities are really doing.
Interactive dashboards let managers look at how different properties are performing, figure out which ones are underperforming and get a bird’s eye view of the whole portfolio’s key numbers – all from one place. By looking at the big picture across multiple locations, property management companies can make sure their reporting is more consistent and make better decisions on how to run their operations and finances.
Property management companies aren’t just relying on their own system data anymore. Many of them are now combining their internal property data with outside sources like the local housing market, demographic trends, interest rates, economic indicators, weather data, utility bills, and data from IoT sensors. By looking at all these datasets at once – you get a better understanding of what’s really going on and the factors that are driving property performance.
Take a property manager for example, they can look at how their occupancy rates stack up against what’s happening in the local rental market, see how seasonal demand is affecting leasing, or figure out how energy prices are eating away at their operating costs. You can also look at smart building data alongside maintenance records to spot equipment that needs some TLC before it breaks down.
Thanks to modern cloud data platforms, it’s now possible to process huge numbers of records from all those different systems and get the dashboards updated on the fly. So, instead of trying to crunch the numbers for each property one by one, organisations can now keep an eye on the whole portfolio, compare performance between regions, and pick up on trends that would be impossible to spot from the data that’s already in house.
Getting started with property management data analytics starts with figuring out what information you actually need to get from your data. Do you want to keep an eye on occupancy levels? Track your operating expenses? Boost lease performance? Take a close look at maintenance work being done? Or maybe you just want to get a handle on how well your portfolio is doing financially? Whatever it is, defining exactly what you need to know will make it loads easier to figure out what kind of data, KPIs and reporting dashboards your business needs.
Then there’s the bit where you need to bring all your different bits of property management software, accounting systems, leasing platforms and other business apps together in one place. The right analytics platform makes this a breeze – you can automate your reporting, keep tabs on how your portfolio is doing in real time, and make sure all the right teams have access to the info they need.
Got plans to bring in property management data analytics, or maybe you want some custom Power BI dashboards? Give us a shout! We’ll work with you to create a reporting solution that ties together all the data you need, and gets the insights to your team that will help them do their job even better.


