
HubSpot quietly captures a huge amount of information about your business. Every new contact, form submission, email open, deal stage change, call log, and closed sale is recorded somewhere in your account. The built-in reports give you a decent starting point, but they tend to stop just short of the full story, and pulling that data out into a proper reporting tool is where most teams hit a wall.
That is why so many businesses want to connect HubSpot to Power BI. Once your CRM and marketing data lands in Power BI, you can shape it around the questions your team actually asks, blend it with data from other systems, and build dashboards that refresh on their own.
At Vidi Corp, our Power BI Consultants build dashboards and data connectors for teams that need automated reporting from CRM, finance, marketing, and operational systems.
This guide walks you through why the connection matters, what usually makes it difficult, and the simplest way to get your HubSpot data into Power BI using our connector.
HubSpot gives you useful native reports, especially for sales activity and campaign performance. However, native dashboards are built around HubSpot’s reporting structure. That can become limiting when you need custom calculations, advanced visuals, historical pipeline tracking, or reporting that combines HubSpot with finance, advertising, product, or customer data.
Power BI gives you more control over how your CRM data is modelled, filtered, visualised, and shared. You can build dashboards around your business questions instead of working around the limits of a fixed report layout.
For example, a HubSpot Power BI dashboard can help answer questions such as:
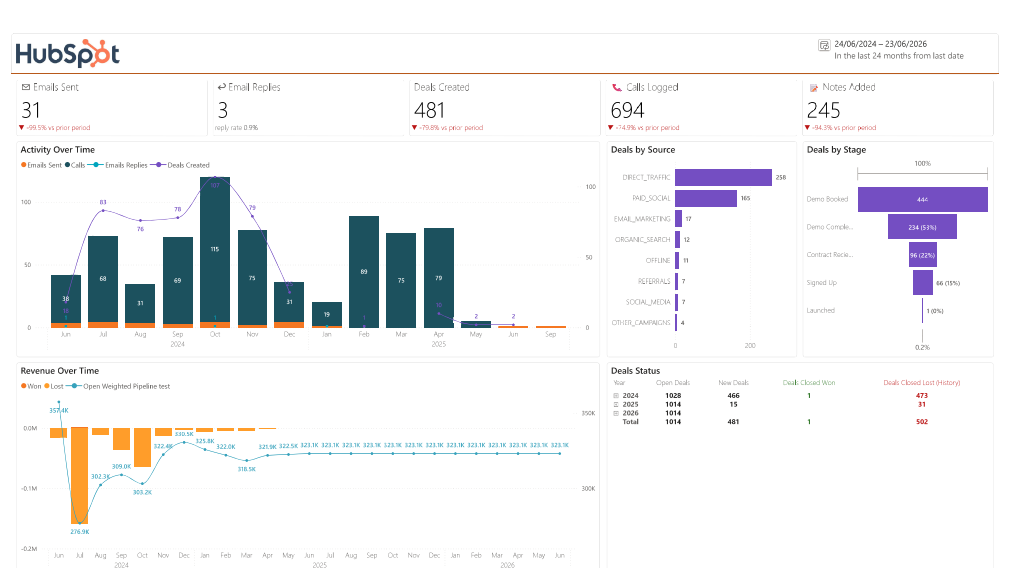
Vidi Corp’s HubSpot dashboard template focuses on these types of questions. It includes reporting for sales activity, email performance, call activity, pipeline velocity, and current pipeline status.
The most reliable way to connect HubSpot to Power BI is to avoid pulling live CRM data directly into a report model. Instead, HubSpot data should first be extracted into a structured cloud database. Power BI can then connect to that database using a stable native connector.
The connector extracts data from the HubSpot API and stores it in an Azure SQL Server database. Power BI then connects to Azure SQL using its native connector. This gives teams a more reliable setup for larger datasets, historical records, scheduled refreshes, and advanced security controls.
The flow is simple:
HubSpot → Vidi Corp Connector → Azure SQL Server → Power BI
This setup is especially useful for teams that need repeatable reporting. Once the connector is installed and the data model is loaded, users do not need to keep exporting CSV files from HubSpot or manually refreshing spreadsheets.
The Vidi Corp connector is a no-code solution. It is built for teams that want to connect HubSpot to Power BI without developing custom API scripts or maintaining their own data pipeline.
The connector creates the required database tables, authenticates with HubSpot, loads historical records, and refreshes the data automatically. Once the data is available in Azure SQL, Power BI can load it into a dashboard template or a custom report.
The connector currently provides structured HubSpot tables such as:
Additional customisations can be requested if your reporting needs go beyond the standard model.
This structure is important because HubSpot data is not always simple to analyse in its raw API format. CRM objects are linked through relationships, activities are logged across different entities, and useful sales metrics often require historical tracking. A clean data model reduces the time needed to prepare the report and makes the dashboard easier to maintain.
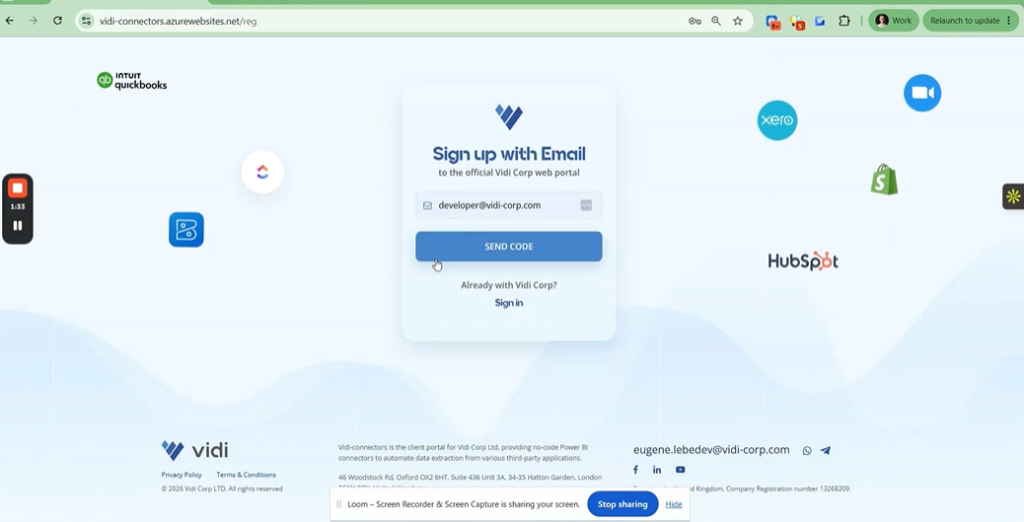
The first step is to open the Vidi Corp connector portal, register and find the HubSpot connector. From there, you select “Install”.
During installation, the connector creates the required database tables in your selected cloud database. These tables are prepared in the right structure so your HubSpot data can be loaded into them.
This removes a major technical step from the process. Instead of designing the SQL schema manually, the connector prepares the storage layer for you.
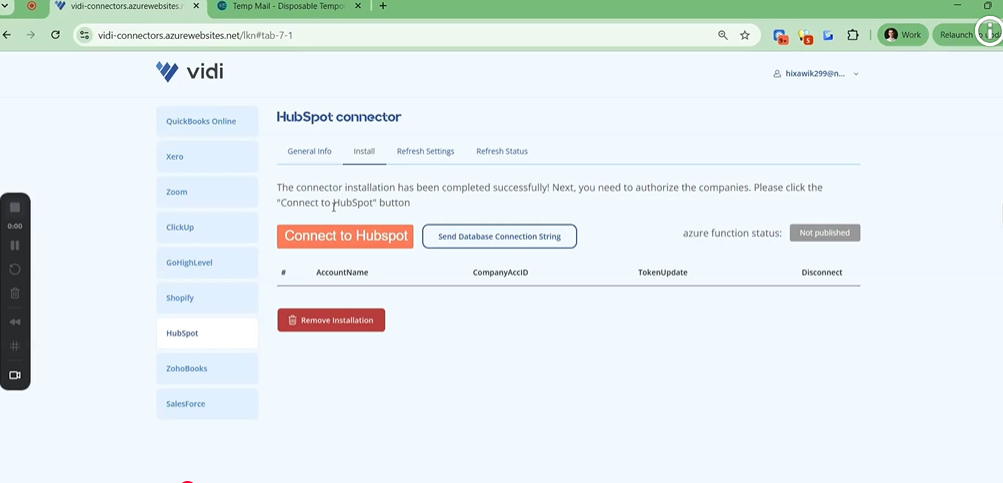
After installation, you log in to your HubSpot account and select the company or companies you want to connect.
This is useful for agencies, multi-brand businesses, or groups that manage more than one HubSpot account. Vidi Corp’s connector pricing includes an unlimited number of HubSpot accounts, which makes it easier to scale reporting across multiple entities.
Once HubSpot is authenticated, the connector can begin extracting your CRM data into Azure SQL.
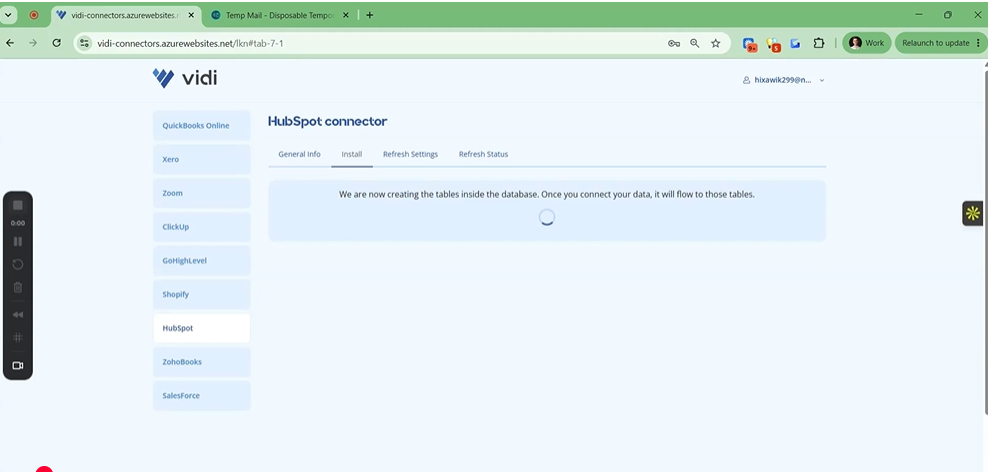
The first refresh can take longer because the connector needs to load historical HubSpot data. Vidi Corp notes that the initial database refresh may take a few hours, especially when the HubSpot instance contains several years of activity. Future refreshes are much faster and usually complete in a few minutes.
The emails table can take longer than other tables because it may include full email body text. That creates a larger volume of data to extract and store.
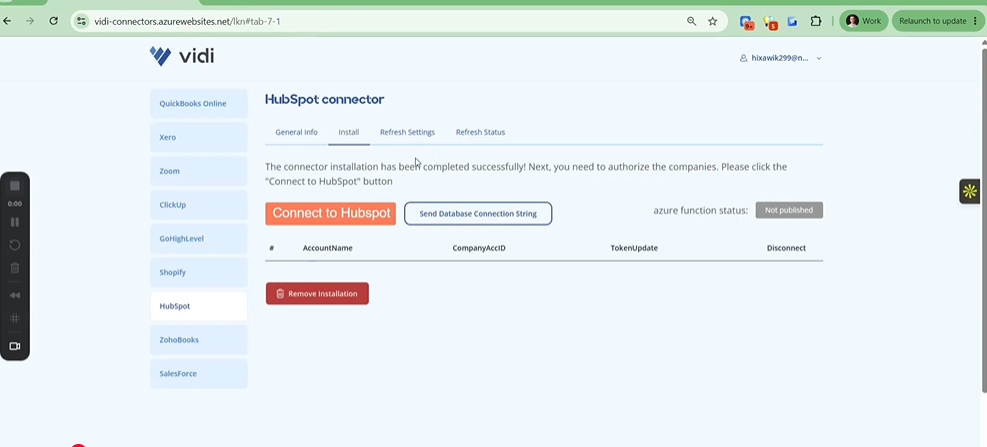
You can monitor the process inside the Refresh Status tab. This helps confirm whether the data load is still running, completed, or needs attention.
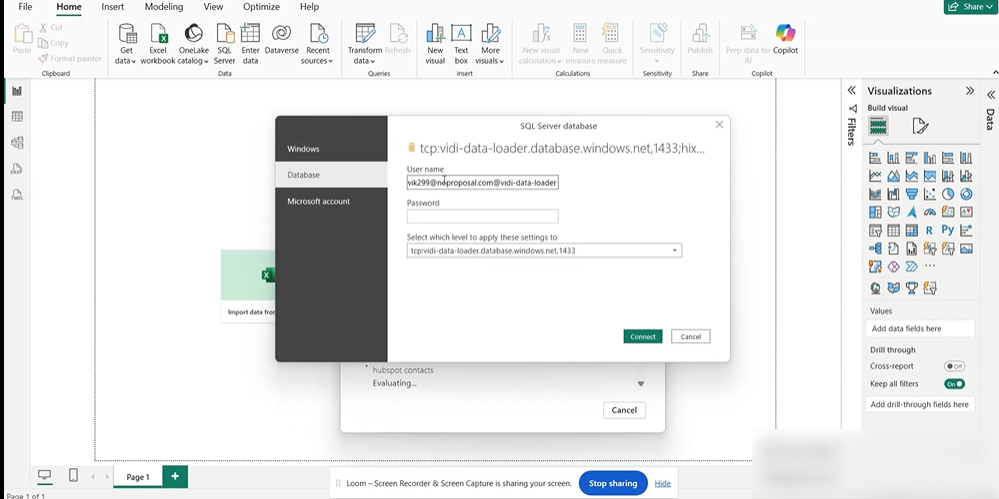
Once the connector has loaded your data, Power BI connects to the Azure SQL database.
To connect the Power BI template, you enter:
These details come from the connection string provided by the connector. When signing in, you use database credentials rather than Windows authentication. After that, Power BI loads the HubSpot model into the report.
This approach is more stable than repeatedly downloading HubSpot exports. It also gives your team a proper reporting database that can support more dashboards later.
Vidi Corp provides a free HubSpot Power BI template when you connect your data using the connector. The template gives you a working report layout that you can start using quickly, then modify in Power BI if needed.
This is useful because most teams do not want to start from a blank report. They need a first version that already includes common sales and CRM analytics.
The template is designed to help answer practical questions around sales activity, emails, calls, pipeline movement, and current open deals.
Once HubSpot is connected to Power BI, you can move beyond static CRM reporting. You can create interactive dashboards that show trends, segments, conversion rates, and bottlenecks across the sales process.
The overview page gives a high-level summary of activity across your sales team.
It can show emails sent through sequences, replies received, deals created, calls made, and notes logged by sales reps. These metrics can be reviewed month by month or drilled down into daily performance for weekly sales meetings.
This helps managers understand whether activity levels are healthy and whether activity is turning into pipeline.
The same dashboard can also show deals by source, pipeline progression, and pipeline value over time. If the weighted pipeline drops, managers can quickly see whether the drop came from lost deals, stalled deals, or stage changes.
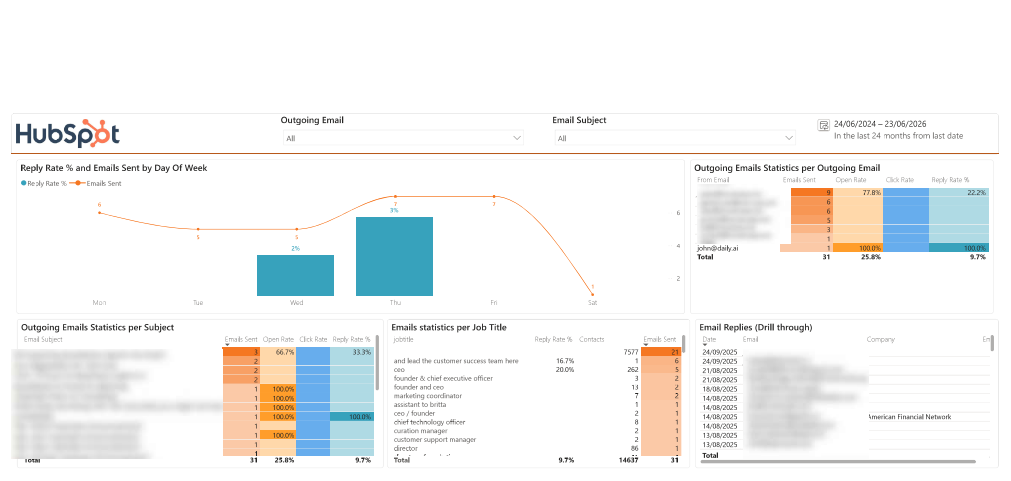
Email reporting is one of the most useful parts of a HubSpot Power BI dashboard.
The Vidi Corp template helps compare email volume with reply rate by day. This makes it easier to identify which days produce stronger responses and adjust sales sequences accordingly.
The dashboard can also analyse subject lines, open rates, user activity, and reply rates. This shows which sales reps are doing the most outreach and which reps are getting the strongest response from that outreach.
Another useful view is email performance by job title. If certain job titles reply more often, the sales team can prioritise those roles in prospecting and outbound campaigns.
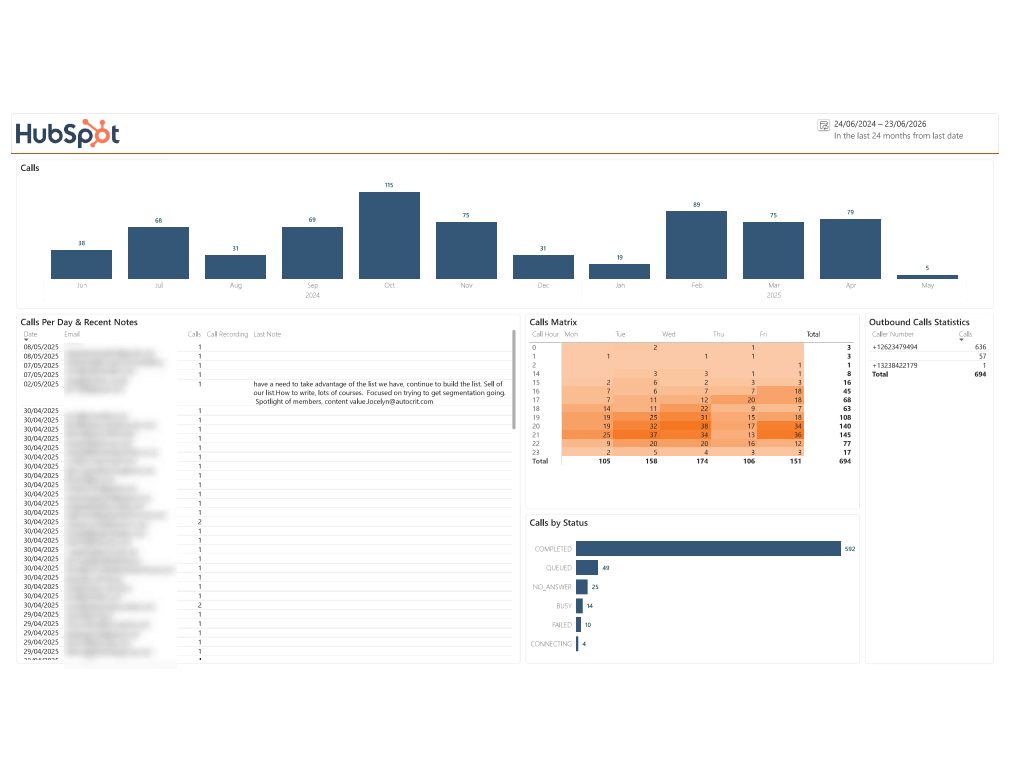
Call reporting helps sales leaders assess call quality, not just call volume.
The dashboard can show how many calls each rep makes, which contacts receive calls, what comments reps leave after calls, and whether the call actually connects.
This distinction matters. A high number of calls does not always mean productive outreach. If reps make many calls but rarely connect, the team may need to review timing, targeting, or call strategy.
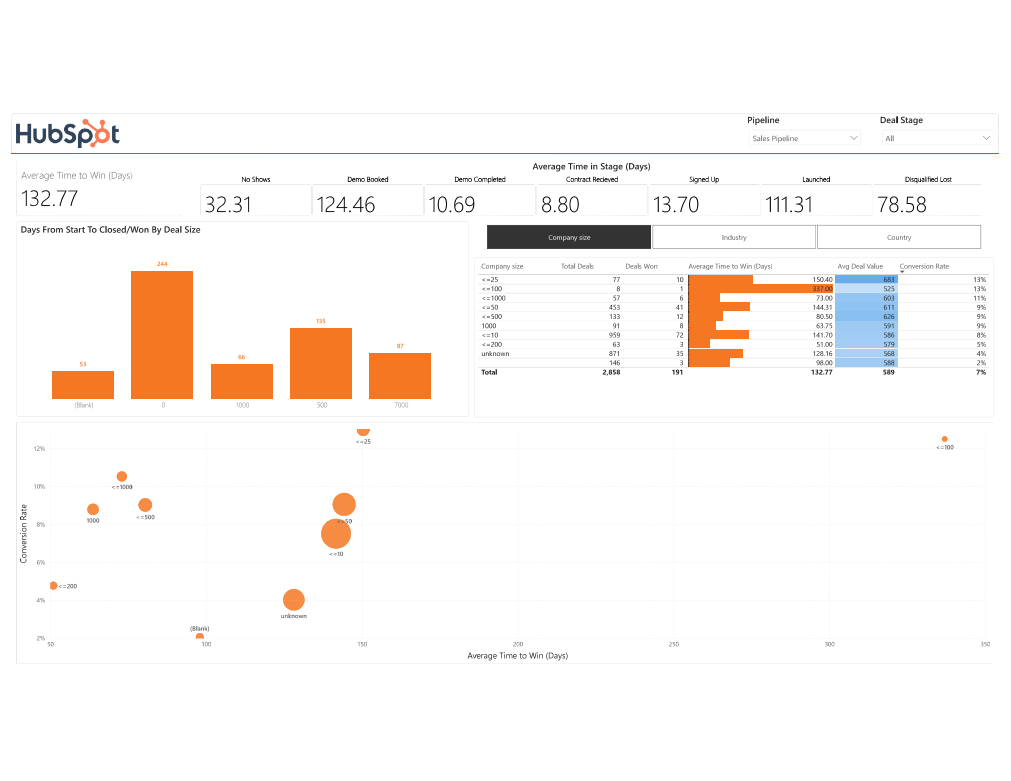
Pipeline velocity reporting helps answer one of the most important sales questions: how can we close deals faster?
The Vidi Corp HubSpot dashboard can show the average number of days from deal creation to close. It can also break that timeline down by stage, showing where deals spend the most time.
This helps managers find the parts of the sales process that create friction.
For example, if deals consistently sit too long in a proposal stage, the issue may be pricing, approval delays, weak follow-up, or unclear next steps. Power BI helps make that bottleneck visible.
The current pipeline dashboard gives sales managers a live view of active opportunities.
It can show deal counts by size, deals grouped by created date, won/open/lost status, current deal counts by stage, and individual deals with their amount and status.
This helps answer daily management questions. How full is the pipeline? Which stages are crowded? Which deals are still open? What is the current value of active opportunities?
The best HubSpot Power BI dashboards focus on decision-driving KPIs. Too many metrics can make the report harder to use.
For sales teams, useful KPIs include:
For marketing teams, useful KPIs include:
For leadership teams, useful KPIs include:
These metrics become more powerful when HubSpot data is combined with external data. For example, CAC requires ad spend, and LTV often requires finance or billing data. This is one reason Power BI is valuable: it allows HubSpot data to sit beside marketing, accounting, and operational data in one model.
Centralised CRM reporting means bringing HubSpot objects such as contacts, companies, deals, tickets, emails, and tasks into one structured dataset. This is achieved by extracting the data from HubSpot’s API, storing it in Azure SQL, and connecting Power BI to that database. The result is a single reporting layer that can support sales, marketing, and leadership dashboards.
This type of centralisation has delivered measurable results for Vidi Corp clients. War Room Operations hired Vidi Corp to set up an RDBMS, custom API scripts, and real-time analytics. The project reduced manual data consolidation tasks by 95%, reduced data silos from 6 systems to 1 centralised database, and increased data integrity across business units to 99.7%.
Faster reporting refreshes mean your team spends less time exporting HubSpot records and rebuilding reports manually. This is achieved by automating the data extraction process and loading HubSpot records into a cloud database that Power BI can refresh on a schedule.
Vidi Corp delivered a similar automated reporting setup for Mercy Corps, where procurement data from SAP Ariba was extracted automatically into an Azure SQL Server database and used to rebuild a Power BI report. The automation saved around 5 hours per month and allowed the report to be refreshed more often.
Better decision-making happens when teams can see sales and marketing performance in context. In practice, this means combining activity data, source data, pipeline data, and conversion metrics in a dashboard that updates automatically. Managers can then identify weak stages, stronger segments, and high-value channels faster.
A Vidi Corp client in digital marketing reported that automated dashboards across 80+ clients pulled data from Facebook Ads, Google Ads, SEMrush, forms, GA4, and other sources. The result was a 40% increase in reporting accuracy based on GA4 data and 50 hours per week saved on reporting.
Reliable support matters because CRM and BI integrations can involve authentication, permissions, API limits, refresh schedules, and data model changes. With a supported connector, users can resolve connection issues faster and keep reports running.
Angel Oak Accounting used Vidi Corp to connect QuickBooks Online to Power BI, automate data refreshes, and create starter dashboards. The project saved 4 hours per month and the client highlighted that Vidi Corp proactively helped resolve connection questions, with the connector “working perfectly.”
The biggest challenge is usually data structure. HubSpot stores CRM activity across many objects, and the relationships between contacts, deals, emails, calls, companies, and owners need to be modelled correctly.
Another challenge is historical tracking. Sales teams often want to know how the pipeline looked on a specific date, not just what it looks like today. That requires a data model that can preserve snapshots or track stage changes over time.
API limits can also create problems if the extraction process is not designed carefully. Large HubSpot accounts may contain years of emails, calls, deal changes, and engagement records. A connector needs to handle the first load properly and then refresh only what needs to be updated.
Finally, dashboard design can become too complex. HubSpot contains a lot of data, but not all of it belongs in an executive report. A good Power BI dashboard should focus on the questions your team uses to make decisions.
Start by defining the business questions before designing visuals.
For example, a sales leader may need to know which pipeline stage causes the most delay. A marketing leader may need to know which campaigns create qualified opportunities. A CEO may need to know whether the current pipeline can support the revenue target.
Next, keep each dashboard page focused. Sales activity, email performance, call activity, pipeline velocity, and current pipeline should usually be separate pages. This makes the report easier to scan and easier to use in meetings.
Use clear filters for date, owner, pipeline, deal stage, lead source, and company. These filters help users move from a high-level trend to the exact segment causing the change.
Finally, review the dashboard with actual users. Sales reps, managers, and executives read dashboards differently. A useful report should support all of them without overwhelming them.
The Vidi Corp connector is a strong fit when your team wants automated HubSpot reporting in Power BI without building its own API integration.
It is especially useful if:
The connector costs $1,200 per year and includes a 14-day free trial, unlimited HubSpot accounts, and unlimited customer support.
Connecting HubSpot to Power BI gives sales, marketing, and leadership teams a clearer view of CRM performance. Instead of relying only on native HubSpot dashboards, teams can build reports around their own pipeline, attribution, outreach, and revenue questions.
The Vidi Corp HubSpot Power BI Connector makes this process easier by extracting HubSpot data into Azure SQL and connecting Power BI to a structured reporting database. It also gives teams a ready-made Power BI template that can be customised as reporting needs grow.
The real value is not just moving HubSpot data into Power BI. It is creating a reporting system that refreshes automatically, supports deeper analysis, and helps teams make better decisions from the CRM data they already collect.
Ready to connect HubSpot to Power BI?
Use Vidi Corp’s HubSpot Power BI Connector to automate your CRM reporting, load your HubSpot data into Azure SQL, and start building Power BI dashboards from a clean reporting model.
Yes. Power BI can connect to HubSpot when HubSpot data is extracted into a supported database such as Azure SQL Server. Vidi Corp’s HubSpot Power BI Connector pulls HubSpot data through the API and makes it available for Power BI reporting.
The easiest way is to use Vidi Corp’s HubSpot Power BI Connector. It creates the database tables, connects to HubSpot, loads the data, and prepares it for Power BI.
Yes. Vidi Corp offers a HubSpot Power BI dashboard template with ready-made reporting pages for CRM and sales analytics.
The connector costs $1,200 per year and includes a 14-day free trial, unlimited HubSpot accounts, and unlimited support.


