

Anyone running reporting inside a pharmaceutical company knows how quickly the cracks show. Prescription data lands from your syndicated provider in its own format, field activity sits in the CRM and gross-to-net lives in a spreadsheet that only a couple of people in finance can safely touch. Over in operations, batch performance sits in the MES while quality records deviations somewhere else entirely, and clinical teams still update leadership on enrollment through decks stitched together by hand. So when a consolidated view finally reaches the executive team, the quarter is almost done and the numbers no longer reflect reality.
This is the exact problem pharmaceutical business intelligence was built to solve. It pulls the commercial, clinical, manufacturing and financial data scattered across your business into a single governed view people can trust and act on, whether that’s a brand manager working out where to point field effort or a quality director getting ready for an FDA inspection.
Our business intelligence consulting services cover these solutions for pharmaceutical firms, including data integration and dashboard development services
In this guide, you’ll learn what pharmaceutical business intelligence actually involves, where it delivers the most value, what a modern pharma BI architecture looks like and how to introduce it without disrupting a heavily regulated business.
Pharmaceutical business intelligence means bringing together data from every corner of a pharma organization, then cleaning, governing and analyzing it so that commercial, clinical, manufacturing and corporate teams base their decisions on accurate, up-to-date information instead of instinct or last quarter’s reports. The scope runs from prescription volumes and market share through to batch yields, trial enrollment and rebate liabilities, with everything surfaced through dashboards and reports built on one governed source of truth.
What sets pharma BI apart from BI in most other industries comes down to two things: the variety of data involved and the regulatory weight pressing down on it. A typical pharmaceutical company juggles syndicated prescription data from providers like IQVIA, its own CRM and field activity records, ERP and financial systems, manufacturing execution and quality systems, clinical trial platforms, and feeds from distributors or specialty pharmacies. None of these systems were built to talk to each other. Yet the questions worth the most to the business, like whether a promotional push actually moved prescriptions or whether a supply constraint is about to hit a specific market, can only be answered by connecting them.
In practice, a pharmaceutical business intelligence program can include:
Most pharma sales reporting still involves an analyst pulling syndicated data, matching it against CRM activity by hand and building a deck that is out of date before the next cycle meeting. A proper sales analytics layer integrates prescription data, call activity, sampling and targeting lists into dashboards that refresh automatically, so managers walk into every meeting with current numbers.
Reps see their own territory performance against goal, prescriber-level trends and where their effort is actually converting. National teams roll the same data up to region and franchise level without any reconciliation, because everyone is drawing from the same hierarchies. Measure the impact through share growth in targeted segments, call plan attainment and the analyst hours recovered from manual reporting.
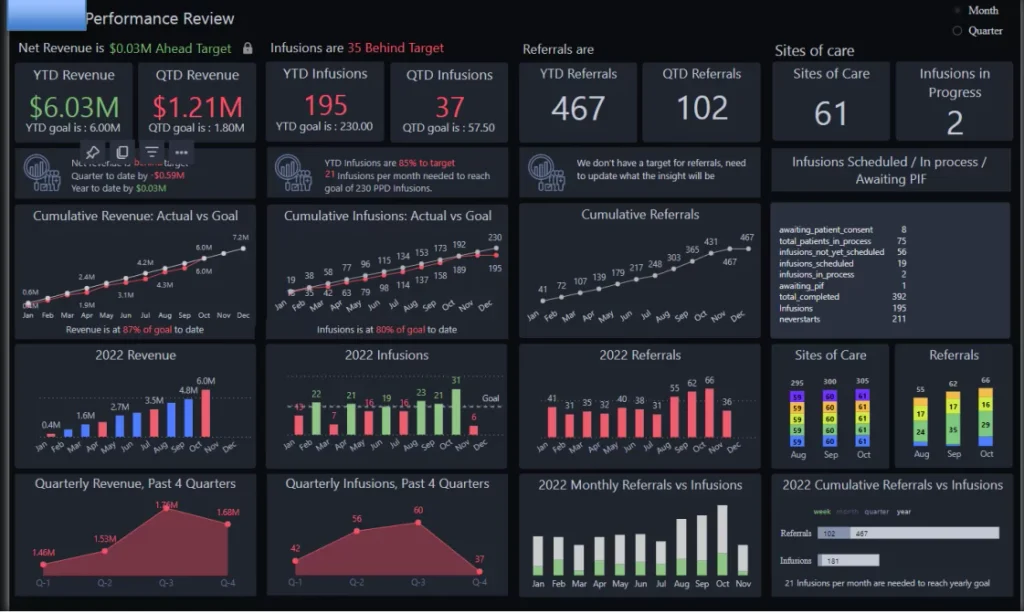
Our client was a biotech company that had recently rolled out a new drug on the US market, and they asked us to build a Power BI pharma dashboard that would let their leadership team track how the launch was actually performing.
A drug launch is exactly the situation where fragmented reporting hurts most. The first months after launch decide the trajectory of the product, yet the data that tells you whether things are on track comes from several places at once: revenue figures, infusion volumes, referral activity and the network of hospitals administering the treatment. Our job was to bring all of that into one place and make it readable at a glance.
We built a two-page Power BI report for a drug launch, starting with an executive overview page. Headline KPIs (YTD and QTD revenue, YTD infusions and total infusions) sit at the top, so decision-makers can gauge launch health in seconds. Line charts track infusions and referrals over time, revealing momentum or dips early, while departmental comparisons add context. A performance versus target section places actuals beside goals, showing instantly whether corrective action is needed. The second page digs deeper, with four columns covering revenue, infusions, referrals and sites of care, pairing high-level reads with monthly trends against targets, and any month that misses is flagged in red. See more in our business intelligence case studies.
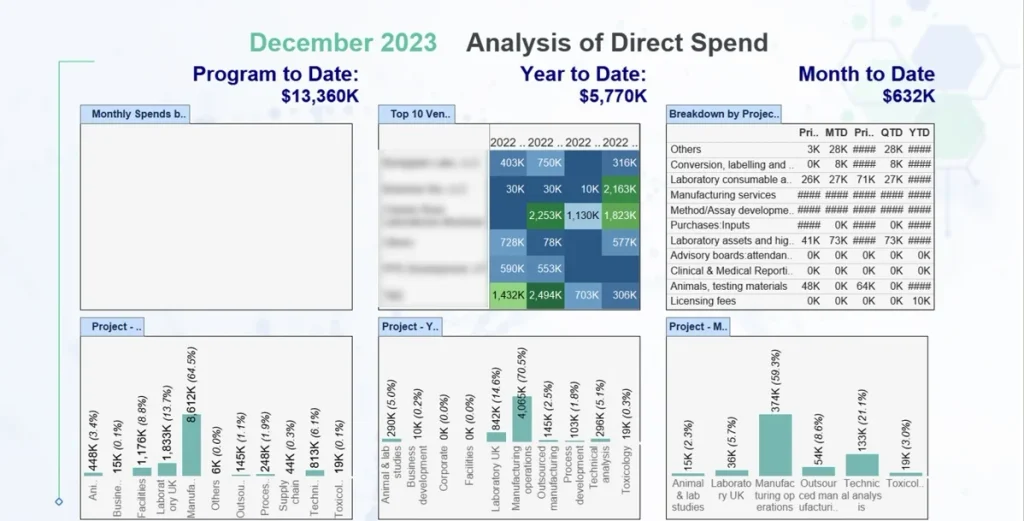
Pharmaceutical manufacturing generates dense operational data across MES, LIMS, ERP and quality management systems, but in most plants that data stays locked inside each system. Integrating it gives operations and quality leaders a live view of batch performance, yields, cycle times, deviations and CAPA aging across every site.
This OpEx dashboard was created by our Tableau consultants for a biotechnology firm specialising in drug manufacturing.
This dashboard tracks direct spend across the programme, with December 2023 showing $632K spent in the month, $5,770K year to date and $13,360K programme to date. The project breakdown charts show clearly where that money is going. Year to date, manufacturing operations dominates at $4,065K, roughly 70% of all spend, with Laboratory UK the next largest at $842K (14.6%) and all other categories in single digits. December follows a similar pattern, with manufacturing operations taking $374K (59.3%) of the month’s spend, though technical analysis rose to $133K (21.1%), a noticeably bigger share than its annual average.
Comparing the monthly and yearly views side by side lets stakeholders spot these shifts in spending mix early and query them before they become budget issues.
Building a proper BI capability takes real investment, so it is fair to ask what you get back. The benefits tend to arrive in a predictable order, starting with time savings and trust in the numbers, then moving into commercial and operational gains that only become possible once everyone is working from the same data. Some show up within the first few months, others take longer to mature, but each one builds on the last.
When commercial, financial and operational data flows through one governed platform, the arguments about whose spreadsheet is right disappear. Market share means the same thing to the brand team as it does to finance, and territory performance matches whether the national sales director or the CFO is presenting it. Business leaders stop debating the numbers and start acting on them, and questions that once took an analyst two weeks to answer get resolved the same day they are asked. That speed changes behavior too. When an answer costs an afternoon instead of a fortnight, people ask more questions, test more assumptions and rely less on gut feel when allocating budget across brands and markets.
Pharma commercial teams live and die by how quickly they can spot what is working. Connected sales and CRM data lets brand managers see prescription trends by territory, prescriber segment and channel within days of the data landing, rather than waiting for a monthly deck. Field leaders can identify which reps are gaining share and which territories are underperforming against potential, then adjust call plans and targeting while there is still time in the cycle to act. Marketing can finally connect campaign spend to prescription lift instead of reporting on impressions and hoping. For most companies, sharper targeting and faster course correction across even one major brand pays for the BI investment on its own.
Pharma operates under some of the heaviest reporting obligations in any industry. Open Payments submissions under the Sunshine Act, aggregate spend reporting, state price transparency filings and FDA inspection readiness all become far less painful when the underlying data is governed, complete and traceable. Instead of a weeks-long scramble through shared drives before every submission deadline, compliance teams query a platform where every figure has documented lineage back to source. Access controls follow the data wherever it moves, audit trails record who saw what and validation documentation exists for the reports regulators care about. As enforcement keeps tightening, that posture is worth more every year.
Connecting MES, ERP, quality and distribution data gives operations teams visibility that siloed systems simply cannot provide. Plant managers can track overall equipment effectiveness, batch cycle times and right-first-time rates across sites on one dashboard instead of comparing incompatible reports. Quality teams spot deviation patterns early enough to address root causes before they become recurring findings. Supply chain planners see demand signals, inventory positions and production schedules together, which means fewer stockouts of critical products and less working capital tied up in excess inventory. In an industry where a single stockout can mean patients going without treatment and regulators asking questions, that visibility carries weight well beyond the balance sheet.
Clinical development consumes enormous budgets, yet many sponsors still track trial progress through manually assembled status reports. Bringing CTMS, EDC and site data into a governed reporting layer lets clinical operations monitor enrollment against plan, site activation timelines, data query aging and protocol deviation rates in near real time. Underperforming sites get flagged in weeks rather than surfacing at a quarterly review, and portfolio leaders can compare trial health across programs using consistent definitions. When a trial slips, you find out early enough to intervene, and in drug development, months saved on a timeline translate directly into months of additional patent-protected revenue.
BI looks different depending on which part of the pharma value chain you sit in. A commercial team at a mid-sized speciality pharma has very different questions than a quality director at a contract manufacturer. The use cases below show where business intelligence delivers value in practice, from field sales through to pharmacovigilance.
Syndicated data from providers like IQVIA is expensive, and most companies extract a fraction of its value because it sits in static extracts that only a few analysts know how to work with. Loading that data into a governed platform alongside your own sales and CRM data changes the equation. Brand teams can track share shifts by geography, payer channel and prescriber decile, watch how competitor launches ripple through their markets and drill from national trends down to the specific accounts driving change. When a competitor gains formulary position or launches a new indication, you see the impact in your dashboards within a data cycle rather than discovering it in the next quarterly review.
Pharma supply chains are long, regulated and unforgiving. A single API supplier issue can cascade into stockouts months later, and serialization requirements under DSCSA add another layer of data that has to be tracked accurately. BI brings demand history, open orders, inventory positions, production schedules and supplier performance into one planning view, so planners can spot risk before it becomes shortage. Forecast accuracy improves because planners work with actual sell-through and channel inventory data rather than shipments alone. Useful measures include forecast accuracy, days of supply on critical SKUs, stockout incidents and expiry write-offs.
Sponsors and CROs run trials across dozens of sites and systems, and status reporting typically lags reality by weeks. A clinical analytics layer pulls enrollment, site activation, monitoring visit and data quality metrics from CTMS and EDC systems into dashboards refreshed on a schedule the study teams control. Slow-enrolling sites, aging data queries and rising protocol deviations get flagged automatically, so study leads intervene early instead of explaining variances after the fact. Portfolio views let development leadership compare programs using one consistent set of definitions. Track enrollment against plan, screen failure rates, query resolution time and database lock timelines.
Safety and compliance teams carry reporting burdens that grow every year. Adverse event case volumes, processing timelines and regulatory submission deadlines need constant monitoring, while transparency obligations such as Open Payments demand accurate aggregation of spend data scattered across expense, CRM and vendor systems. BI turns both from recurring fire drills into routine reporting. Case processing dashboards show workload, aging and compliance against reporting clocks. Aggregate spend reporting becomes a governed pipeline with documented lineage rather than a spreadsheet exercise that takes over the compliance calendar every submission season. Measure late case rates, submission accuracy and the effort spent preparing each regulatory filing.
1. Start with decisions, not data: Pharma companies sit on enormous volumes of information across clinical trials, manufacturing, supply chain, sales and pharmacovigilance, and the temptation is to bring all of it into one place at once. That approach almost always stalls. Pick two or three decisions that matter commercially, such as which territories are underperforming against forecast or where batch release delays are eating into launch timelines, and build backwards from there.
2. Treat compliance as a foundation: Any system touching clinical or manufacturing data needs to hold up to FDA scrutiny, which means audit trails, validated data pipelines and clear lineage from source to dashboard. GxP requirements and 21 CFR Part 11 compliance can’t be bolted on later. If your BI platform can’t show an auditor exactly where a number came from and who touched it along the way, you’ve built a liability rather than an asset.
3. Prioritise commercial analytics for early wins: Bringing prescription data, CRM activity and market access information together gives sales leadership a live view of how a product is actually performing against plan, rather than waiting for month-end reports that describe a market that has already moved.
4. Connect operations data to protect supply: Linking manufacturing execution data with demand forecasts helps you spot supply risks before they become stockouts, which matters enormously when patients depend on continuity of supply.
5. Consolidate onto a governed platform: For most pharma organisations, the practical starting point is moving fragmented reporting into a platform such as Microsoft Fabric or Power BI, with role-based access that respects the strict separation between commercial and medical functions.
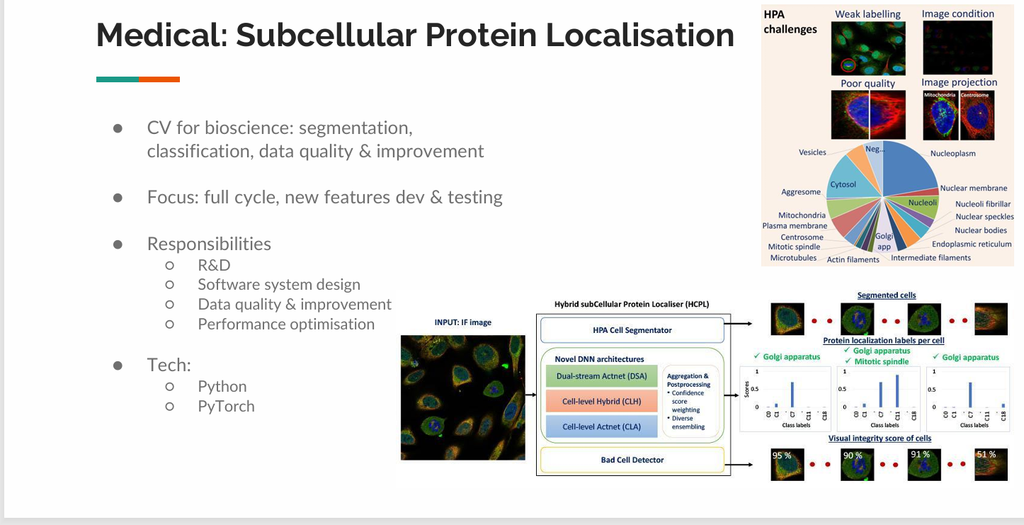
Beyond dashboards and reporting, our work extends into applied machine learning for the life sciences. One example is a computer vision project for subcellular protein localisation, which uses deep learning to analyse immunofluorescence microscopy images and identify where proteins sit within a cell. The system, a Hybrid subCellular Protein Localiser, combines several novel neural network architectures (a dual-stream Actnet, a cell-level hybrid model and a cell-level Actnet) whose predictions are merged through confidence-score weighting and diverse ensembling for greater accuracy.
The pipeline covers the full analysis cycle. Cells are first segmented from the raw image; each cell is then assigned protein localisation labels across categories such as the Golgi apparatus, mitochondria, nucleoli and mitotic spindle, and a bad cell detector scores the visual integrity of every cell so that poor-quality samples are flagged rather than distorting results. This matters because real-world bioscience imaging is messy: weak labelling, poor image quality and inconsistent conditions are common challenges in Human Protein Atlas data, and the system was built to handle them.
Delivered in Python with PyTorch, the engagement spanned research and development, software system design, data quality improvement and performance optimisation. For pharmaceutical organisations, this kind of capability turns vast volumes of microscopy imagery into structured, reliable data that can feed directly into research decisions, drug discovery workflows and the broader BI estate.
1. Define the Business Objective
Start with the decision the BI solution needs to support. Examples include reducing product shortages, monitoring production performance, improving sales forecasting or identifying underperforming territories.
Then define the KPIs required to measure that objective. Every later step becomes easier when you know exactly which numbers matter and why.
2. Identify Your Data Sources and Assess Their Quality
Map the systems containing the information required for each KPI. These may include ERP systems, CRM platforms, manufacturing and quality systems, clinical systems, procurement platforms, finance software, SQL databases, Excel and CSV files, third-party datasets and equipment or IoT data. Also identify who owns each source and how frequently the information changes.
Then look closely at the data itself. The same product, supplier, location or customer can be represented differently across systems. Identify missing records, duplicated entities, inconsistent formats, incorrect data types and conflicting definitions now, because these issues should be resolved during transformation rather than hidden inside visualisations.
3. Build the Integration Layer and Data Model
Extract information from source systems automatically using native connectors, APIs, database connections, cloud pipelines or custom scripts, then store it in a central database or warehouse where transformations are applied consistently.
Once the data is clean, organise it around the business entities users need to analyse. These could include products, territories, customers, suppliers, facilities, production lines, studies or time periods. Document every KPI formula so stakeholders understand exactly how each reported number is calculated.
4. Build the Reporting Layer and Validate It
Reports should follow the decisions users need to make. Place high-level KPIs first, add trends and breakdowns underneath, then provide filters and drill-downs for users who need more detail. Avoid adding charts simply because the data is available.
Before wider deployment, have business users compare the new reports with trusted source records and existing reporting. Validate totals, filters, calculations, refresh logic and data access. For reporting connected to regulated processes, involve the appropriate compliance, quality, security and system owners in the validation approach.
5. Automate, Monitor and Improve
Once reporting is validated, automate the refresh cycle. The right frequency depends on the process. A commercial dashboard may refresh daily while an operational report could need more frequent updates. Monitor your pipelines so failed refreshes or unexpected changes are detected quickly.
Finally, treat the first release as the beginning rather than the finished product. Users usually discover new questions once they start working with the solution, so add analysis when it supports a real decision and remove metrics nobody is using.
A good BI partner should connect strategy to implementation. Look for experience across data integration, architecture, data engineering, governance, dashboard development and the realities of working in a regulated life sciences environment.
Vidi Corp supports pharmaceutical organizations across data integration, data pipelines, data warehousing, Microsoft Fabric and Power BI reporting. If your immediate priority is reporting and analytics, you can also work directly with our team
Business intelligence in the pharmaceutical industry is the process of combining data from different business systems and transforming it into reports, KPIs, and analysis. It can support areas including commercial operations, manufacturing, supply chain, finance, clinical operations, and quality.
Common sources include ERP systems, CRMs, manufacturing platforms, procurement systems, quality systems, clinical applications, finance software, SQL databases, Excel files, APIs, and external market datasets.
The KPIs depend on the purpose of the analysis. Common examples include revenue, sales vs target, production output, equipment utilisation, inventory levels, forecast accuracy, supplier lead time, quality events, study milestones, and actual spending vs budget.
Power BI can be used to integrate, model, and visualise pharmaceutical business data, particularly for companies already working within the Microsoft ecosystem. The wider architecture still needs appropriate data governance, security, validation, and integration controls based on how the reports will be used.


