

Paid search analysis is about looking at how your campaigns are really doing – not just at how many people click on your ads, but what happens to those clicks once they reach your sales funnel. It’s about linking how much you spend on ads to how much revenue you get in return, plus the lifetime value of each customer. This way you can see which keywords, audiences and ads are actually making you money, and which ones are quietly wasting your budget. And make no mistake, in 2026, with cost per click prices going up everywhere and AI-generated ads flooding the market, this kind of analysis is no longer a nice-to-have – it’s a must-have.
Our marketing analytics agency has been helping all kinds of companies get a grip on their paid search analysis. We’ve built Looker Studio dashboards and GA4 setups for 600+ companies, including Neil Patel, Revolut and Teleperformance. Our experience covers e-commerce, B2B lead generation, and multi-brand portfolios, so the tips and tricks we’re going to share in this article are based on real client work, not just theories.
This guide is going to walk you through how we do paid search analysis in the real world. We’ll cover the basics that have to be right before any analysis is worth doing, the specific areas we focus on – landing pages, keywords, ads, audiences, assets and competitors – the metrics you should be using, and a step-by-step process you can use to run your own reviews on a monthly or quarterly basis.
Paid search analysis is about looking at how your paid search campaigns are performing across different platforms, keywords and user journeys, and then using that data to guide your spend decisions. It’s about what you’re getting out of your ad spend, what you’re getting back in return, and how much it’s costing you to get there.
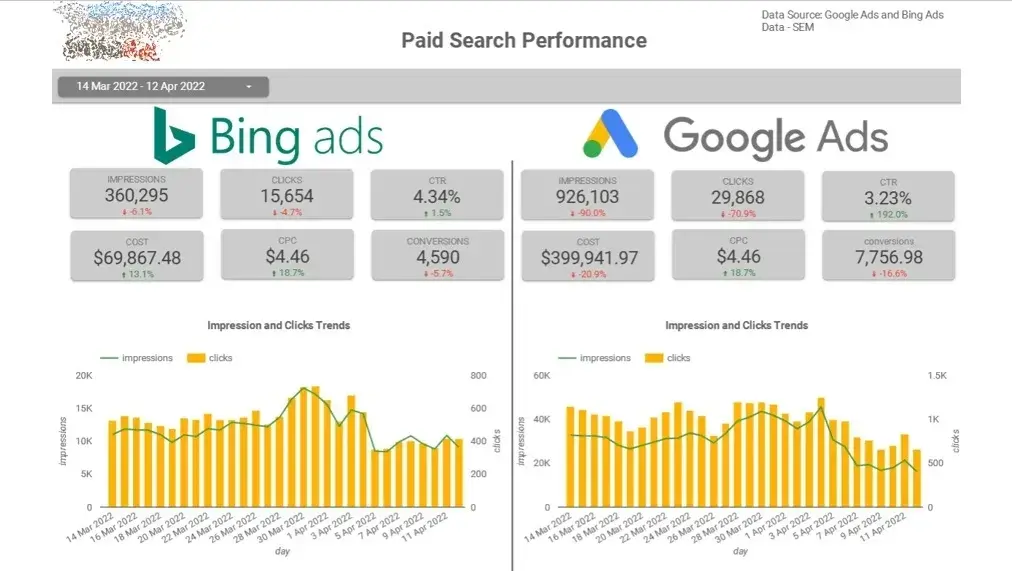
The default reports inside Google Ads or Microsoft Advertising only give you part of the picture. Proper PPC reporting links your ad spend to how much revenue you’re making, how much you’re closing and the lifetime value of each customer. And that makes a big difference because a keyword that looks cheap in terms of clicks might actually be bringing in customers who churn fast, while a more expensive keyword might drive the accounts that are actually worth keeping.
Good paid search analysis also looks at more than just one system. It spans the ad platforms themselves – Google Ads, Microsoft Advertising, Amazon Ads – as well as Google Analytics 4, CRM data and call tracking tools. Trying to look at just one ad account in isolation hides the full cost and value of each campaign. And only by looking at the bigger picture in a structured business intelligence dashboard can you get a true understanding of what’s happening.
In 2026, paid search has stopped being a click-volume game and become all about revenue accountability. Cost per click prices have gone up sharply across Google Ads and Microsoft Advertising, driven by AI-generated ad variants, broader match types and increased competition in every major category. And finance teams are starting to ask tougher questions about customer acquisition cost and payback periods – and “we got more traffic” is no longer a sufficient answer.
Paid search analysis matters because the goal is no longer just to buy as many clicks as possible – it’s to feed the PPC platforms with high-quality data so they can optimise towards real business outcomes. That means tracking conversions accurately, pushing offline conversions like qualified leads and revenue back into the ad platforms, and knowing your CPC, CPA and ROAS targets. Without that analysis, you have no benchmarks to adjust your targeting, messaging or keywords against, and the platforms are left to optimise on their own terms rather than yours.
Regular analysis also stops your budget from bleeding into the wrong places. Search terms reports, audience breakdowns and device level data reveal queries with high intent signals but no conversions, or audiences that click often but never buy. In competitive categories like legal services, B2B SaaS and home services, a single low-intent keyword can swallow thousands per week before anyone even notices.
The other reason this analysis matters is that the platforms themselves are incentivised to optimise towards their own engagement metrics, not yours. Google and Microsoft optimise their automated bidding towards their own definition of success, which may not match your margin targets. An account left on autopilot will chase the platform’s definition of success rather than your own. Analysing results against your customer acquisition cost, customer lifetime value and gross margin is the only way to keep your campaign aligned with business outcomes rather than platform ones.
Every paid search analysis we’ve ever done starts in the same place: checking whether the conversion data can actually be trusted. And more often than not, it can’t. We’ve audited GA4 setups where duplicate events were inflating conversion counts by up to 40%, and accounts where the “purchase” event was firing on the cart page rather than the thank-you page. Before any optimisation work can even begin, these foundations have to be right.
For lead generation businesses, the gap between a form fill and a qualified lead is where most accounts lose money. We always recommend pushing offline conversions back into Google Ads and Microsoft Advertising – marking which leads became sales qualified leads, which closed, and what revenue they brought in. Without that feedback loop, the bidding algorithms keep chasing form fills from tyre kickers rather than buyers.
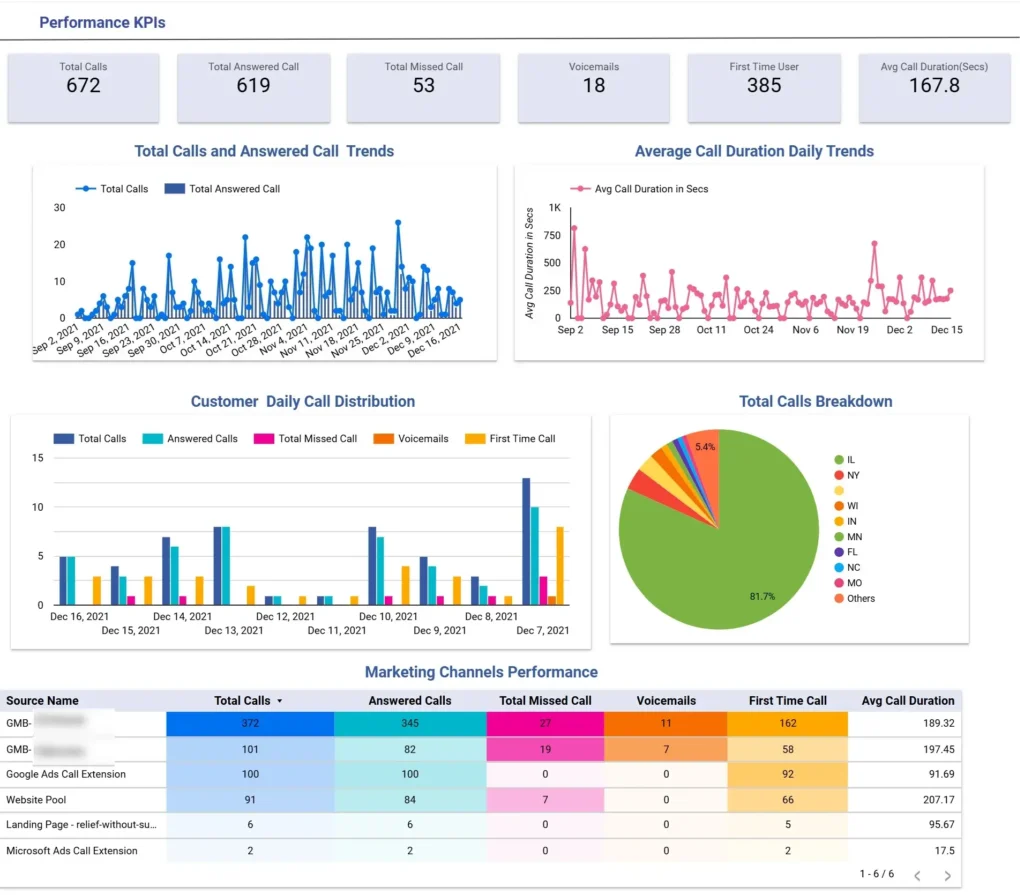
If calls are a major part of your conversions, CallRail is where we send our clients. It assigns unique phone numbers to every traffic source and ad, so you can track the exact keyword and campaign that turned into a sale. You can see the CallRail Looker Studio dashboard below that we created to understand which data CallRail returns.
For ecommerce companies with longer buying cycles – info-product or high-ticket service businesses – Hyros has been a good fit for getting tighter attribution.
Trying to run paid search without a clear idea of your numbers is just a surefire way to waste budget. Before a single campaign goes live, you need your average order value and customer lifetime value nailed. This is what sets the limit on how much you can afford to spend to acquire a customer – then you can compare how you’re doing against that and make adjustments accordingly.
We built a Shopify Power BI dashboard for ecommerce businesses that does all the legwork for you, calculating those metrics directly from your store data. It shows a line graph of how average LTV grows year on year, so you can plan your acquisition budgets against the long-term customer value rather than making it up as you go along.
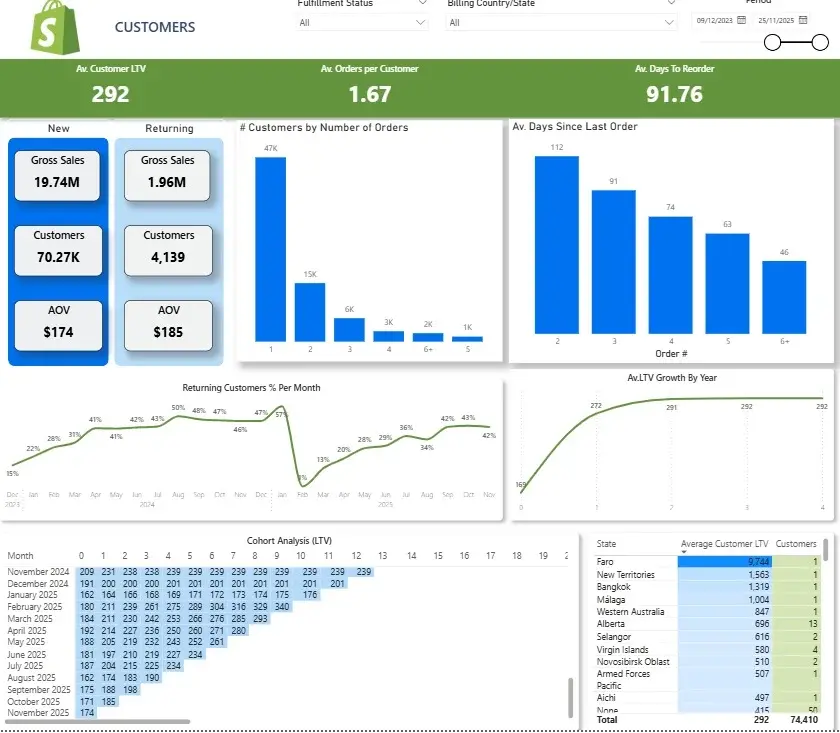
A cohort table underneath groups customers by when they first made a purchase, and shows how their average LTV grows over time. Customers who made their first buy in July 2024 started at $153 and rose steadily, while those who first purchased in February 2024 were at $180 and nearly doubled in value within nine months. A breakdown by state also highlights where customers are worth more in the long run, so you can weight your paid search targeting to the markets with the most potential for long-term returns.
A well-organised account structure is the only way to get reliable analysis out of your data. When brand and non-brand traffic are in the same campaign, your reported return on ad spend looks way better than it actually is because it’s inflated by people who were going to buy from you anyway. The same goes for when search and display budgets are mixed, or when high-intent and top-of-funnel keywords are in the same ad group – the averages hide the truth, and every optimisation decision gets made with distorted data.
In 2026, a good account is built around logic and intent rather than just a list of keywords. Campaigns are usually grouped by funnel stage or product line, with separate containers for brand, non-brand, competitor and retargeting traffic. Ad groups are kept nice and tight, so each one is focused on a single buyer intent with matching ad copy and landing pages. Device and geographic splits are layered in only where the performance or margin actually differs – not just ‘cos it’s easier.
That structure determines how much control you have over your account on a day-to-day basis. Clean separation lets you shift budget to your winners without starving the profitable bits, test ad copy against a single theme rather than a mixed mess, and scale up the campaigns that are working without disrupting the rest. It’s the difference between having a few clear levers to pull and hoping the whole account moves in the right direction all on its own.
Paid search analysis only becomes useful if you know where to look and what you need to act on. Below are the layers that matter most – landing pages, keywords, ads, ad copy, demographics, assets and competitors – along with how to read the results when automated bidding strategies like Maximise Conversions, Target CPA and Target ROAS are running the show, and when it’s time to take over.
Landing page analysis is where it all starts. If people land on a page that is not designed to convert, no amount of campaign optimisation is going to make the numbers work. Here you want to figure out which bits of the page actually influence buying decisions – reviews, FAQs, pricing blocks, trust signals – and which ones people just scroll past.
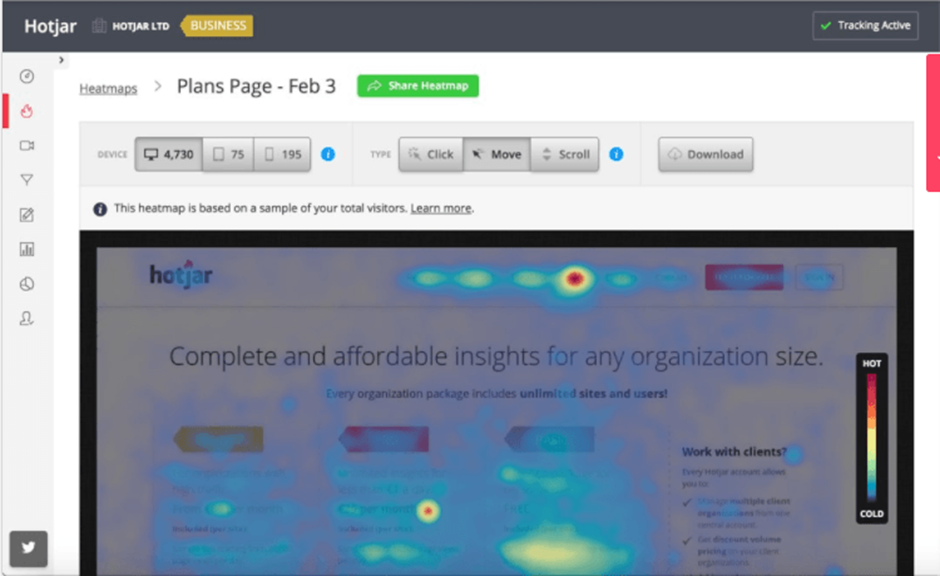
Heatmaps are one of the first tools to reach for in this analysis. They show where people click, hover and spend time, and quickly expose whether your key conversion elements are even being seen. If your testimonials are below the fold and nobody scrolls down that far, they are not doing the job you think they are. Our data analysts have previously set those up with Hotjar for our clients.
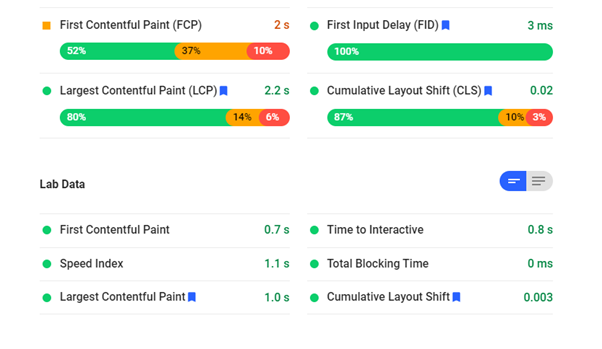
Core Web Vitals are important here, too. Slow page loads, layout shifts and interactivity scores all drag down both conversion rates and Google Ads quality scores. The best place to check them is via PageSpeed insights or through SEMrush/Ahrefs reports.
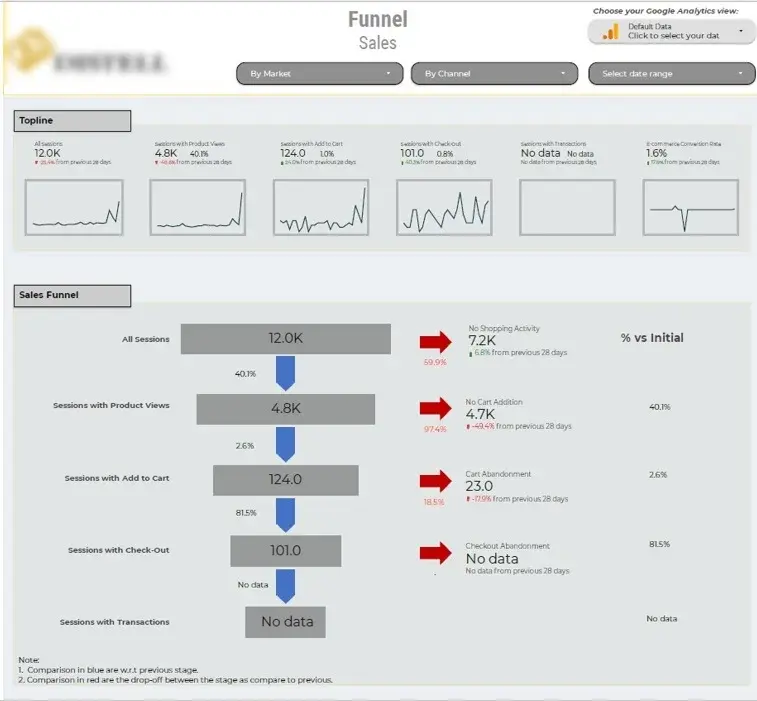
GA4 engagement metrics sit alongside these – scroll depth, engaged sessions and conversion funnels show where visitors drop off and which content actually holds their attention. Sometimes we build Looker Studio dashboards for clients to analyse the GA events in detail, calculate conversion rates and filter the funnel by traffic source or demographic.
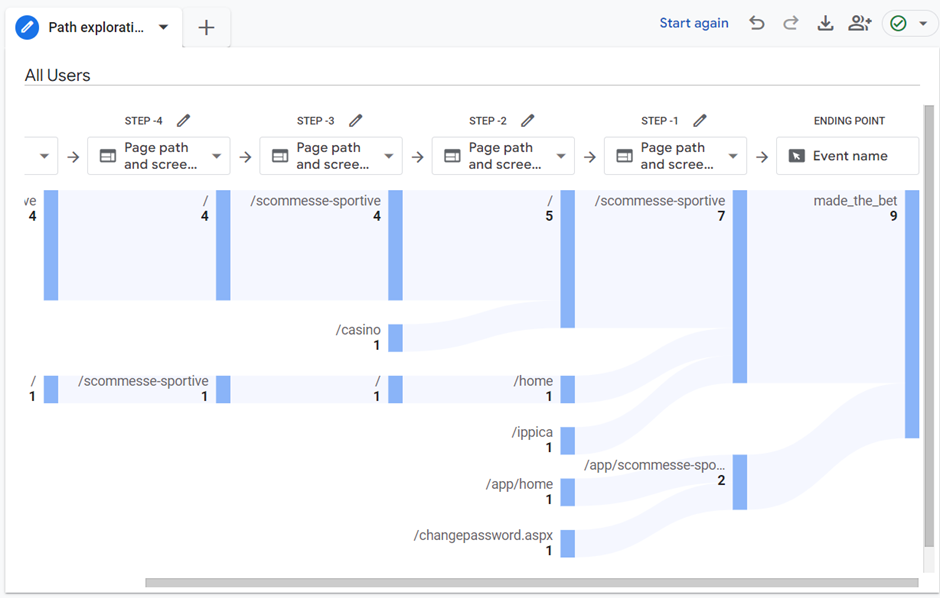
Reverse path analysis is another useful marketing analytics example – and it’s easy to set up in GA4. It shows the sequence of pages a user goes through before converting, and lets you see what information they needed before they were ready to buy. That feeds directly into landing page design – for B2B teams, it also doubles as a pre-call research tool, as knowing which pages a lead visited tells you a lot about what they care about before you even pick up the phone.
The main job of keyword analysis is making sure the intent behind each keyword aligns with what your page offers. A high-volume keyword means nothing if the people searching it aren’t ready to buy what you sell. This is where most wasted spending is hiding. One thing that keeps a lot of advertisers up at night is the gap between the keyword you’re bidding on and the actual search term someone typed in. That keyword is what you’re bidding on; the search term is what someone actually types into the search bar. With broad and phrase match picking up wider variations than ever, it’s your search terms report that shows you whether your budget is being spent on the exact right queries or just making do with something close enough.
When judging each keyword, cost per conversion and conversion rate are a bare minimum. With offline conversion tracking in place, cost per qualified lead or cost per sale is even better because it shows which keywords are actually bringing in buyers as opposed to just form fillers.
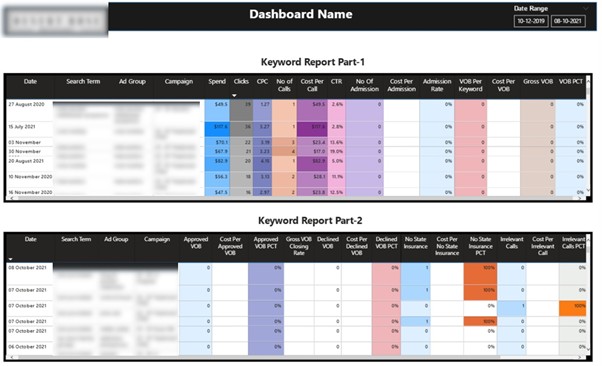
For example, consider the dashboard our Power BI consultants created above for a healthcare client. We blended Google Ads and Callrail data to find which keywords bring in more calls, appointments and sales. Our client was then able to feed this data back into Google Ads to get more relevant leads.
A negative keyword list is the other half of this work. Without one, you’re going to end up paying for completely irrelevant queries, people looking up unrelated brand names, and even job seekers searching your category. A weekly review of search terms is usually enough to keep the account tidy.
It also helps to group keywords based on what the user is actually searching for. Info queries (“what is X”) behave differently from those looking to buy (“best X for Y”) and, of course, people looking to make a purchase (“buy X near me”). And, your bids, ad copy and landing pages should all be tailored to which bucket a keyword sits in.
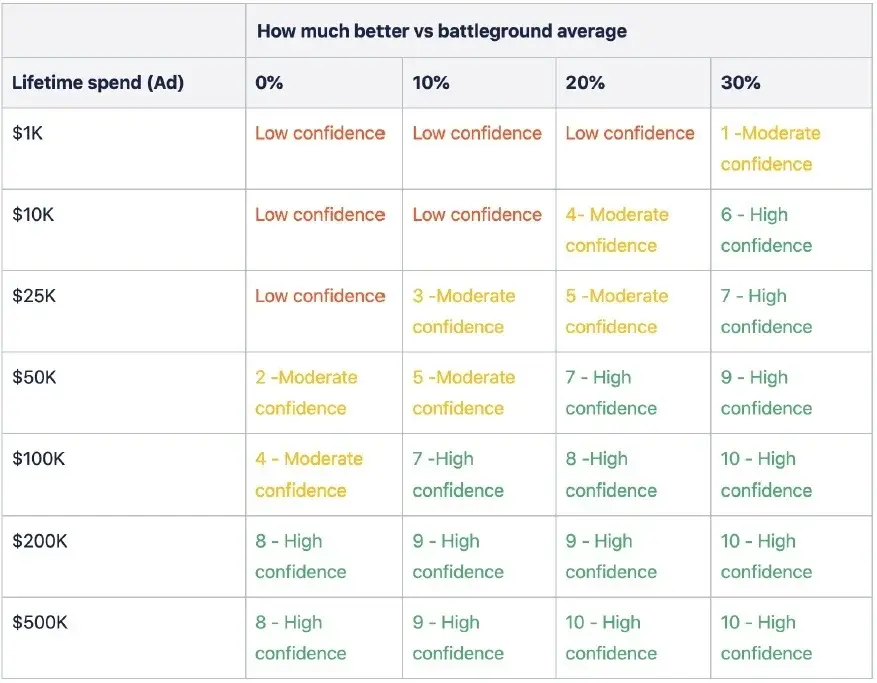
Ad-level analysis is where you decide which ads are winners and which are losers. We worked with a top agency to build an ad evaluation dashboard that does just that. It segments ads by total spend to date and how well they’re performing against target metrics, then gives each one a confidence level – low, medium or high – based on how consistently it delivers results.
That makes it a lot clearer for account managers to scale the winners up and shut down the underperformers, rather than having to make decisions on incomplete data. And, it cuts down on the hesitation that usually holds people back from making these calls, because the dashboard basically tells you whether an ad has enough budget behind it to be judged in the first place. The end result is less wasted budget, tighter campaign efficiency and a whole lot less stress.
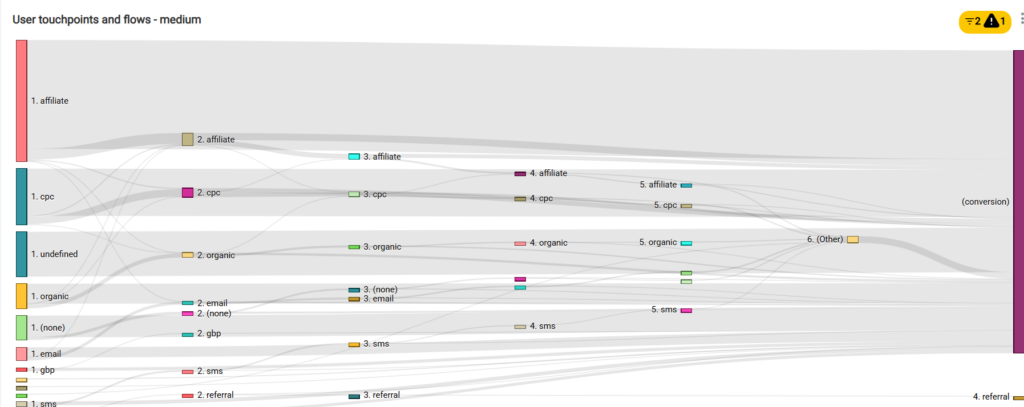
Cross-channel marketing dashboards and attribution modelling sits alongside this work. Paid search rarely operates in isolation, so these models show how your ads are interacting with social, display and organic touchpoints along the journey. Without that view you risk pausing ads that look weak on last click but are actually doing some real work higher up the funnel. This is especially relevant for brands running media buying across multiple paid channels simultaneously, when budgets are split between search, social and programmatic, cross-channel attribution becomes the difference between optimizing toward real revenue and optimizing toward the platform’s preferred metrics.
The same principle applies inside the paid search account itself. A search and display campaign will often feed into Performance Max by warming up audiences and giving signals the PMax algorithm can use. By looking at how campaigns influence each other, you avoid shutting down the feeders and wondering why your best-performing campaign suddenly stalls.
We have previously set up attribution reports in a specialised ppc reporting tool. Reach out to our consultants if you need a similar solution.
Ad copy analysis is all about finding which messages actually make people click and convert – and not just one or the other. A high click-through rate but low conversion rate means the copy is probably overselling relative to what the landing page delivers. A low click-through rate but a strong conversion rate usually means the copy is so generic that it can’t compete in the auction, even though it does attract the right buyers when it gets seen.
The analysis breaks down into three bits: headlines, descriptions and display paths. But headlines carry the most weight because they’re what drive clicks. So, they need to reflect both relevance to the search query and a clear point of differentiation. Descriptions expand on the promise and handle objections, while display paths reinforce the match between search and destination.
But the bigger question is, which angle of messaging actually gets a response from your audience? Is it price-led (“affordable”, “low-cost”, etc.), quality-led (“best”, “premium”, etc.) speed-led (“same-day”, “24-hour”, etc.) or location-led (name the city or region directly)? Each angle appeals to a different buyer, and by grouping ads by angle in your analysis, it’s very obvious which one wins for which product, audience or region.
Those angles which consistently hit on both click-through rate and conversion rate are the ones to scale across the account. If “fastest turnaround” is beating “best quality” for a home services client in one region, it’s worth testing that speed angle in other regions as well – rather than rewriting every ad from scratch.
Demographic analysis is how you figure out who’s actually buying from you, rather than who you think is buying. By breaking performance down by age, gender and geography, you often find that the people who are actually converting aren’t the ones you originally targeted. That gap between assumed and actual buyer is where most ideal customer profiles get updated.
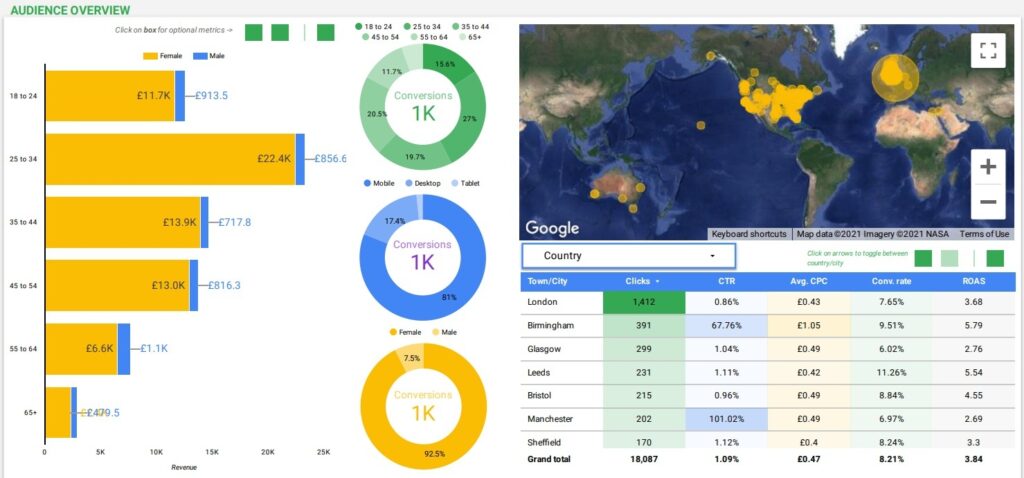
Our Looker Studio consultants built an audience analytics dashboard that segments paid search performance across age, gender and device in a single view. It tracks click-through rate, conversions and ROAS for each segment, so the profiles that are pulling their weight are right there in front of you, and the ones that are draining budget are just as easy to spot. Media buyers use it to tighten targeting on the audiences that are generating the strongest returns and exclude the ones that are consistently underperforming.
The real-world outcome is to zero in on your target market with less waste. Once you start seeing that a specific age group living in a certain region converts at twice the account average, you can start optimizing your bids, ad copy, and landing pages towards people that really want to buy – and cut off those that never were going to purchase in the first place. Over time, that is how paid search campaigns move from being all over the place to actually tailoring perfectly to your ideal customer.
Asset-level analysis is what lets you know which specific images and videos are doing the work in your display and YouTube campaigns. Media buyers rely on dashboards that break down performance across different types of ads, where and who they’re being shown to, and all the metrics that matter like CTR, conversions, ROAS and engagement. The idea is to spot what’s working fast, so you can shift budget towards what is actually driving results, before the ones that are not performing too well gobble up all your budget.
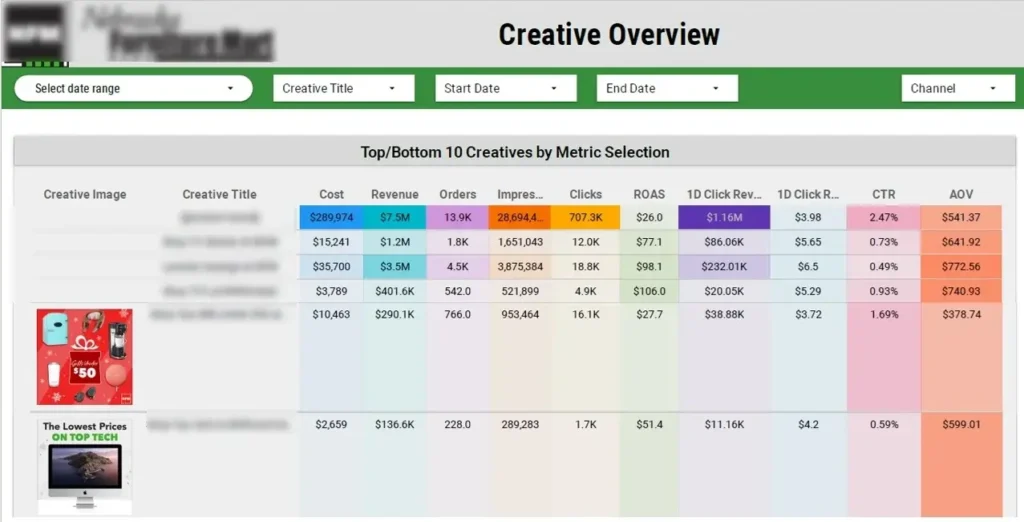
Our BI consultants came up with a thumbnail analytics dashboard that takes a hard look at the static creatives you’re using in your ads – that is to say, images for display and thumbnails for YouTube. It shows up each individual creative alongside CTR, revenue, conversions, and ROAS, so you can see at a glance what’s really pulling its weight. Media buyers use this to prioritise their best-performing visuals and shut down those that are failing to deliver, which keeps your ad spend targeted at the things that are actually driving results.
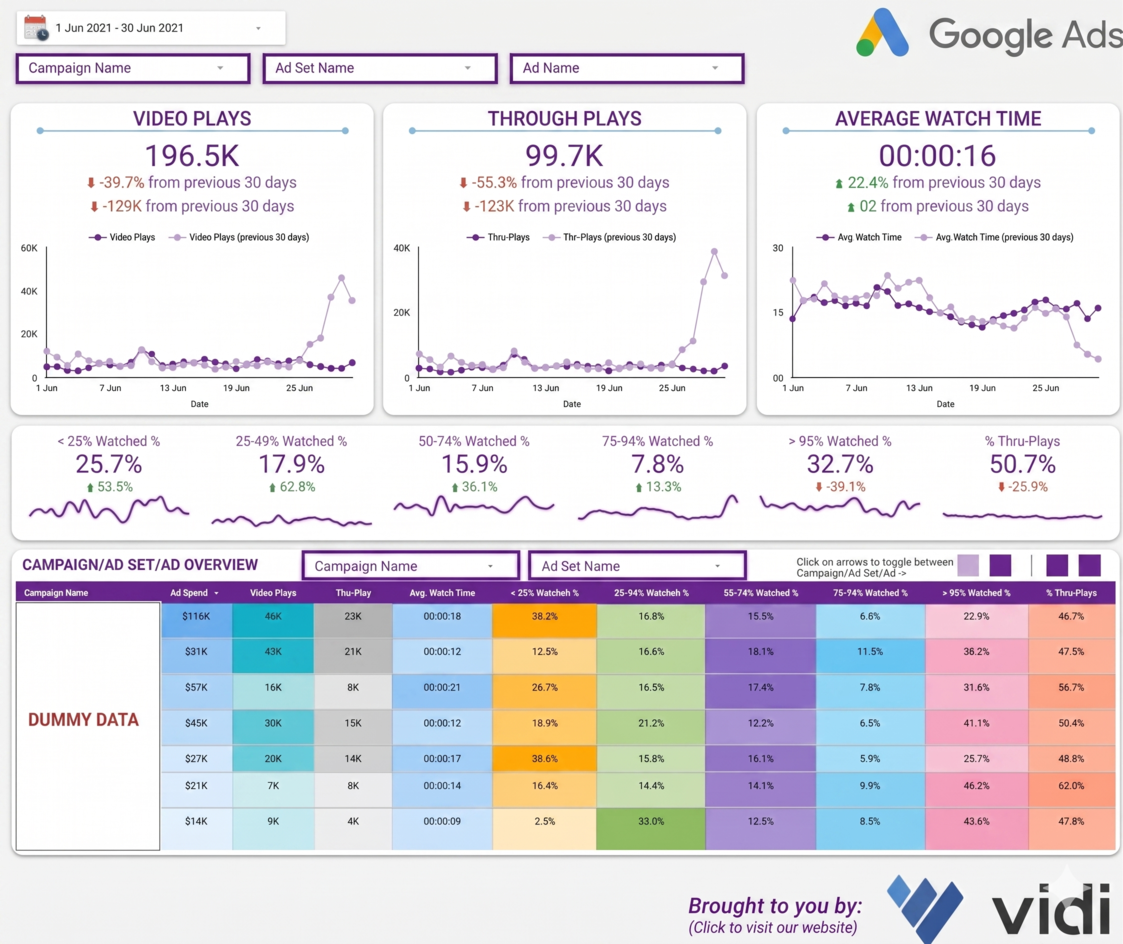
For YouTube campaigns, our data visualization consultants also created a video analytics dashboard that tracks exactly how viewers behave while watching your ad all the way through – not just the number of video plays, but where people drop off and which ones stick with it till the end. That tells you exactly where your hook is losing people and which ads are holding it together longest.
Those insights feed right into your next set of creative decisions. If most of your viewers bail in the first five seconds, it means your hook is weak; if drop-off spikes at the 50% mark, it’s the middle of the ad that’s losing them. Your budget can then flow towards the videos that keep viewers engaged all the way through to the call to action, rather than being spread too thin across everything in the account.
PPC competitor analysis is all about understanding who you are really competing against and finding the gaps they are leaving open. The Auction Insights report inside Google Ads is the starting point – it tells you which advertisers are in your auctions, how much of the market they’re taking up, and how often they outrank you.
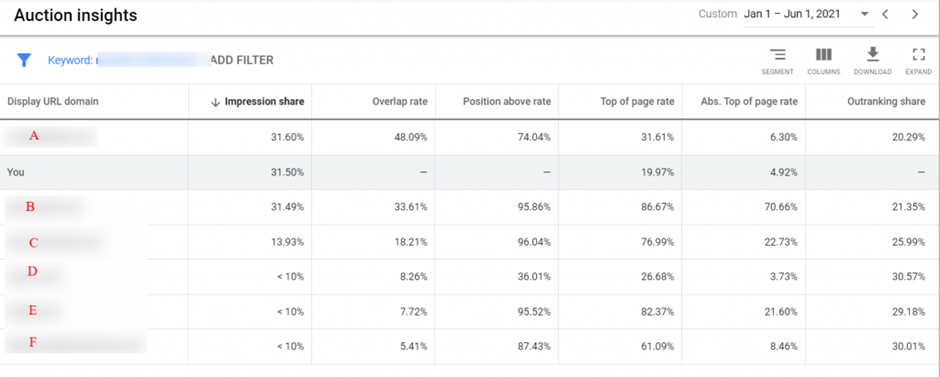
One of the best uses of this report is spotting when your competitors go quiet. Run Auction Insights by day of week or hour of the day, and you can see that some advertisers pull back on weekends or evenings. And that is when CPCs drop, so it makes sense to schedule more aggressive bids into those periods.
Tools like SEMrush, Ahrefs, and Spyfu do the rest – which paid keywords your competitors are bidding on, and which ones they’ve dropped over time. When they test and then quietly drop a keyword, that is a pretty clear sign it was never going to work out. But when they keep bidding on a keyword for months, that means it is almost certainly profitable and worth a closer look for your account, too.
Not every metric is worth the same weight. What matters most depends on what your campaign is actually trying to achieve – is it leads, sales, free trials or bookings? Each one pulls the analysis in a different direction. A campaign judged by ROAS alone will look like a failure if it’s a lead gen campaign, and an e-commerce campaign judged on CTR alone will hide the fact that it’s losing money.
The core PPC metrics everyone should be tracking are below – each with a short definition, how it’s calculated, and what to look for in terms of a “good” number:
In practice, we reckon the best way to get a handle on these metrics is to visualise them over time in Google Ads or a data tool like Looker Studio, with clear notes on major changes to your account, like shifting budgets, updating landing pages or tweaking your bidding strategy. Without these notes, you’re basically just stabbing in the dark, wondering which of your changes actually made a difference.
Paid search analysis works best when it’s a regular, routine thing. Most teams find that a monthly review is great for making tactical changes, while a quarterly review is better suited to making bigger, more strategic changes – and if you just launched a major campaign, then it’s probably worth looking at that too, ad-hoc style. Simply, start with your goals, then move on to account structure, then segment, keywords, ad messaging and finally revenue and profitability.
A simple template will help you keep your findings consistent over time, and make it easy to share them with your stakeholders. For monthly reviews, we usually recommend looking at the last 30 days – and take note of any seasonal promotions or events that might be skewing your numbers. For quarterly reviews, take a look at the last 90 days instead.
Every time you do analysis, make sure you’re clear on what your campaign is actually trying to do – is it driving leads? Sales? Trials? Whatever it is, you need to write it down, and ideally agree it with your finance team or leadership before you even start.
Attribution is an area most teams tend to skip over, but don’t – check what attribution model you’ve set up in Google Ads, and what lookback window you’re using in Google Analytics – because these settings can seriously affect which campaigns get credit for sales. Lovely example: switching from last-click to data-driven attribution often reveals that your branded keywords were getting too much credit, while your non-branded campaigns were actually doing more to drive sales than the reports suggested.
Before you start looking at performance numbers, just make sure your account structure isn’t a total mess. Are you splitting brand and non-brand campaigns clearly? Are your remarketing audiences separate from your prospecting stuff? Is there a campaign quietly hoovering up 70% of your budget because some old setting nobody’s revisited still has the upper hand?
If so, split your campaigns into more focused units – this will give you the control you need to run proper ongoing tests. Just be careful with timing – restructuring mid-season is almost always going to cause short-term dips while the algorithms get back on track.
Now take each campaign and break it down by device, location and audience type – and compare your conversion rates, CPA and ROAS across the board. Common pattern: mobile might have a higher CTR, but a lower conversion rate than desktop – which usually points to a mobile landing page issue rather than a targeting problem.
Geography also needs some scrutiny – especially if you’re a national business. And if you’re on Shopify, you might also want to look at LTV by state or region – if one region has lower CAC and higher LTV, it might be worth investing more there.
Rank your keywords by spend, then overlay your conversions and revenue – and identify the terms that are kicking out the most cash (and the ones that aren’t). High-spend, low-return terms are the first to go – either by reducing your bid or pausing the ad altogether. On the other hand, high-spend, high-return terms probably deserve more budget – and maybe even their own campaigns.
Search terms need a bit of a spring clean – keep the ones that convert, bin the ones that don’t – and refine your match types where necessary. If you’re getting weak variations from broad match, maybe it’s time to switch to exact match or start a new ad group.
Compare ad variations within each ad group to see which value propositions and CTAs are really driving the best results – and pause the ones that aren’t cutting the mustard. Test new ads and see if you can do better.
This will also give you a chance to evaluate your landing page behaviour – if your ad is promising “same day quotes” but your landing page is burying the form three scrolls down, you might want to rethink that a bit.
The final step is to reel in the last bit of value out of your paid search performance and tie it to what really matters – your sales, profit, and what you need to do next. Take a close look at how ad-driven leads are turning into actual closed deals, subscriptions or repeat purchases in your CRM. And don’t forget that just because an ad campaign looks healthy in terms of its return on ad spend, that doesn’t mean it’s not losing you money after you factor in the cost of goods or service delivery.
Reduce what you’ve learned into a snappy report: what’s working, what’s not, and three to five things you need to do for the next period to keep things moving forward. And maybe most importantly, record all the changes you make in a simple action log, so when you come to review again, you can see if you actually followed up on what you said you would. Because analysis that doesn’t turn into action is pretty pointless.
In Google Analytics 4, “Paid Search” is one of the default channel groupings. It covers any session that arrived from a search engine (Google, Bing, etc.) where the traffic medium is tagged as paid – typically cpc, ppc or paid. In practice, that means clicks on your Google Ads and Microsoft Advertising search ads, as long as auto-tagging or UTM parameters are set up correctly.
The most common reason paid search traffic shows up in the wrong channel is broken tagging. If auto-tagging (the gclid parameter) is switched off, or someone has added manual UTMs with a medium like “social” or “email” to an ad, GA4 will misclassify those sessions – and your paid search analysis will be built on the wrong numbers. Checking that ad platform clicks and GA4 paid search sessions roughly line up is one of the first sanity checks in any audit.
Yes, paid search analytics covers every platform where you pay to appear in search results, including Microsoft Advertising (Bing), not just Google Ads. Because Microsoft Ads typically has lower CPCs and an older, higher-income audience profile, analysing the two platforms side by side often reveals cheaper conversions hiding outside Google.
Paid search analytics refers to the data itself and the systems that collect it – conversion tracking, GA4, dashboards and reports. Paid search analysis is what you do with that data: interpreting the numbers to decide which keywords, ads, audiences and landing pages to scale, fix or cut. You need reliable analytics before any analysis is worth doing, which is why every review should start by checking the tracking can be trusted.
The most reliable way is to follow a fixed sequence rather than jumping straight into keyword bids. Ours runs in six steps: (1) reconfirm your goals, targets and attribution settings, (2) review the account and campaign structure, (3) break performance down by device, geography and audience, (4) analyse keywords, search terms and negatives, (5) evaluate ad messaging and landing pages, and (6) tie results back to sales, profit and lifetime value in your CRM. The full walkthrough is in our 6-step process above.
Monthly for tactical changes – pausing wasteful keywords, adjusting bids, refreshing negatives – and quarterly for strategic decisions like restructuring campaigns or shifting budget between markets. It’s also worth running an ad-hoc review two to four weeks after any major campaign launch, once there’s enough data to judge it. Using the same template each time makes results comparable from one period to the next.
It depends on what the campaign is there to do. For lead generation, cost per acquisition and lead-to-sale rate matter most; for ecommerce, ROAS read against your gross margin is the headline number. CTR, conversion rate and Quality Score are supporting metrics – useful for diagnosing why a campaign is under- or over-performing, but dangerous as goals in their own right. A campaign judged on CTR alone can look healthy while quietly losing money.
At minimum: the native reports in Google Ads and Microsoft Advertising, Google Analytics 4 for on-site behaviour, and a dashboarding tool like Looker Studio or Power BI to bring spend, conversions and revenue into one view. Depending on your business, add call tracking (CallRail) for phone-driven conversions and SEMrush or Ahrefs for competitor keyword intelligence. We’ve compared the options in detail in our guide to PPC reporting tools.
A paid search analyst turns raw campaign data into decisions: verifying conversion tracking, finding wasted spend in search terms and audiences, identifying which keywords and ads actually produce revenue rather than just clicks, and reporting performance against business targets like CAC and LTV. Agencies typically pair this with building the reporting infrastructure itself – dashboards, offline conversion feeds and attribution setups. That’s the core of what our marketing analytics agency does for in-house teams.
Paid search analysis only really delivers value when it’s used to drive actual changes to the account. A lot of the time the changes you make can be grouped into three types: quick fixes that can be sorted in a week or so (pausing keywords that are wasting your money, turning off ad groups that are just taking up space and making a few changes to your bids), medium-term projects like sorting out the landing pages on your site or getting conversion tracking up and running, and more strategic shifts like deciding to pull budget out of one market and into another, or overhauling the whole structure of your ad account. Every big change should have a measurable goal attached to it – like “lift conversion rate from 2% to 3% in six weeks” – rather than just vague targets like “improve the landing page”.
The key to all of this is a regular review cycle. We’re talking monthly for tactical adjustments, quarterly for the bigger picture stuff, and following the same template each time lets you see how you’re doing from one quarter to the next. Do it like this, and paid search can become a positive feedback loop that gets stronger each quarter – rather than just a setup that gradually drifts out of control until things break.
If you need some help building the kind of reporting and tracking systems you need to make this work – maybe a custom paid search dashboard, a GA4 audit, or an offline conversion tracking setup – get in touch with our team. We work with in-house teams and agencies to take the messy ad data and turn it into something that actually helps you make decisions.


