

Advanced manufacturing analytics gives manufacturers a way to make sense of all the data they’re generating by pulling it all together from places like ERP, MES, warehouse systems, and even sales platforms – plus all the data being spit out by their sensors. Things get even more interesting when you start to see the picture from all these different angles come together through dashboards and analytics models. What this means in the end is manufacturers get a clear – and consistent – view of how their production, supply chain, and sales are really doing all at once.
As a business intelligence consulting firm that’s worked with all sorts of manufacturers over the years, we’ve built more than 1,000 custom analytics solutions – from production to supply chain to quality and maintenance. Our solutions are all about making sense of all that complex data, automating the routine reporting that bog you down, and giving you some solid dashboards to help with both the day-to-day and big-picture decision-making.
This article is meant to give you a rundown of what advanced manufacturing analytics is all about, why it’s worth your time and money, and how it’s actually used by real manufacturers. It’ll cover the different types of analytics, the kinds of scenarios where they really come in handy, the sources of all that data, the key performance indicators that really matter, the challenges you might face along the way, and what you can do – and how you can do it – to make a really successful, long-lasting implementation.
Advanced manufacturing analytics is about harnessing the power of data and automation to get a grip on manufacturing operations – planning, executing and turning a profit. It takes a big step beyond just reporting by joining the dots across production, the supply chain, sales and quality – all to speed up and make your decision-making a lot more accurate.
In real terms, advanced manufacturing analytics brings together data from all sorts of places, from your ERP system, to your MES, warehouse management, right down to those sensors on the shop floor. Now that’s joined up thinking – it lets manufacturers get a live picture of what’s happening, spot trends and make educated guesses about what might happen next – changes in demand, machine failures, production bottlenecks – you get the idea.
The aim is to shift from firefighting to getting ahead of the game. Instead of just reacting to problems when they come up, teams can see what’s coming, sort out the processes, and keep boosting efficiency, quality and profits across the whole manufacturing operation.
Manufacturing’s gotten a whole lot more complicated – operations are now stretched across production, supply chain, warehouses and sales. Every one of these areas is running on its own separate systems and timelines, making it next to impossible to get a clear picture of what’s happening across the whole business at any given time.
And to make matters worse – manufacturers aren’t just expected to keep up with production demands, but to also respond fast to any changes in customer orders, supply problems, or production bottlenecks. In order to make quick decisions in these situations they desperately need access to the most up to date data – not outdated or patchy information.
The traditional reporting systems we’ve got just aren’t designed to handle this sort of coordination – they tend to work in little separate silos with each department working with their own data sets, which just makes it even harder to get them all aligned on the same decisions.
It’s here that advanced analytics has a vital role to play – it’s the only way to bring these different areas together into one place, so businesses can get a handle on performance across the board. This helps manufacturers to oversee their operations on a huge scale, and keep a grip on the complexity that comes with it.
Advanced manufacturing analytics can be broken down into several types, depending on how you’re using data to inform your decision-making. Each type builds on the ones that came before it – taking you from trying to make sense of what’s already happened, to anticipating what’s going to happen next, and finally to telling you what you should be doing next.
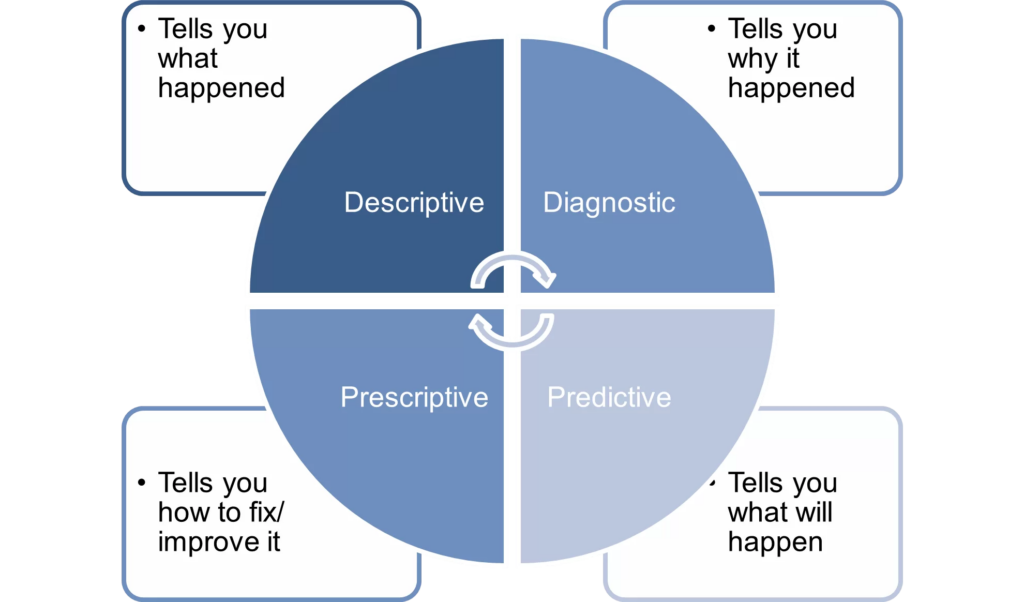
Descriptive analytics basically just looks at what has happened in the past – using historical data to track how things have been doing across areas like production output, sales, quality and inventory levels. This type of analysis is usually presented in some kind of dashboard or report that summarises the key numbers.
Diagnostic analytics on the other hand tries to figure out why things happened the way they did – by digging into the data to see what actually caused problems like production delays, or defective products, or backlogs of work.
Predictive analytics is all about forecasting what’s going to happen next. It’s a bit like taking what you’ve learned from the past and using it to make a pretty educated guess about what’s going to happen in the future – forecasting things like demand fluctuations, or machine failures or supply chain issues.
Prescriptive analytics takes it one step further, by actually telling you what you should do next. It’s all about using data, rules and optimization models to recommend decisions – like how to make the most of your production capacity, or whether to adjust your pricing, or how to get your inventory in order.
Together, these different types of analytics form a bit of a progression – from basic reporting to more advanced, decision-making type analysis. This lets manufacturers tackle some of the really complex things that are going on in their operations, with a bit more precision.
Manufacturing sales analytics can help give manufacturers a real sense of how demand for specific products is changing over time – and how that impacts the way they produce and supply their products. It lets strategy, sales and ops teams work together to pick out which product lines are growing the fastest, which suppliers are doing well and which ones might be struggling, and whether they have enough production capacity to meet demand.
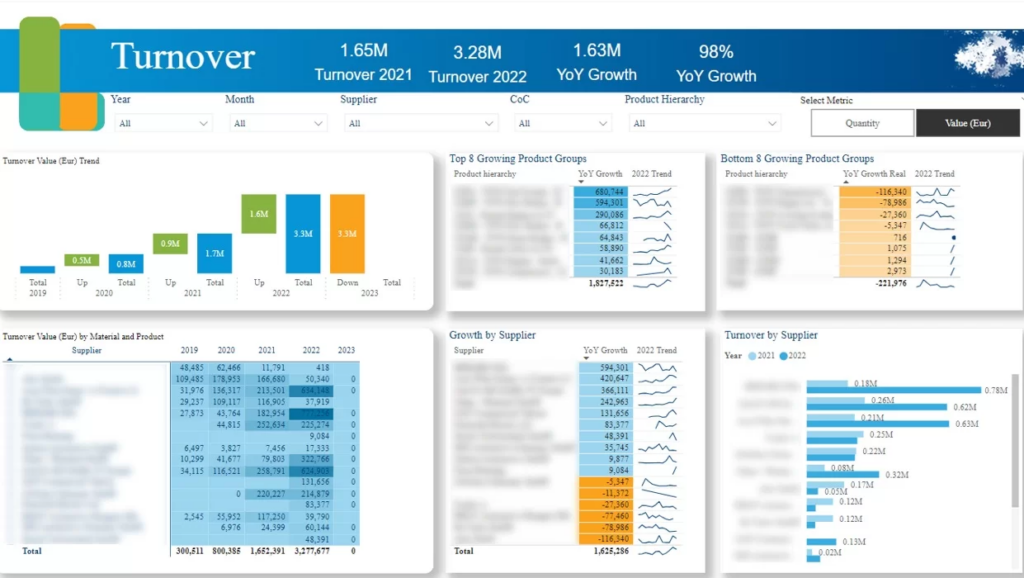
In this particular solution our Power BI consultants built a custom manufacturing analytics dashboard for a big manufacturing firm to help them figure out how their sales were growing from year to year. We hooked up sales data with info on products and suppliers so the dashboard can show the company’s revenue broken down by supplier, product and product group – and highlights the ones that are really doing well or stinking it up. We also factored in the ability to drill down to the supplier level or a specific product category to get a better sense of where demand is shifting and what’s driving the numbers up or down.
The main metrics we track are:
The big benefit is that our solution helps different teams align their demand, production and supplier strategy – so they can make sure they’re producing the right stuff in the right quantities and working with the right suppliers. This should help teams make better decisions about how to produce, who to supply with, and when to get more stuff made – and it should all be based on solid data rather than just gut instinct.
Manufacturing operations analytics gives manufacturers the tools they need to tackle production bottlenecks head-on and clear out backlogs by figuring out which orders to prioritise. It’s all about getting the ops, supply chain and sales teams all aligned on which customers and products deserve to get fulfilled first – and by how much.

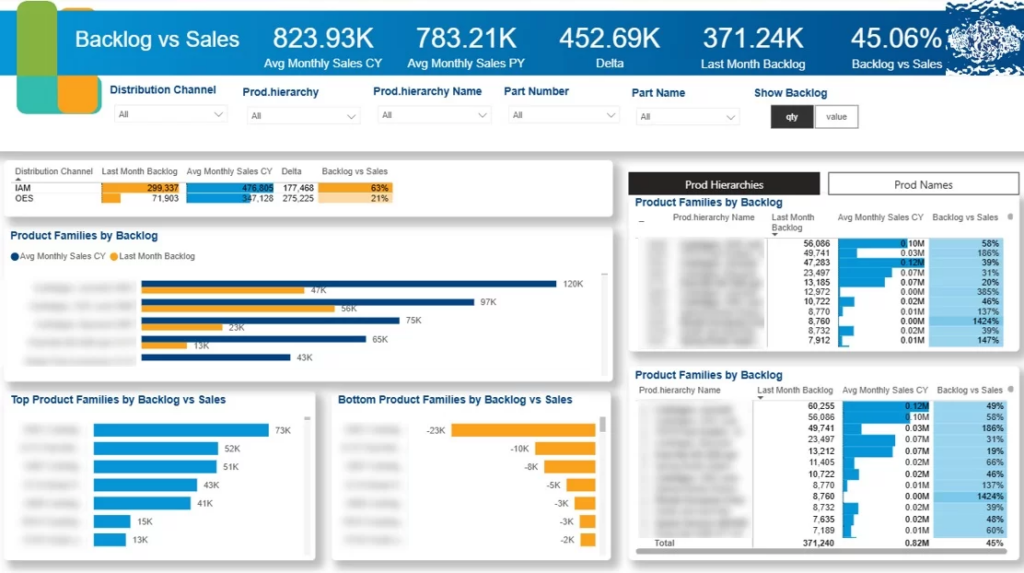
Our custom manufacturing analytics solution is built around a custom dashboard that digs deep into the backlog from all angles. We’re talking about a detailed breakdown of backlog by customer, by product and by the underlying reason for the delay – so you can see exactly where delays are happening and why. This lets you focus on the big-spending customers, work out which products are driving the backlog and get to the bottom of what’s causing delays in the first place.
On the screenshot below, we also compare the backlog against average monthly sales to see if you’re making progress on getting on top of things before new orders come flooding in.
The Important Numbers:
The big benefit here is that you can finally get a handle on controlling your backlog & making production planning work for you. Teams can focus on serving up the biggest bang for their buck to your best customers, see if they’re making progress on reducing backlog or if the problem’s getting worse relative to demand, and use that insight to make informed decisions on production and supply chain that actually sort out order fulfillment for good.
Manufacturing quality analytics is a vital tool for manufacturers, helping them get to the bottom of where defects are coming from & cut down on the cost of poor quality. It lets the quality, production and operations teams zero in on the issues that are most frequently being raised and cost them the most, whether that’s affecting a product or a customer.
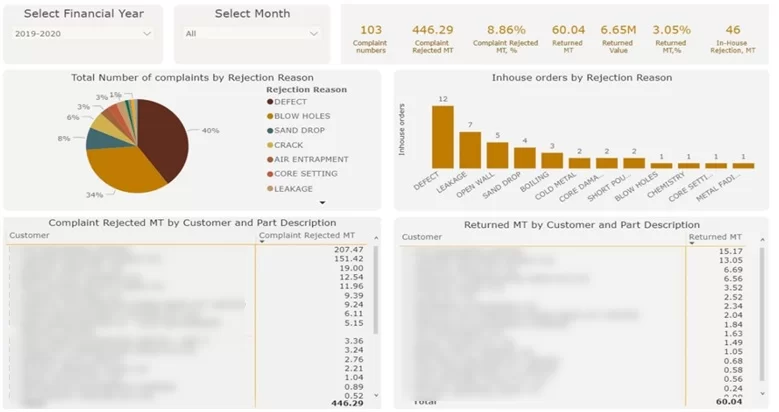
In this solution, our team built a custom dashboard that lets you dive into product rejections and customer complaints in detail. The dashboard breaks down rejection reasons like defects, blow holes, sand drops & cracks, giving you a clear picture of just how much it’s costing to have to return items and what’s behind it all. It also lets you drill down on rejections and complaints by customer & part, so you can spot where quality issues tend to crop up most often & who’s being hit hardest.
Key metrics:
The main benefit of this solution is that you can finally tackle quality issues in a targeted way and cut down on costs. Teams can focus on the defects that are most frequently occurring & most costly to fix and get to work on fixing them in the production process.
Manufacturing predictive maintenance analytics is a game-changer for manufacturers: it lets them keep a watchful eye on their equipment and only schedule maintenance when it’s absolutely necessary. This means they can avoid those costly and frustrating – unplanned downtime – events and keep their equipment running smoothly for years to come.
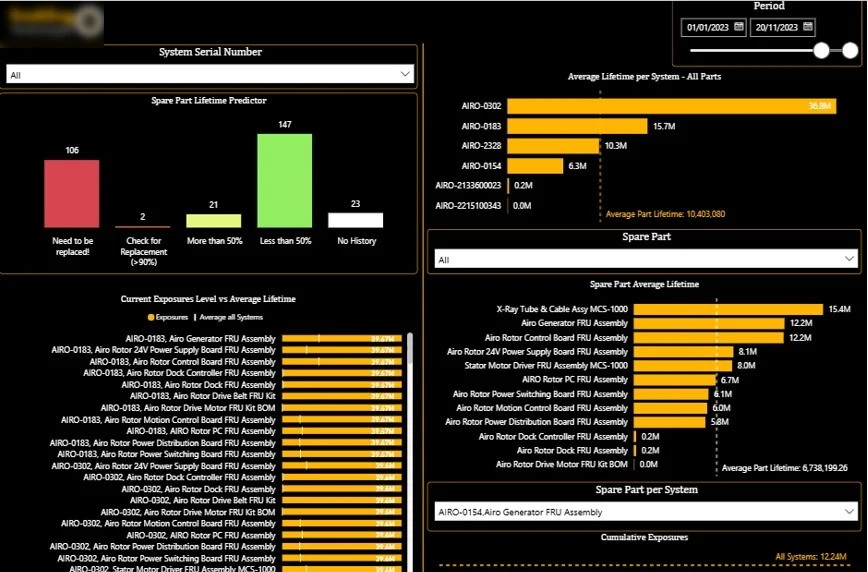
We’ve built a custom Power BI manufacturing dashboard that tracks how worn out each machine component is – based on how many times they’ve been cycled. The analytics we’ve built in compare those numbers to how long the component is supposed to last and flag the parts that are running hot. That dashboard also groups components by how quickly they need to be replaced – so maintenance teams can see at a glance what needs to be done and when. Plus it shows them a history of each component’s cycles – so they can get a sense of when the right time to replace it is.
Key metrics:
The real win here is that maintenance teams can plan their work way more effectively. They can spot parts that are in trouble early on, swap them out based on the actual wear and tear, and avoid those emergency breakdowns that always seem to happen at the worst moment – all while keeping their equipment running like clockwork and their maintenance team working more efficiently.
Manufacturing warehouse analytics really comes into its own when it helps manufacturers get their inbound logistics and warehouse space under control, so to speak. You can imagine being able to keep an eye on your storage space and plan deliveries so much more easily with this kind of system- and thats exactly what it does. It lets your warehouse and ops teams track space usage, figure out where to put new deliveries first and sort out any bottlenecks as they happen.
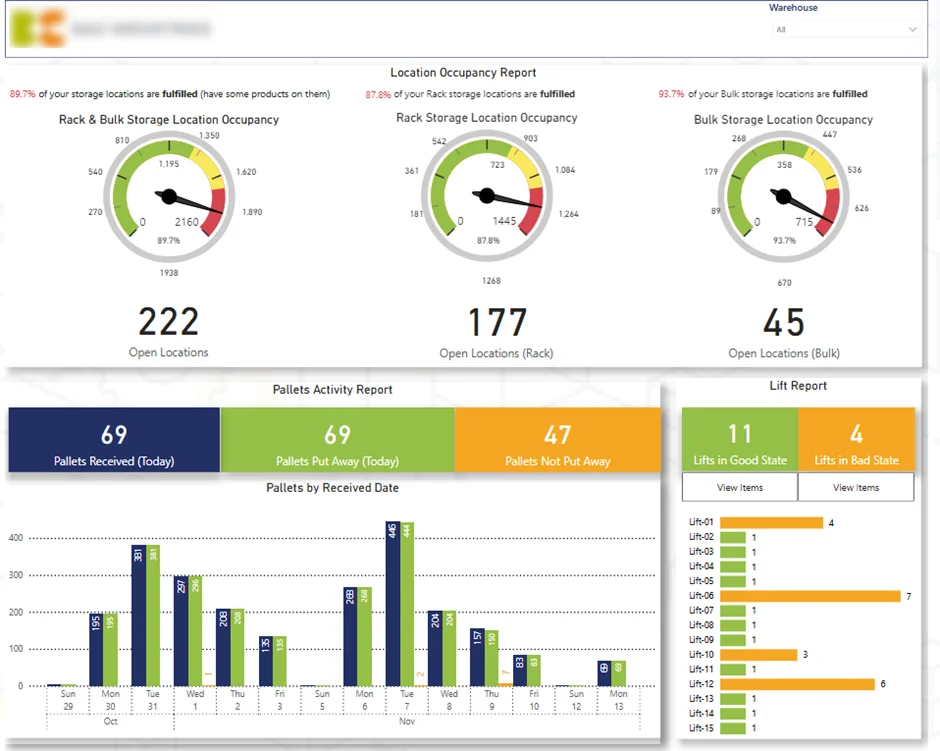
In the solution we came up with, reporting and analytics experts built a custom dashboard that helps you keep an eye on your warehouse activity and storage room availability. That lets the teams see what’s going on with the current inventory and how much space is free across racking and bulk storage – so they can spot any space problems as soon as they come up. We also have a part that shows the number of pallets coming in each day and highlights any palates that haven’t been put away yet, and there’s also a feature that lets you keep track of the items on forklifts, so you can quickly find and process them.
Key metrics:
With this system, the main benefit is that your warehouse just runs a lot more smoothly and you make better use of the space you have. That means you can schedule deliveries with confidence, cut back on congestion in your receiving areas and get rid of any bottlenecks quickly to keep the flow of goods moving steadily through the warehouse.
Manufacturing supply chain analytics is all about giving manufacturers a clear idea of where their materials and components come from – and what that does to their bottom line in terms of cost and risk. It lets procurement and supply chain teams make the best possible supplier choices, wrangle those costly imports, and keep a tight grip on profit margins so to speak.
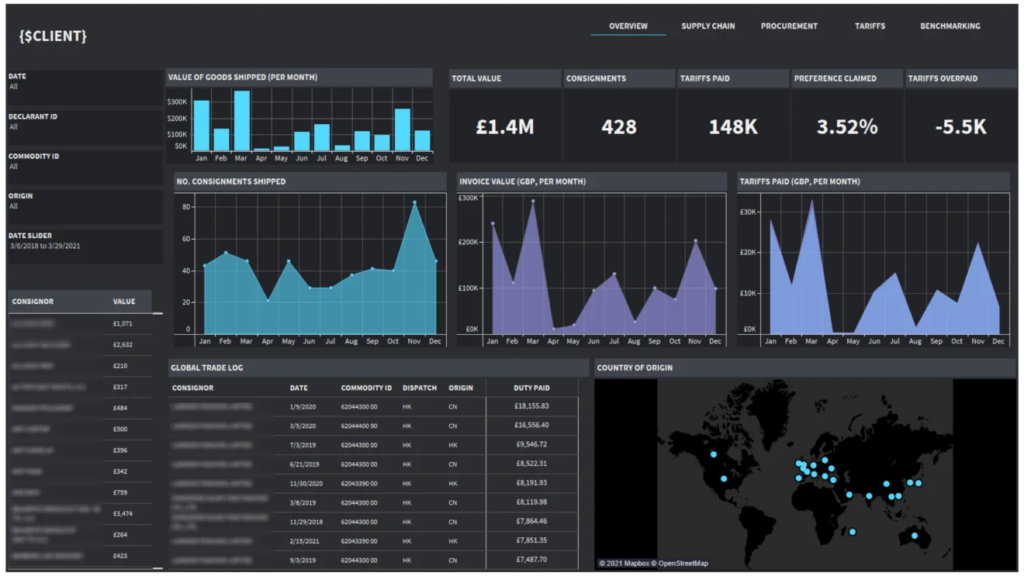
Our Tableau consultants built a custom dashboard to drill down into purchasing patterns and get a better understanding of where our clients are sourcing goods from geographically. The dashboard tracks goods by country and gives us a clear picture of monthly shipment value, number of consignments and import tariffs paid. It also highlights imports that fall under preferential trade agreements and lets us see how the tariffs paid out stack up against what we’re eligible to pay.
Key Performance Indicators:
The main advantage here is improved cost management and supplier strategy. Teams can spot where sourcing is really expensive, use that to inform supplier choices and cut costs even further, plus recover from overpaid duties – all of which adds up to more efficient supply chains and better profit margins.
Manufacturing demand forecasting gives manufacturers the tools to figure out what they need to make in order to meet customer demand. It lets the planning and ops teams get on the same page and make sure their production line can keep up with what they think the customers are going to want. This means they can cut down on backlogs and get things delivered on time a whole lot more often.
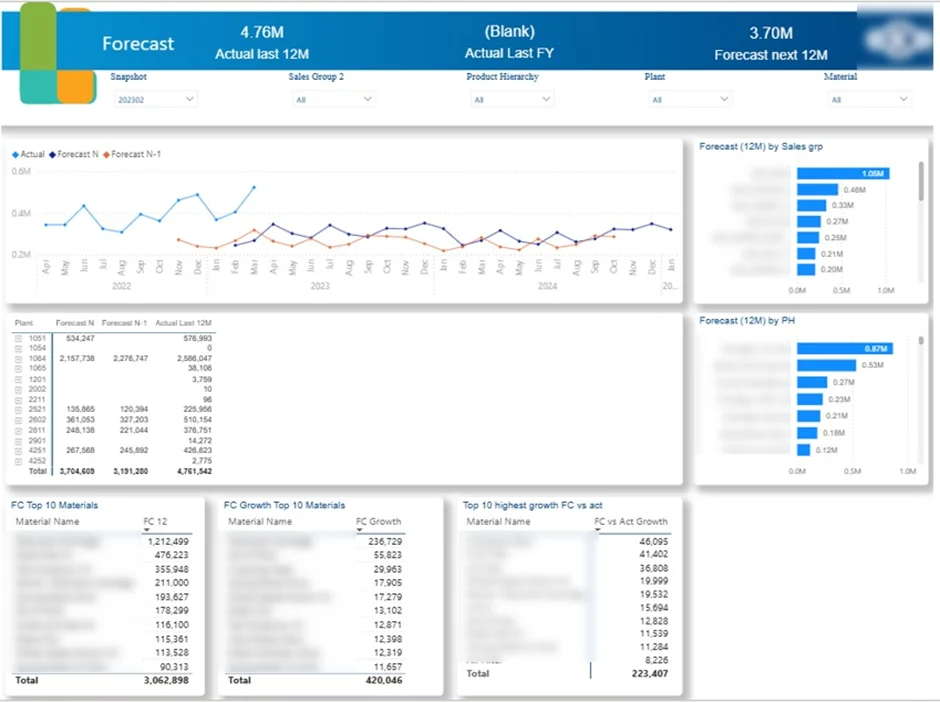
Our data consultants built a custom Power BI dashboard to help make sense of forecasted demand for all the individual parts that go into the products. This dashboard takes the raw data and gives it some context, making it easy for the planners to see which parts need a boost in production and which ones they can slow down on. It also helps them spot patterns in the demand, so they can make sure they’re focusing on the right products to make the most of their time and resources.
Key metrics:
The big payoff here is that they can plan for making things a lot more accurately. They can figure out what they need to make, and make sure they’re making the right things at the right time. That means they can cut down on backlogs, make sure they have the right stuff on the shelves or in the warehouse, and get customer orders delivered on time more consistently.
Manufacturing price optimization analytics is a game-changer for manufacturers, helping them get their pricing just right – not so high that it drives customers away, but high enough to maximise their margin and stay competitive in the market. They also give commercial and finance teams the insight they need to understand just how much of a difference their pricing decisions make to demand, profit and customer behaviour.
A typical solution does a deep dive on pricing performance across all the areas that matter – individual products, specific customers and different regions. The dashboard then uses a combination of sales data, cost data and demand patterns to show exactly how a price change will affect both the volume of sales and your bottom line. It also flags up any products that are being sold too cheaply or too expensively, letting your teams adjust your pricing strategy based on hard facts rather than just guesswork.
Key metrics:
Manufacturing product development analytics takes the guesswork out of making new products and gives manufacturers a much clearer idea of what works and what doesn’t. By using real data instead of hunches, engineering, R&D, and product teams can make better informed design decisions that actually meet customer needs – and boost performance, cut costs, and keep customers happy.
Typically a solution will be fed data from various places – product testing, the production line and actual feedback from customers. And that data gets looked at to spot any patterns in how a product is actually performing. The overview page puts all this together – defects, returns and how people are actually using the product – so it becomes easy to see which bits need tweaking. And it’s also super useful for keeping an eye on whether changes to the design are actually making things better or worse over time.
Key metrics you’ll be looking at:
We’ve said so much about data and analytics in manufacturing, but where exactly does all that data come from? The table below summarises it.
| Data Source | Data | Usage |
| Machine Logs | Run times, idle times, counts of cycles, error codes | Determine the overall efficiency of a machine and the source of delays |
| Sensor Data (IoT) | Temperature, pressure, vibration, speed | Bring about early failure detection and maintenance of production conditions |
| Production Reports | Output counts, reject rates, rework rates, shift performance | Compare line efficiency and performance of a team or shift |
| Quality Inspection Data | Defect types, measurements, tolerances, pass/fail rates | Trace quality problems to machines, material, or processes |
| Maintenance Logs | Compare the line efficiency and performance of a team or shift | Schedule preventive maintenance based on updates, thereby extending machine life |
| Energy Usage Data | Power consumption by the machine and the production line | Eliminate unnecessary power consumption, thus working towards sustainability |
| Supply Chain & Inventory | Material levels, delivery times, and stock movements | Match production with demand to avoid stockouts or overstocking |
1. Production Efficiency
2. Quality
3. Maintenance
4. Cost
5. Supply Chain
Advanced analytics helps manufacturers do a whole lot better at managing their operations – by taking data and turning it into actual, useful insights that they can act on. It gives their teams a much clearer view of what’s going on in production, the supply chain, and quality control – which lets them spot problems early and make some really informed decisions.
Catching Problems Early In The Game
Advanced analytics lets manufacturers identify issues in production, equipment, or the supply chain before they get out of hand – thanks to tools like anomaly detection that flag up unusual patterns in machine performance, output, or quality. This way, teams can take action before problems start to cause real problems.
In one project we worked on, we used analytics to dig into machinery usage and performance data – and that helped a client spot a slide in usage before it had a chance to do any real damage. This let them take proactive steps that ended up boosting customer engagement and increasing service revenue by a very respectable 20% – so that’s definitely a good outcome.
Making Better Decisions
Now, when manufacturers have all their data integrated across production, the supply chain, and sales, they can make decisions that are backed up with real facts and figures. This helps them get production planning, maintenance scheduling, and resource allocation spot-on, based on how things are really panning out in the real world.
We worked with a client who saw their turnaround time for making strategic decisions go from pretty slow to super-faster – 40% faster, in fact. And at the same time, they managed to cut down on their executive review cycles by two whole days a week. They got this by putting in place real-time analytics dashboards.
Getting Your Products Right
Analytics can help track down the patterns behind defects, variations, and quality issues on production lines. And when you understand these patterns, you can start to get your processes nice and consistent – which reduces the number of dodgy products and customer returns you get.
We worked with a client who saw a massive 80% cut in data-entry errors – and their data integrity went up to a very healthy 99.7%. This meant they could get on with reliable quality analysis and consistent production insights with a lot less hassle.
Cutting Costs
When manufacturers look at production efficiency, material usage, and machine performance – using analytics to get to the bottom of things – they can cut down on waste, reduce rework and get more out of their equipment. This all adds up to a nice, efficient operation without the need for any sacrifice in output quality.
One example that comes to mind is a client who automated their data processes – which meant a lot less manual work and reporting effort. In the end, this helped them knock 95% off the number of tasks they needed to do to consolidate data, and freed up a lot of time across teams.
Getting Products To Market Faster
Advanced analytics can help manufacturers pin down bottlenecks in production and supply chain processes – which lets them fix problems and get products to market way quicker.
We worked with a client who saw a real benefit from improving reporting and data access – their report preparation time went down by over 50% – which meant teams could respond faster and get projects moving along without any hold-ups.
Getting to grips with advanced manufacturing analytics isn’t easy , especially when you’ve got a whole load of data, systems, and processes that’ve built up separately over time. Tackling these challenges is all about finding a balance between the tech and the business side of things.
Data Silos – A Real Problem
Manufacturing data tends to be scattered all over the place – in ERP systems, MES, warehouses, and other places. But the problem is they don’t play nicely with each other – they don’t communicate easily, and this makes it a real challenge to get a clear and reliable view of whats going on.
One way to tackle this is to bring all that data together into a single platform – a data warehouse or unified data platform. Through data warehouse consulting, manufacturers can design and implement the right architecture, then use APIs or automated pipelines to get all that data flowing into one place, where it can be analysed consistently.
Poor Data Quality – A Big Headache
You cant trust your analytics if the data is rubbish . This happens when data is manually entered or split across multiple systems, and it can lead to some pretty shoddy conclusions.
To avoid this, you need to get automated data pipelines in place, set up some validation rules, and standardise your data structures. By reducing manual input using Robotic Process Automation and creating one source of truth, you can be sure that the outputs of your analytics are reliable and trustworthy.
Real-Time Data – A Must-Have
A lot of manufacturing processes rely on out-of-date or batch data, which means you cant respond quickly to changes on the shop floor.
To sort this out, you need to get your data flowing in real-time, straight from the systems and sensors on the shop floor. This means streaming that data into your dashboards so you can see what’s going on and make decisions in real-time.
Complexity Is A Big Barrier
Advanced analytics projects often involve loads of different systems, stakeholders, and data sources – which can make the implementation a nightmare.
A good approach is to start with a small, focused use case, like monitoring your production or demand planning, and then build gradually from there. Using tools that scale and a modular data architecture can help you manage the complexity as the solution grows.
Lack of Expertise – A Common Problem
Lots of manufacturing teams struggle with data engineering, analytics tools, or advanced modelling techniques, which can slow down adoption.
You can address this by providing training, hiring some specialist roles, or working with outsourced data analytics experts. It also helps to have clear documentation and dashboards that are easy to use, to get your teams up to speed with analytics.
Resistance to Change – A Challenge
When you introduce analytics into a well-established manufacturing process, teams are often hesitant to go along with it – theyre used to the old way of doing things.
To overcome this, it’s really important to get your users involved from the start, show them the value through practical use cases, and design a solution that works with their existing workflows. This helps to make sure that analytics adoption is successful in the long run.
The key to a successful advanced manufacturing analytics roadmap is to nail three fundamental steps.
Step 1: Define Some Real Targets
When it comes to implementing analytics in manufacturing, it all starts with having a very clear idea of what you want to get out of it. That means tying analytics directly to things that actually matter – like reducing downtime, or making your forecast predictions more accurate, or even lowering defect rates.
And when I say clear, I mean really specific. Instead of just saying “improve efficiency”, try saying something like “cut downtime on all production lines by 25%”. That way, your analytics have direction and its a lot easier to gauge success.
Step 2: Get Your Data House in Order
Data is the foundation of all advanced manufacturing analytics, but having a lot of data doesn’t cut it. You need to check whether your data is actually helping you meet the goals you set out in Step 1.
If your data is a mess, incomplete, or siloed, advanced analytics just won’t give you the insights or support the real-time decision-making you need.
Step 3: Choose the Right Tools for the Job
You don’t want to waste your money on tools that don’t work with your current setup, or that are way too complicated for your team to use. For dashboards, you can’t go wrong with Power BI or Tableau, especially if you’re connecting to manufacturing data sources.
You’ll probably need some custom connectors, data pipelines and maybe third party platforms to get machine data in there, integrate systems, and make real-time analytics happen.
But if you want to get real value out of advanced manufacturing analytics fast, consider working with a data analytics consultancy that knows how to get systems talking, structure data and build solutions that actually make sense for manufacturing operations.
To get real value from advanced manufacturing analytics, it’s worth following some practical principles that will make sure the solutions are rock solid, able to scale, and aligned with the way you operate.
Start With A Clear Use Case
Begin with a specific problem, rather than trying to tackle everything at once. Pick use cases like sorting out backlogs, improving quality, or fine-tuning production planning – that way you can see the impact analytics is really having.
Build A Solid Data Foundation
Make sure data from all your systems – ERP, MES, warehouse and shop floor – is spot on and can be trusted. Standardising data makes it easier to get to the bottom of things, and stops analysis from getting held up by confusion.
Pull All The Data In From Under The Rocks
Get all the data into one place, like a data warehouse. This gets rid of all the separate silos and gives you a single view of the way your operation is running. From there, you can look at production, supply chain and sales as a whole.
Get A Live Picture Of What’s Going On
Make use of real-time or near real-time data wherever possible – that way you can mirror what’s happening on the shop floor right now. This lets teams keep an eye on performance and jump on issues before they become major problems.
Keep Those Dashboards Simple & Straightforward
Dashboards should be all about making decisions, not dumping a ton of data on the user. Keep it simple, use clear visuals, and stick to a handful of key metrics so users can see what to do, and do it quickly.
The future of analytics in manufacturing is all about getting analytics a whole lot deeper into those operations, crunching data faster, and making it a heck of a lot easier to make decisions. As factories get more and more connected up, analytics is going to be playing a vital role in knocking all these different parts of the business into line – from production, to the supply chain, to meeting customer demand.
One area which is really taking off is using real-time data from sensors and all those connected machines on the shop floor. This means manufacturers can be monitoring performance all the time and hitting the ground running to address any issues as soon as they come up – without having to wait around for delayed reports.
Another change we’re seeing is the growing use of predictive and AI-based analytics. Rather than just looking at what’s happened in the past, manufacturers are now starting to forecast future demand, spot equipment failures on the horizon and get their production planning up to speed using machine learning models.
We’re also going to see big improvements in how data gets integrated. More and more organisations are putting in place unified data platforms that tie together ERPs, MES, warehouse management systems and even external information. This is going to make it a lot easier to do consistent, scalable analytics right across the whole business.
And finally, analytics tools are starting to get more user-friendly – so non-technical people are starting to use them regularly. With better dashboards, more automation, and some good old- fashioned self-service you’re finding that more teams across manufacturing organisations are able to make use of data in their everyday decision-making without having to rely on technical gurus all the time.
Advanced manufacturing analytics is exactly what manufacturers need to get a handle on their complex operations – bring all that data together in one place, and give teams the info they need to make better decisions. From the factory floor to the supply chain and everything in between – it gives everyone a clear picture of how things are really going, and hands them the tools to take control.
If you’re thinking about implementing advanced analytics in your factory, the first step is to pick the one thing you want to tackle first – and then build a data system that can keep up with your operations and actually help you make informed decisions every day.
If you’d like some help with designing and launching a solution that’s tailored to your business, get in touch and let’s talk some more about how advanced manufacturing analytics can work for you.
Data analytics enables manufacturers to stay ahead of industry trends. By using forecasting models, they can accurately predict customer demand and allocate the necessary workforce and raw materials to meet it. These analytical tools also help optimise product availability and drive revenue growth.
Manufacturing data collection involves capturing information on production processes, equipment performance, and product quality. This data is crucial for streamlining operations, minimising costly downtime, and upholding high-quality standards.
This data is sourced from a range of systems, including equipment sensors, ERP platforms, supply chain logistics, and customer feedback. It can take the form of structured data, like numerical values and categories, or unstructured data, such as audio, video, and text.


