
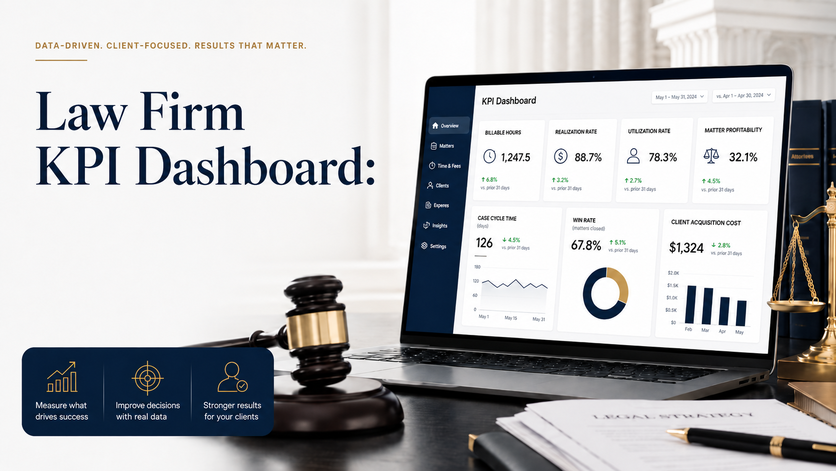
A law firm KPI dashboard gives your partners, finance team, and practice leaders one clear view of how the firm is actually doing. Rather than digging through billing reports, spreadsheets, intake data, and matter updates one at a time, a dashboard pulls the numbers that matter into a single place. When it’s built well, it helps you keep an eye on profitability, attorney productivity, client demand, and operational risks before any of them start eating into your revenue.
At Vidi Corp, we build custom dashboards that connect your finance, CRM, accounting, and operational systems into reporting tools you’ll genuinely use. We focus on the decisions you need to make day to day, not pretty charts that look good in a meeting and get forgotten afterwards. Across the projects we’ve worked on, automated reporting has cut down the hours spent pulling reports by hand, made the numbers more reliable, and helped teams act on what they’re seeing faster.
In this article, we’ll walk through what to include in a law firm KPI dashboard, how to set up the views that earn their place, which legal KPIs are worth tracking, and how to build something that works with the systems you already have.
A law firm KPI dashboard is a reporting tool that tracks the financial, operational, and client-related metrics that tell you how your firm is really performing.
It’s typically used by managing partners, CFOs, COOs, practice heads, marketing teams, and legal operations teams. Each role wants to see something slightly different, but the aim is the same for everyone: make firm performance easier to understand and easier to act on.
A strong law firm dashboard should cover:
The best dashboards don’t try to show you every legal KPI under the sun. They zero in on the metrics that actually help you make decisions about pricing, staffing, marketing, client service, and profitability.
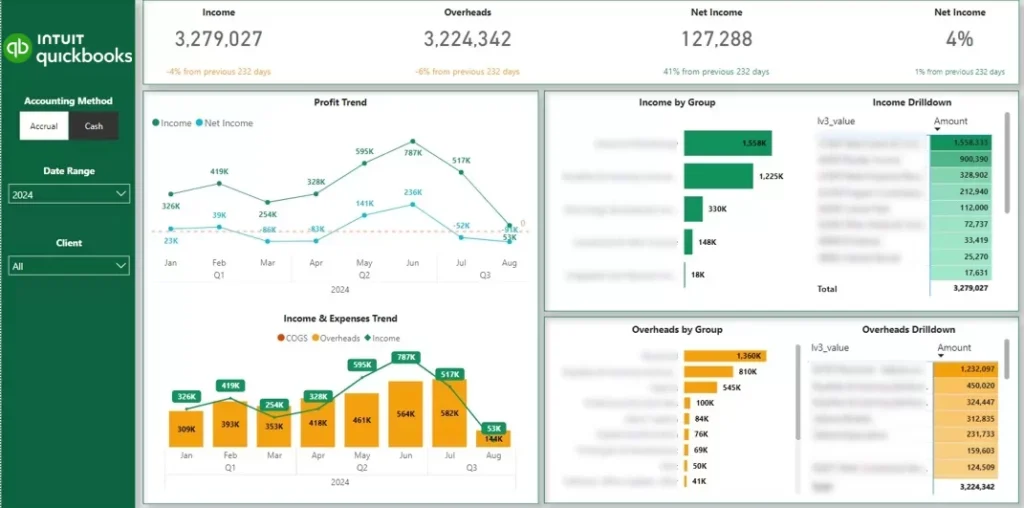
A law firm financial dashboard is all about revenue, costs, cash flow, collections, and profitability. It pulls together the numbers that tell you whether the firm is making money, holding onto it, and bringing it in fast enough to keep everything running smoothly.
At a glance, it should show you billed revenue, collected revenue, outstanding invoices, aged debt, write-offs, expenses, operating margin, and where your cash sits right now. The point is to see all of these side by side, because they only tell the full story together. Strong billed revenue doesn’t mean much if half of it is stuck in invoices nobody has chased, and a healthy margin on paper can hide a cash position that’s tighter than you’d like.
Our business intelligence developers connected a client’s QuickBooks Online data to Power BI for near-real-time financial and operational dashboards. The solution saved 4 hours per month, improved the value of customer reporting, and worked reliably after implementation. See this tutorial to learn how to install this financial dashboard for your law firm.
With this view in front of them, your finance team can keep billing discipline on track and catch collection problems early, before they turn into something bigger. They can spot the invoices that are starting to age, flag the clients who consistently pay late, and step in while there’s still time to do something about it. Instead of finding out about a cash flow squeeze when it’s already here, they get to see it coming and act on it.
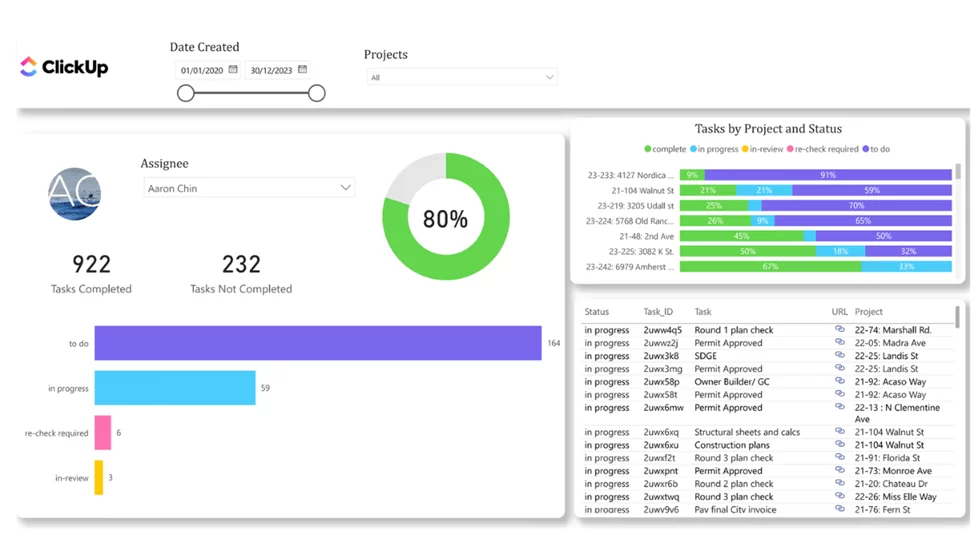
A project management dashboard shows you how your attorneys are actually spending their time. It’s one thing to know that everyone’s busy, but busy doing what? This view answers that question by laying out where the hours are going, so you can tell the difference between a team that’s genuinely stretched and one that’s spending its days on work that never makes it onto an invoice.
It should track billable hours, non-billable hours, utilisation rate, average hours per attorney, matter workload, and how everyone is tracking against their targets. Seeing these together is what makes the view useful. A high billable count looks great until you notice it’s coming from two people while the rest of the team sits well below target, and a low utilisation rate might make more sense once you can see how much non-billable work, like business development or supervision, is quietly filling someone’s week. See this tutorial to learn how to install this dashboard.
Partners can use it to get a real sense of capacity, spot when workload is piling up unevenly, and see whether teams are putting enough time into billable work or getting pulled in other directions. That makes the everyday decisions easier. When a big new matter lands, you can see at a glance who actually has room to take it on, rather than handing it to whoever happens to say yes. And if someone’s heading for burnout or coasting well under capacity, the numbers tend to show it before it becomes a problem you have to manage the hard way.
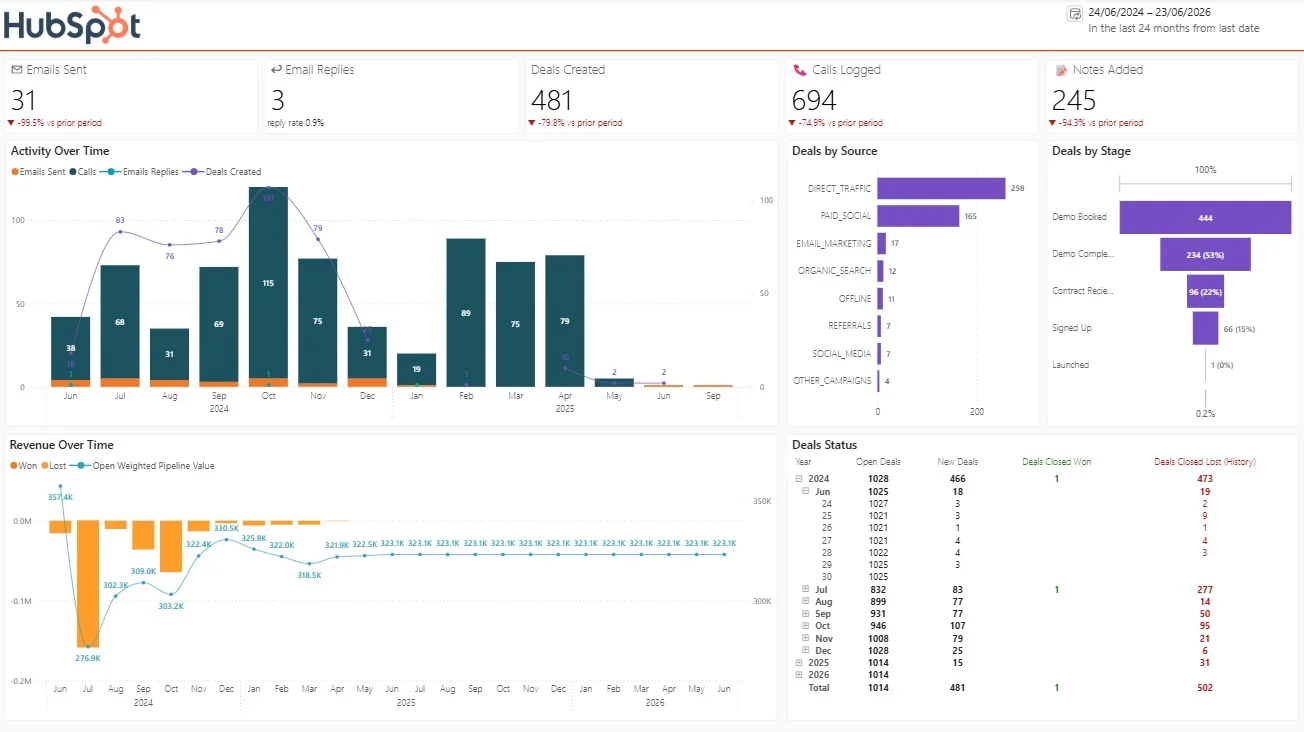
A marketing and intake dashboard tracks how potential clients move from that first enquiry all the way through to a signed matter. Every firm has a version of this journey happening whether they’re watching it or not, and the gap between firms that grow steadily and firms that spend a lot on marketing with little to show for it usually comes down to how well they understand it. This view makes the whole path visible, so you can see where prospects come in, where they drop off, and where the work that actually pays is coming from. See this tutorial on how to install this dashboard.
It should include leads, consultations booked, consultation attendance, conversion rate, source of enquiry, cost per lead, cost per signed client, and revenue by source. Looking at these together is where the picture gets interesting. A channel that brings in loads of leads can look like your best performer until you notice hardly any of them turn into signed clients, while a quieter source might be sending you a handful of enquiries that convert almost every time and bring in your most valuable matters.
Our data visualization consultants created automated Power BI reports from ERP data across finance, sales, marketing, procurement, and operations. One report helped the client identify an immediate EUR 50,000 cost-saving opportunity, and the analysis also supported 10,000 to 20,000 EUR in monthly recurring revenue opportunities.
This helps you understand which marketing channels are producing qualified, profitable work, and which ones just look busy. From there, the spending decisions get a lot clearer. You can put more behind the sources that bring in good clients, pull back from the ones draining budget for little return, and stop guessing about where your next strong matter is likely to come from. It also gives your intake team something to work with, because once you can see people booking consultations and then not showing up, you can fix that gap instead of quietly losing business you’d already paid to attract.
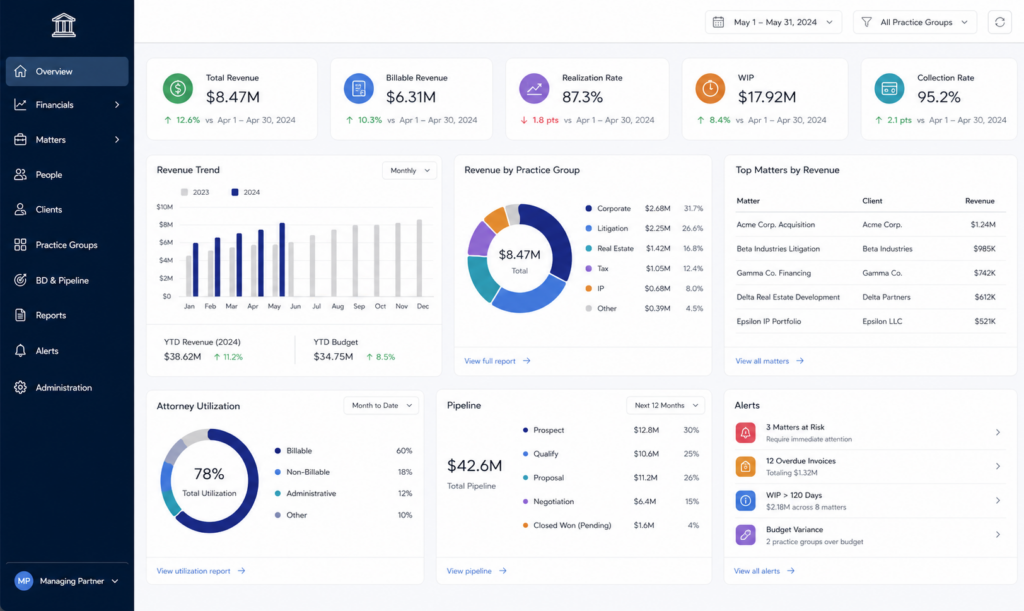
A managing partner dashboard is where leadership goes to see how the whole firm is really doing, all in one place. At a glance, you can see what’s coming in and what’s actually landing in the bank: revenue, fees billed, cash collected, the work sitting in WIP, and how much is tied up in aged receivables.
It also shows you how hard the firm is working and how well that effort converts into money, through billable hours, utilisation, realisation, and the profitability of individual matters. And because a firm-wide number rarely tells the full story, you can break it all down by practice area, partner, office, and client segment to see exactly where the strength is and where things are slipping.
A law firm KPI dashboard should focus on the metrics that directly affect profitability, productivity, client acquisition, and growth.
The table below groups the most useful law firm KPIs by category. Each category gives partners and managers a clearer view of a specific part of the business, from revenue and collections to attorney utilisation and client intake.
| Category | KPIs to Track |
|---|---|
| Financial KPIs | Revenue: Total fees billed or collected. Collected Revenue: Sum of client payments received. Accounts Receivable: Invoiced amount minus payments received. Collection Rate: Collected fees divided by billed fees. Realisation Rate: Billed fees divided by standard value of time. Profit Margin: Profit divided by revenue. |
| Operational and Utilisation KPIs | Billable Hours: Total client-chargeable time recorded. Utilisation Rate: Billable hours divided by available working hours. Average Billable Hours per Attorney: Total billable hours divided by number of attorneys. Work in Progress: Value of unbilled time and expenses. Matter Cycle Time: Matter close date minus matter open date. |
| Client and Marketing KPIs | New Enquiries: Count of new potential client leads. Consultation Booking Rate: Consultations booked divided by new enquiries. Client Conversion Rate: New clients divided by qualified enquiries. Cost per Lead: Marketing spend divided by number of leads. Cost per Signed Client: Marketing spend divided by new clients. |
| Growth KPIs | Revenue Growth: Current revenue minus previous revenue, divided by previous revenue. Client Growth: Current new clients minus previous new clients. Practice Area Growth: Current practice area revenue minus previous practice area revenue. Average Revenue per Client: Total revenue divided by number of clients. Client Retention Rate: Retained clients divided by clients at the start of the period. |
Start with the business questions, not the visuals.
For example:
This helps you avoid building a dashboard full of metrics that no one uses.
Law firms can build KPI dashboards in Power BI, Tableau, Looker Studio, or Excel.
Power BI is usually best for internal law firm dashboards. It works well when firms need to combine billing, accounting, CRM, and operational data into one secure reporting model.
Tableau is a strong option when advanced visual design and interactive analytics are a priority.
Looker Studio is useful for marketing and intake reporting, especially when the dashboard needs to combine Google Analytics, Google Ads, Search Console, and CRM data.
Excel can work for a simple legal KPI template, but it becomes harder to manage when data needs to refresh automatically from multiple systems.
A useful law firm dashboard depends on accurate source data.
Common data sources include:
The most important step is connecting these sources into a clean data model. Without this, partners may see conflicting numbers in different reports.
Every KPI needs a clear definition.
For example, one partner may define revenue as billed fees, while another may define it as collected cash. One team may calculate utilisation using total working hours, while another may exclude holidays, training, or admin time.
Document each formula before building the dashboard. This prevents confusion and builds trust in the numbers.
A managing partner does not need the same dashboard as a marketing manager.
Build separate pages for different users:
This keeps each view focused and easier to use.
A dashboard loses value if someone has to update it manually every week.
Automated data refresh means partners can review current performance without waiting for reports to be prepared. In previous Vidi Corp projects, automated reporting reduced report preparation time, improved data accuracy, and enabled more frequent reporting for clients.
For law firms, this can support faster billing reviews, better collections follow-up, and more consistent partner reporting.
We do not build dashboards that just look good. We design reporting systems that help partners make better calls on profitability, pricing, staffing, client acquisition, and growth. That experience runs deep: we have delivered more than 1,000 BI, automation, dashboard, and data integration solutions for over 600 clients, every one of them built on proven approaches to dashboard design, data modelling, QA, and automation.
A lot of law firm reporting falls down because the data is scattered across too many systems, so we connect it for you, building automated integrations across APIs, SQL databases, cloud data warehouses, Power BI, Tableau, Looker Studio, Excel, QuickBooks Online, Xero, Shopify, ClickUp, Zoom, and whatever else you run. Because those integrations and frameworks are ready to go, you skip months of manual build time and get to your financial, operational, matter, and marketing insights far sooner.
And whether the dashboard is for a partner, CFO, COO, marketing lead, or practice head, each view is shaped around the decisions that person actually needs to make, not just the data that happens to be in the system.
A law firm should track financial KPIs, operational KPIs, matter profitability KPIs, client KPIs, marketing KPIs, and growth KPIs. The most useful starting set includes revenue billed, revenue collected, collection rate, realisation rate, profit margin, WIP, AR ageing, billable utilisation, matter profit margin, lead conversion rate, cost per signed matter, and revenue by practice area.
A law firm KPI dashboard should include a firm-wide executive overview, financial performance, utilisation and productivity, matter profitability, pricing and rate analysis, marketing and intake performance, and growth trends. The dashboard should also include filters for attorney, practice area, office, client, matter type, time period, and marketing source.
Law firms often use Power BI, Tableau, Looker Studio, Excel, and reporting tools inside practice management, accounting, CRM, and billing systems. The best choice depends on your current systems, security needs, reporting complexity, and whether you need automated integrations from multiple platforms.
Yes. Small firms can start with a focused KPI dashboard that connects accounting, billing, and intake data into Power BI, Looker Studio, or Excel. The key is to keep the dashboard simple, automate data refresh where possible, and focus on a small set of metrics that influence profitability, collections, and client growth.
Attorney productivity can be measured using billable hours, billable utilisation rate, revenue billed, revenue collected, realisation rate, matter completion, task completion, effective hourly rate, and profitability by attorney. The best dashboards avoid judging productivity by hours alone and instead connect time worked to billed value, collected revenue, client outcomes, and matter profitability.
A law firm financial dashboard is a visual report that tracks financial performance across revenue, collections, expenses, AR, WIP, profit margin, cash flow, and revenue by practice area. It helps partners and finance leaders understand whether the firm is growing profitably and where cash, pricing, or collection issues need attention.


