
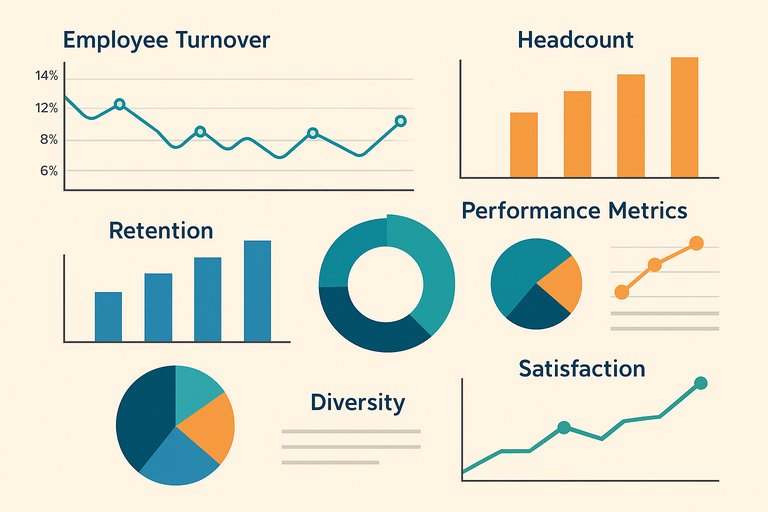
HR business intelligence helps organisations manage workforce data across multiple systems and processes. Data from sources such as HR systems, payroll platforms, recruitment tools, and performance tracking systems is collected, structured, and analysed through dashboards and reports. By bringing this data into a single reporting environment, HR business intelligence provides a consistent view of workforce performance, hiring, retention, and costs.
As a business intelligence consulting firm, we have delivered 1,000+ custom HR dashboards for companies across industries, including professional services, manufacturing, and recruitment. These solutions are designed to integrate multiple data sources, automate reporting processes, and provide reliable dashboards that support day-to-day HR operations.
This article explains how HR business intelligence is applied in practice. It covers key applications such as workforce analysis, recruitment analytics, performance management, and turnover tracking, along with real examples, tools, metrics, and implementation considerations.
HR Business Intelligence (HR-BI) is the practice of collecting, integrating, and analysing workforce data, such as hiring sources, turnover, engagement scores, and skills, to drive faster, evidence-based HR decisions that improve productivity and reduce costs.
It’s all about gathering info from HR systems, mixing it with other business numbers, and presenting it in a way that actually helps the decision-makers make an informed decision.
Many organisations rely on HR reports and assume they’re doing HR Business Intelligence. But there’s a big difference. Reporting gives you a snapshot of past activity. HR BI connects the dots, helps you dig deeper, and supports real business decisions.
| Feature | HR Reporting | HR Business Intelligence |
| Purpose | Track and present past HR metrics (e.g. turnover, hires, absenteeism) | Understand workforce trends, uncover root causes, forecast risks, and guide action |
| Data | Basic HR data in silos | Combined data from HRIS, ATS, surveys, etc. |
| Tools | Static reports, spreadsheets | Interactive dashboards, analytics platforms, and visualisation tools |
| Insights | Descriptive | Diagnostic, predictive, and prescriptive |
| Use Cases | Compliance, audits, HR status updates | Workforce planning, retention strategies, and performance tracking |
| User | HR teams | HR teams, business leaders, decision-makers |
Business intelligence is a total game-changer for HR teams when it comes to making sense of all that workforce data. As your company grows and grows, trying to keep track of everything through manual reporting is basically a recipe for disaster – it’s just too hard to keep an eye on things like headcount, performance, and costs across all sorts of different departments.
But using BI tools lets HR teams get a clear view of all the key performance metrics in one spot: turnover, recruitment, productivity and payroll to name a few. That makes it a heck of a lot easier to spot any patterns, compare how different teams are performing, and respond to changes as they happen – rather than trying to play catch-up afterwards.
Business intelligence really helps to make workforce planning a whole lot smarter, improves the hiring process, keeps a lid on labour costs and makes sure that your HR team is working hand in hand with the rest of the business to drive results.
HR business intelligence covers a wide range of applications, from workforce planning and recruitment to performance and retention analysis. Each area focuses on a specific part of how employees work and how teams are managed.
Below are the most common HR business intelligence applications, along with examples of how these dashboards are used in practice.
Employee engagement analysis is all about figuring out how employees spend their time and energy on different types of projects. It lets organisations get a handle on how engaged their teams are when it comes to making money versus doing internal stuff, and how well they’re using each others’ time. We use this type of analysis a lot in service-based businesses to give a boost to productivity, get the workload nice and balanced, and generally see how the team is performing.
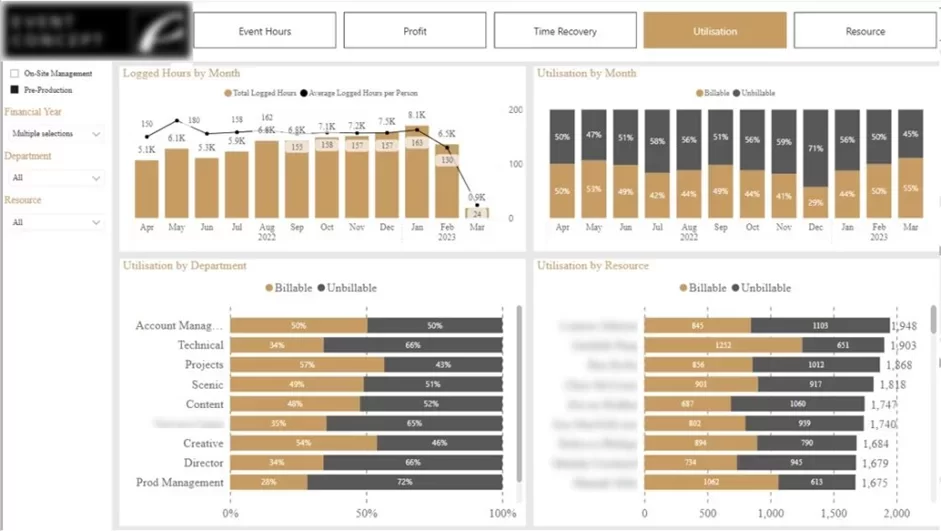
Our data visualization consultants built this dashboard for a client who needed a clear picture of just how their team was using their time. The dashboard takes a look at the total hours logged each month and splits them out into work that’s actually billable to customers and work that’s not. It breaks the data down by department and by individual employee, with filters so you can look at specific teams or time periods if you need to. It also gives you a clear view of how time is being spent on things like client work, admin, training, meetings and sales – so you can see where all that effort is going.
The main benefits of this kind of analysis include:
Workforce analysis is all about getting a handle on your company’s workforce situation – where your headcount is coming from, how much overtime people are putting in and how that’s impacting the business, and how absences are affecting the day-to-day running of things. This kind of analysis is a must-have in manufacturing and operational environments, where things need to keep chugging along smoothly and you need to be able to plan ahead for your staffing needs.
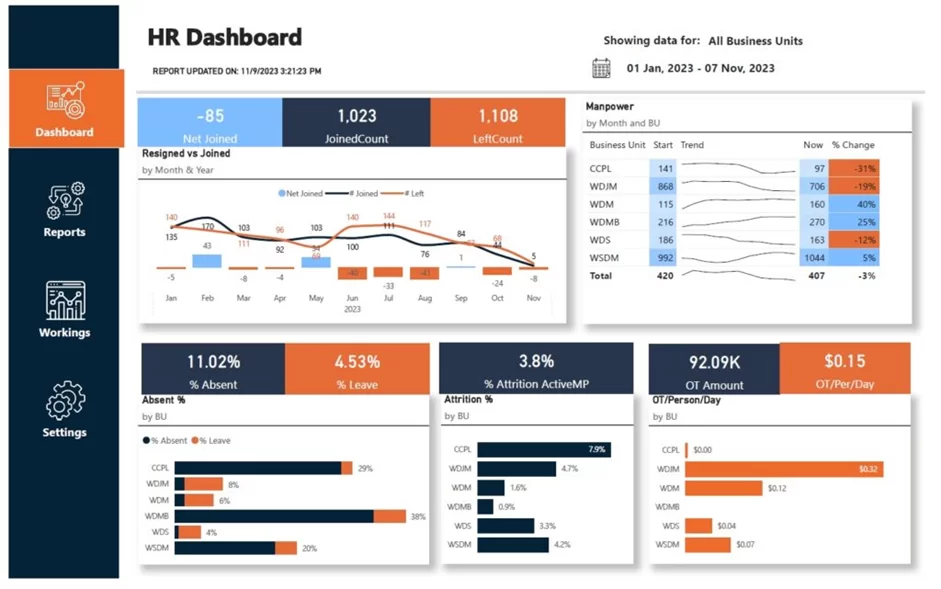
We put together this Power BI HR dashboard for a manufacturing client to give their HR team a real grip on workforce dynamics. It tracks all sorts of key metrics – overtime per person per day, how many new people have joined the business, the net headcount at the start and end of each period, and absence rates by department. Users can then use this data to drill down over time and across different departments to spot where the workforce is feeling the squeeze or where there might be a staffing gap emerging.
The benefits of this dashboard are pretty clear:
Recruitment analytics is all about drilling down into the numbers to see just how well your hiring channels are working – and how you can tweak the whole recruitment process to get better results for your buck. What you want to know is where your candidates are coming from, how they’re moving through the recruitment pipeline, and what it’s costing you to turn applicants into actual hires. This kind of analysis is a real game-changer when it comes to getting your recruitment spend in order and landing the best possible hires.
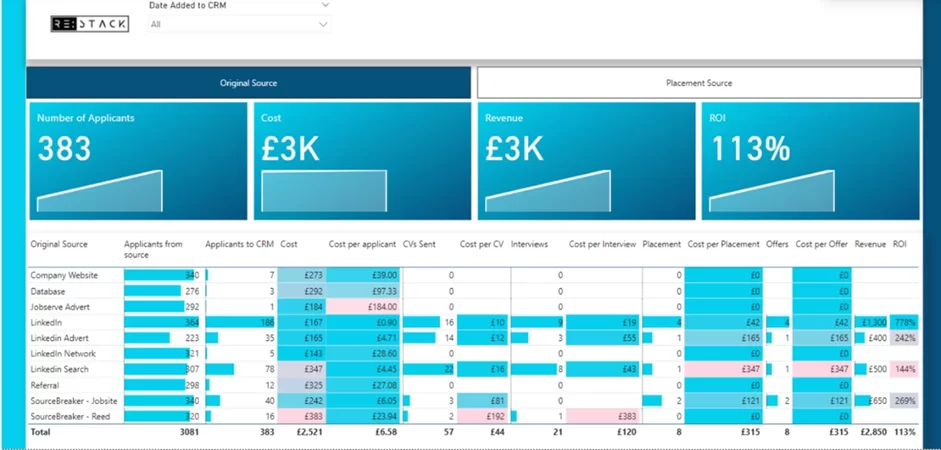
Our business intelligence consultants built this dashboard for a recruitment agency that needed some hard evidence to prove which hiring channels were actually delivering the goods. What we’ve got here is a rundown of where each new applicant is coming from, the costs involved in moving them through each stage of the process, and how many of them actually result in a job placement. We’re also comparing all the key costs – cost per hire, cost per offer, cost per placement – against the revenue coming in, which should give you a crystal clear picture of just which channels are performing best.
The main advantages of this dashboard are:
Compensation optimization is all about stripping back payroll costs to see exactly where your organisation is throwing its money. That involves taking a long, hard look at how payroll costs are being spread across different departments, projects, and business activities – and understanding the true cost of your workforce, not just what’s going straight into their pay packets. The upshot is that compensation is brought much more into line with how the business is performing – financially and otherwise. This sort of analysis is a common way for organisations to keep a tight lid on labour costs and boost profitability.
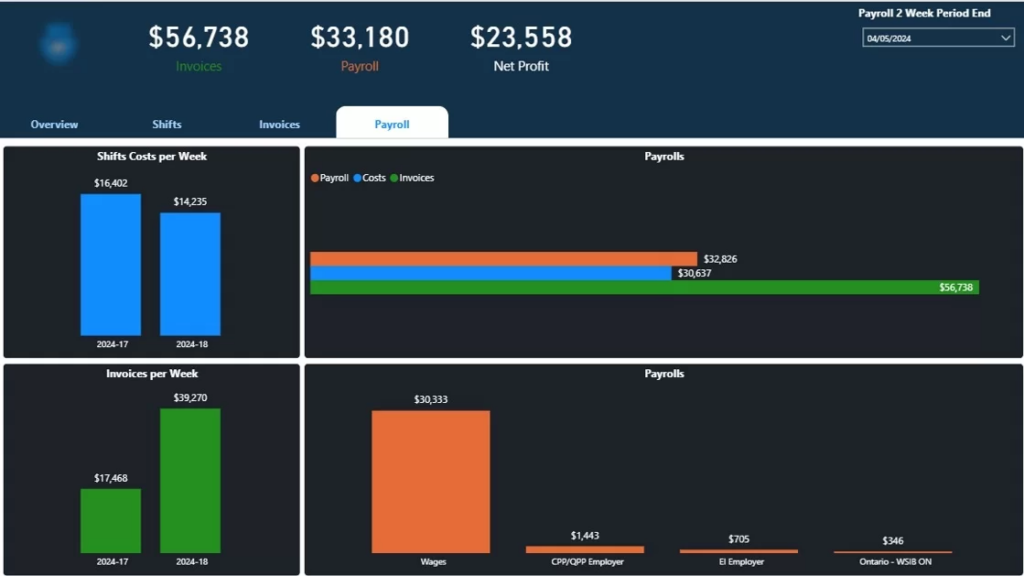
Our team put together this dashboard for a security services company so they could finally get a handle on their payroll structure. It lets them see the lay of the land with their total payroll costs, and how they’re breaking down into specific departments and services – and then they can start comparing labour costs against the revenue they’re actually invoicing. This dashboard also gives the lowdown on what’s going into the compensation pot, with breakdowns on wages, pension contributions, and employer-paid insurance – providing a comprehensive view of what workforce costs add up to.
The benefits of this dashboard are clear:
Turnover analysis is all about getting to the bottom of why employees are leaving and where they’re heading out of the organisation. Its main goal is to help HR teams figure out where their best people are jumping ship, why they’re walking out the door, and what the trends are over time. This kind of analysis is a real game-changer for any organisation looking to boost retention and make the most of their recruitment efforts.
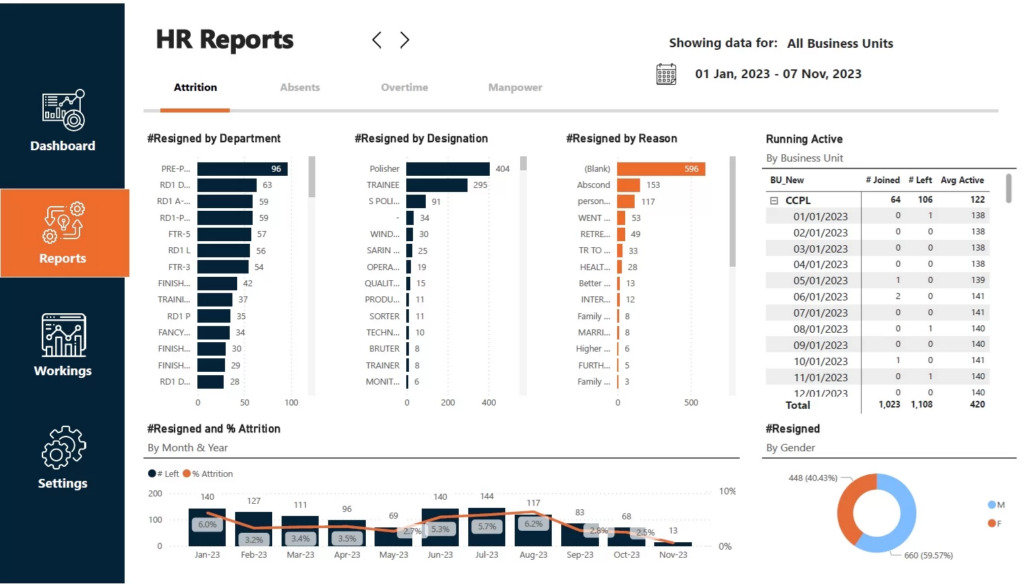
Our Power BI consultants built this dashboard for one of our clients so their HR team could get a crystal clear view of who’s leaving, and why. It breaks down resignations by department and job role, and even gives a reason for why they’re leaving – all so the team can spot the patterns and figure out where the real problems lie. And, just as important, the dashboard tracks how these trends are changing month by month – so they can stay on top of any shifts in their workforce.
The benefits of this dashboard are pretty straightforward:
Performance management analysis is all about getting a handle on how well employees are doing their jobs – and not just in terms of getting the work done, but how efficiently too. It gives organisations a clear idea of where work is flowing smoothly, where it’s not, and which staff members are hitting the ball out of the park and which ones are struggling to get off the ground. This kind of analysis is especially useful in operational environments where getting the most out of your team is a top priority.
We worked with a lawn care company, helping their HR manager get to the bottom of how their technicians were really doing. The resulting dashboard tracks the key numbers that matter – think chemicals applied per day, revenue per technician, and how long it takes to get a job done on a given patch of land. This lets the HR team do a pretty detailed analysis of each individual’s performance, as well as getting a good feel for how the entire team is doing.
The benefits here are really pretty clear:
Headcount analysis is about taking a close look at how your workforce is changing over time. Its main goal is to help your organisation keep track of hiring trends, employee turnover and the overall makeup of your workforce across different areas like departments, demographics and how long people have been with the company. This kind of analysis is pretty useful for helping your organisation plan its workforce for the future and stay on top of diversity issues.
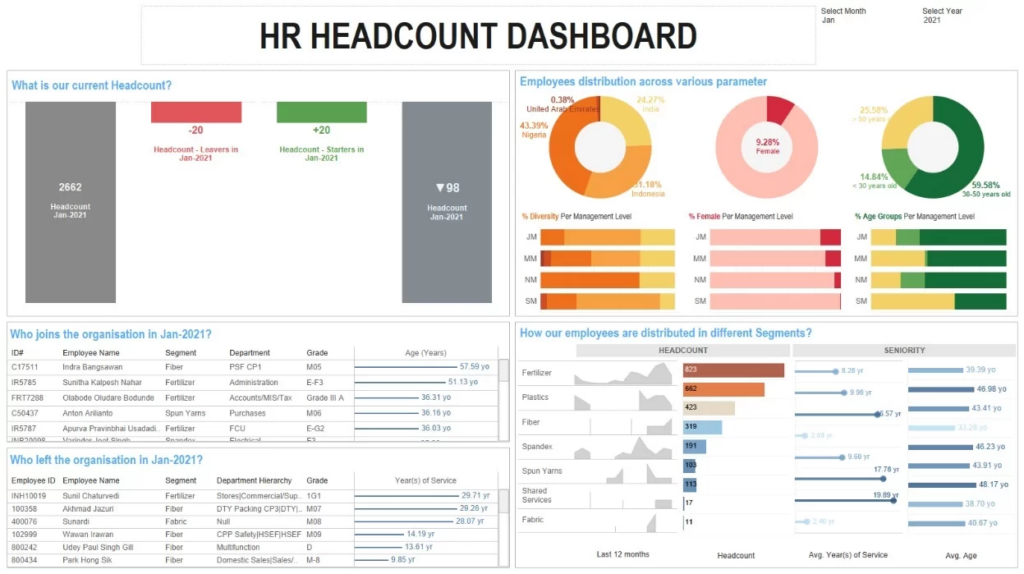
Our team built an HR headcount dashboard in Tableau that gives you a clear view of how your workforce is changing over time. It shows you the headcount at the start of the month, new people who joined, people who left, and the headcount at the end of the month. The dashboard also lists each individual who joined or left, breaks down headcount by age, gender and nationality and helps you spot trends in what kinds of people are being hired and how long they stay with the company in different departments.
The main benefits of this dashboard are:
When it comes to getting inside someone else’s recruitment pipeline – we focus on tracking all those open roles, seeing how hiring is going and how candidates are flowing through the system. This kind of analysis helps you get a better sense of how quickly positions are getting filled, where things tend to get clogged up and which ways of finding people are delivering the best results. We use this kind of analysis to try and make the hiring process more efficient and cut down on the risks associated with having empty positions for too long.
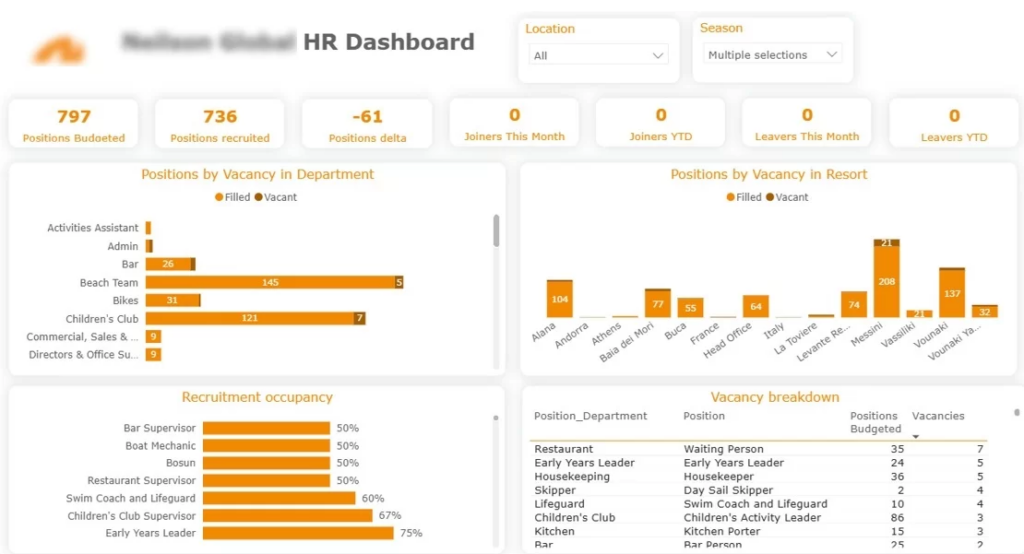
We built this Power BI recruitment dashboard for a big player in the packaged holiday game – a company that hires loads of seasonal workers every year. The dashboard keeps track of how many of each job role is filled or still unfilled, so recruiters can get straight to the point and see which roles need sorting as a matter of urgency. It also gives them a snapshot of which of their resorts are most affected by lack of staff, and that helps identify where staffing gaps might just start to impact how the place runs.
The main benefits of this dashboard are:
Diversity analysis is all about digging into how a company’s workforce looks from different angles – age, gender, and all the other factors that make a difference. It helps organisations notice that they might be doing things a certain way with certain groups that isn’t working out so well for others. This type of analysis is usually used to help make workplaces more inclusive and fair.
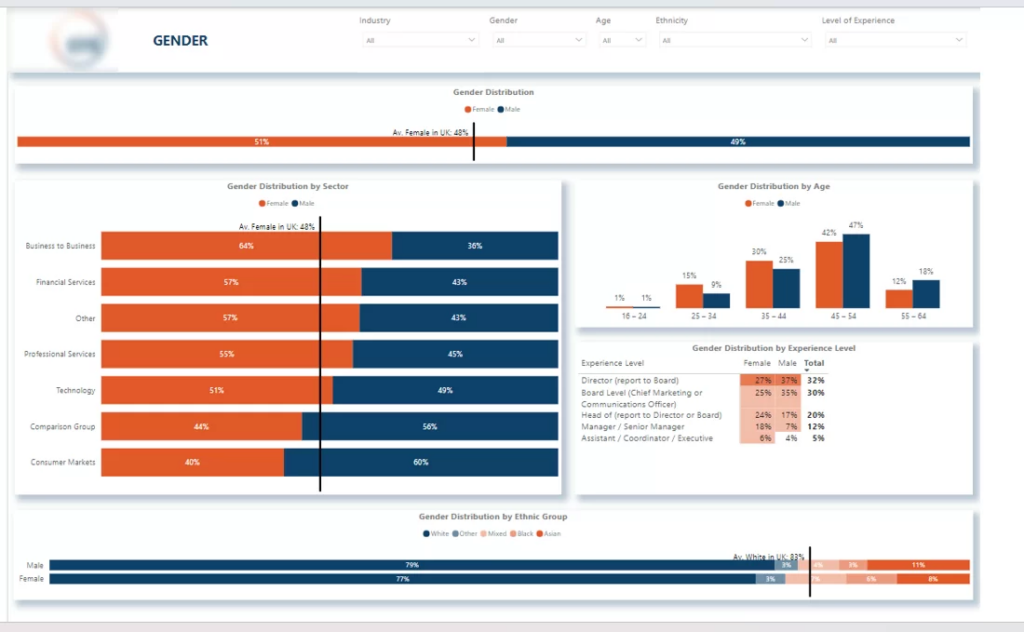
We created this Power BI HR dashboard for an agency that specialises in finding top marketing talent, and it’s powered by completely anonymous feedback from employees. We were able to get some really useful insights into how the workforce breaks down according to things like age, gender, sexual orientation and disability, and then dig into who’s left out and why.
The real value of this dashboard is:
Training effectiveness analysis is all about figuring out how employee training is really affecting performance, productivity and the bottom line. It lets organisations work out whether their training programmes are actually making a difference, and which ones are the ones to go for. It’s used to tweak training strategies and make sure the workforce keeps on getting better – and better.
Training dashboards usually mash up data from all sorts of places – like learning management systems, HR records and performance data. They keep an eye on things like how many people finish the training, how many people take part, and how work quality and productivity change over time. By comparing before and after results, organisations can see how individual programmes are making a difference, and where the weak spots are.
Some of the good things about doing this analysis are:
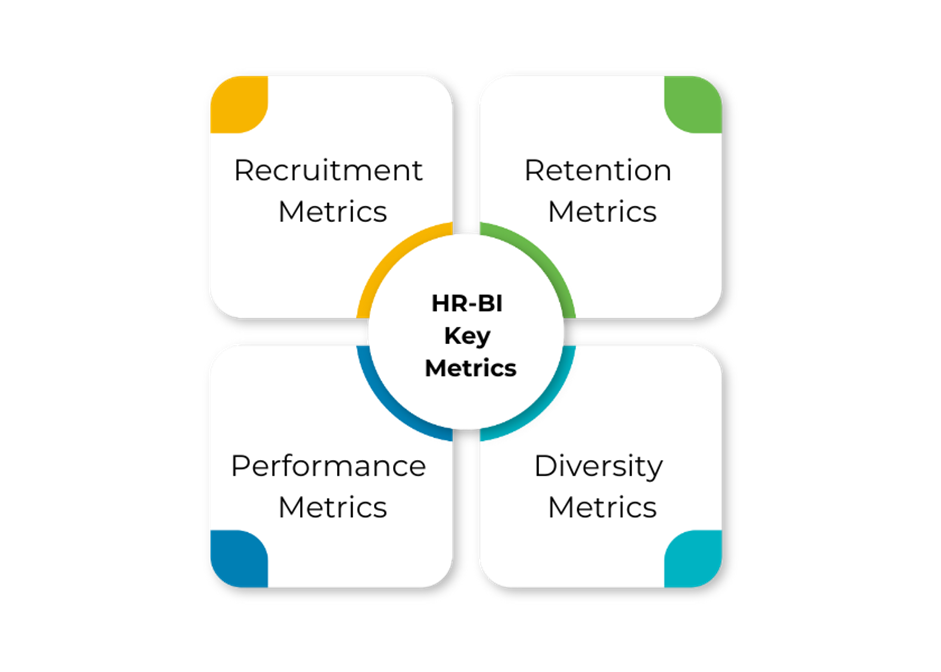
To derive value from your HR data, you must track the right KPIs—the metrics that truly matter to your business. Some of them are:
To get started with HR business intelligence, you need all these essential components:
Implementing HR Business Intelligence really helps to make sense of all that workforce data and get it organised in a way that makes sense for your organisation. It collects information from loads of different systems and puts it all in one place making it a whole lot easier to track how things are going, from performance and hiring to workforce trends across the whole business.
One of the key benefits is the huge time saving on reporting – it’s not unheard of for time spent on reporting to be slashed by 50% or more. In one case we had a client where automated dashboards basically freed up the team to deal with more pressing operational issues rather than getting bogged down in data prep.
Another advantage is just how fast you can get your hands on data. We had another client where report generation went from a 48 hour wait to under 5 minutes, this meant that the team didn’t have to worry about waiting around for weekly or monthly reports and they could work with the latest data on a daily basis.
HR Business Intelligence also helps out big time when it comes to making decisions – in one case a client reported a 40% improvement in speed of decision making thanks to real time dashboards and consistent access to data.
And finally, with automation you can dramatically reduce your operational workload. In one case an organisation saved about 10 working hours a month by automating reporting tasks and ditching the manual ones.
So overall, HR Business Intelligence helps organisations get a grip on all that workforce data, speed up reporting and generally keep everything under control.
To fully enjoy the benefits of HR BI and see massive ROI on it, you must overcome these bottlenecks that have held many back:
1. Dirty Data
Incomplete or inconsistent data leads to wrong insights that defeat the entire purpose of HR Business Intelligence. To keep your data clean, have regular data cleaning processes and validation rules at the point of data entry.
2. Siloed Ownership
When different teams own different data sources and give different meanings to the same data points, it becomes hard to connect all your data. So, before starting your HR BI adoption, make sure your team(s) agree on data definitions, BI goals, and access rules.
3. Change Management Hurdles
As your organisation grows or changes direction, your HR processes, tools, and goals will likely evolve too. If your BI system doesn’t adapt alongside these changes, it quickly becomes outdated. To avoid this, review your metrics, dashboards, and data sources regularly and update them anytime there’s a shift in business or HR strategy.

You can’t just invest in HR BI and assume it’s working. You need to measure what you’re getting back, and you can do so by following these steps:
HR business intelligence tools are a platform that help gather, make sense of, and present employee data in a pretty picture format. They can tap into all sorts of other data sources like HR systems, payroll software, customer relationship management tools, and spreadsheets, which lets organisations pull together all their relevant HR data in one place so they can actually use it for reports & analysis.
Power BI is super popular for building custom HR dashboards, particularly in places that live and breathe Microsoft. It lets you build strong data models, plays nice with loads of different systems, and gives you the tools to do some really detailed interactive reporting, which is exactly what we focus on in our Power BI consulting services.
Tableau is pretty well known for how well it lets you visualise data in a really useful way. You’ll see it used by organisations that want to do something a little bit different with their HR metrics, and want to be able to look at them in a flexible, visually appealing way from loads of different angles, similar to what we deliver through our Tableau consulting services.
Looker Studio is great for simpler reporting and also works really well for sharing things out with stakeholders, especially when you just need to get some stuff set up in a hurry. One of its strengths is that it lets you join up loads of different data sources into a really simple report that isn’t too hard to read, which aligns with how we approach Looker Studio consulting services.
In real life these tools get used to keep all your HR data in one place, automate the reporting side of things, and give you a clear, straightforward way to crunch through workforce trends across different departments and time frames.
Choosing the right HR Business Intelligence Analyst is just as important as laying the foundation for a properly functioning organisation. To get your organisation’s HR operation into clear focus you’ll need someone with both the technical know-how and a deep understanding of how your HR department tick – someone who can take all that workforce data and turn it into something that actually makes sense when presented in a report.
When on the hunt one of the things to really look for is an analyst with experience in working with BI tools like Power BI, Tableau or Looker Studio – someone who can link up multiple data sources, build a data model that makes sense, and craft a dashboard that’s user-friendly and actually meets the needs of your business – a skill set our Business Intelligence consultants take very seriously when developing dashboards.
It’s also super important that your new analyst is familiar with all the ins and outs of HR metrics and processes – be it recruitment, staff turnover, performance, and payroll. This is crucial for ensuring that the dashboards you end up with are actually tracking the right KPIs and helping with real-world use cases. Our team works closely with clients to nail down exactly what metrics will be most useful based on how their HR processes actually work day to day.
The ability to work with different data sources is also a big ask. HR data often lives across multiple systems, which is why it’s so important that your analyst is happy to pull data from HR platforms, CRMs, payroll systems and spreadsheets into one coherent reporting structure. That’s where our data engineers come in – to create custom data connectors and pipelines to make sure all the data gets fed into a single, consistent model.
Last but not least – look for someone who genuinely focuses on usability. Your dashboards should be easy to use – if not, you’ll be training employees for hours on end just to get them to navigate the data. Our dashboards are designed to be intuitive – no extra training needed.
HR business intelligence gives you a structured way to manage workforce data across recruitment, performance, turnover, and costs. With the right dashboards in place, you can track what is happening across your organisation and maintain control as your business grows.
At Vidi Corp, we build custom HR dashboards based on your actual data, systems, and processes. Our team handles everything from data integration and modelling to dashboard design, ensuring you get a solution that works for your organisation.If you’re looking to implement HR business intelligence or improve your current reporting, contact us to discuss your requirements!
HR Business Intelligence uses workforce data to guide smarter HR decisions and actions.
Start by centralising your data with a BI tool, defining clear metrics, and tracking trends and performance.
Metrics can include time-to-fill, attrition rate, impact of training, engagement score, and cost-per-hiring.


