

Plenty of teams turn to Tableau automation to get out of manual spreadsheet reporting, usually as one part of a wider business process automation push. It can take most of that work off your plate, but not on its own. How much it actually automates comes down to how you set up your connections, your data prep, and your refresh schedules.
As a Tableau consulting services company, we have built Tableau dashboards for finance and operations teams across the UK, US, and beyond. Our work replaces manual reporting with dashboards that pull sales, finance, operations, and marketing metrics into a single view, refreshed automatically.
This article walks through how we handle Tableau automation at Vidi Corp: the process we follow on client projects, plus a recent QuickBooks Online setup we automated from start to finish. If you are on a different platform, we cover the same ground for Power BI in our guide on how to automate Power BI refresh.
Tableau automation means setting things up so the repetitive parts happen by themselves, on a schedule or a trigger, instead of by hand.
Rather than exporting data, tidying it up in a spreadsheet, and resharing dashboards every reporting cycle, an automated setup keeps the data current and gets the finished report to the people who need it without anyone having to touch it.
It is the reporting end of a broader workflow automation consulting effort: the same idea of handing repetitive steps to the machine, applied to how your dashboards get built and shared.
There are four parts to it:
Each one lines up with a particular Tableau feature or tool.
Yes, and you can automate pretty much the whole cycle: from pulling data out of your source systems to dropping a finished dashboard or PDF into someone’s inbox. That same API integration approach is how data moves in and out of Tableau to begin with.
The part that takes some thought is the setup itself. You have to work out how each source should connect and how often each report genuinely needs refreshing, which matters more than it first looks.
We break every automation project into five steps. Going in order matters, because it is what stops the finished setup turning into a maintenance headache later.
The first job is getting data out of your source automatically. That manual export is where most reporting starts, and it is the first thing to get rid of.
Tableau connects to a lot of sources out of the box. When it does not cover yours, or the native connection is too limited, we build a custom connector instead. We have made our own Tableau connectors for the systems clients ask about most, including QuickBooks Online, Xero, Shopify, HubSpot, Jira, and others.
A custom connector pulls data straight from the source through its API.
Not sure whether yours supports it? Search the name of your source plus “API documentation.” If there is a documented API, a connector is usually doable. Getting those feeds wired up and trustworthy is the data integration side of the job, especially when the data lives in a database rather than a cloud app.
Once the data is out, it needs shaping into something your dashboards can use. A lot of teams still do this by hand every cycle, deleting columns, moving things around, filtering rows, redoing the same calculations.
That is what Tableau Prep is for. You build a flow once in Prep Builder, lay out each cleaning step, and Tableau reruns those steps every time the data refreshes. Lighter transformations can live inside the data source itself as calculated fields and relationships, so they refresh along with everything else.
If you want to run standalone Prep flows on a schedule, Tableau Prep Conductor handles the timing, though it is worth knowing Conductor comes as part of the Data Management add-on rather than out of the box. For heavier transformations, or when several systems need combining first, that logic often belongs upstream in a data warehouse built for reporting rather than inside the workbook.
With extraction and transformation in place, you can schedule the refresh and let the dashboards keep themselves current.
In Tableau Cloud or Tableau Server, that is what extract refresh schedules are for. You pick the frequency, say every working hour, or once first thing in the morning before anyone logs in, and Tableau refreshes the extract on that timer. When you need to get more specific, the REST API lets you trigger refreshes from your own scripts, which is handy when a refresh should follow some upstream event rather than a fixed clock. The older tabcmd command line tool still does the job too, though Tableau leans on the REST API as the main route these days.
One catch. If your data sits behind a firewall or in a private database and you are publishing to Tableau Cloud, you will also need Tableau Bridge. It is a small client that keeps a path open between your private data and the cloud, playing much the same role as a data gateway. And if that database is SQL Server, keeping refreshes quick often comes down to the source itself, which is where our SQL Server consulting comes in.
Automating the refresh is one thing. Knowing it worked is another. A schedule can run cleanly and still hand you a broken dashboard if the source data shifts underneath it, a field gets renamed, a join starts double-counting, or a feed comes back empty. Usually nobody notices until a stakeholder does.
Automated testing is the safety net that sits on top of the five steps. A data validation check confirms the numbers landing in Tableau still match the source. A regression check flags when a refreshed view suddenly looks different from the one everyone signed off on. Paired with alerts on failed refreshes, problems reach you before they reach a board pack. You can build these checks into the pipeline itself or run them through a dedicated testing tool.
The last step is making sure the thing does not become a chore to maintain once it is live. The usual culprit is hard-coding.
Hard-coding is when you bake fixed values into the report. Filter every view to one specific date, and you will be back changing that filter by hand every time you open it. Use a relative date filter instead, something like “last 30 days,” or a parameter that always resolves to today. The same goes for your calculations. The fewer fixed values you write in, the less you will have to fix by hand later. Some of that upkeep sits below Tableau as well, in the database optimization that keeps the underlying queries fast as your data grows.
Here is a recent project that shows the whole thing in action.
One of our clients was running their finance reporting straight out of QuickBooks Online. Every cycle, someone on the finance team exported the data by hand, pasted it into a spreadsheet, cleaned it up, and rebuilt the same summaries before any of it reached a dashboard. All in, that was about 10 hours a month.
We automated it with the four steps above:
What they ended up with was a set of QuickBooks Online finance dashboards, covering profit and loss, balance sheet, cash flow, and receivables, all refreshing on their own. The finance team opens a current dashboard now instead of rebuilding one every cycle.
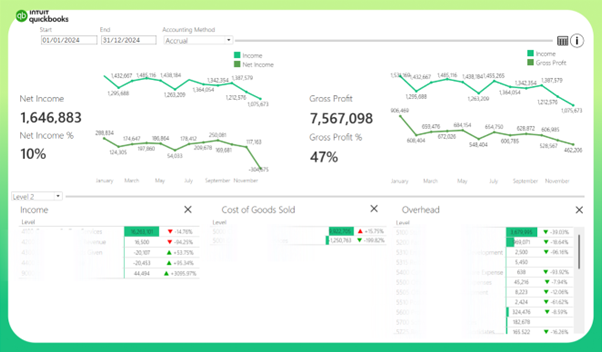
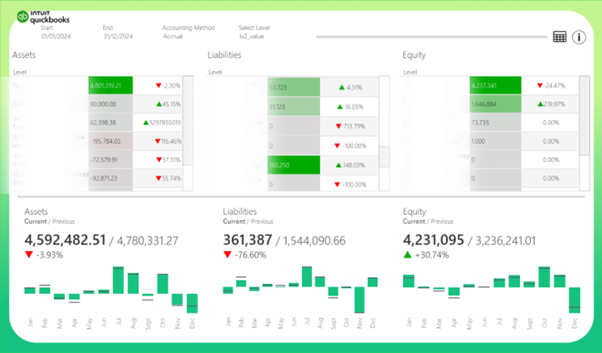
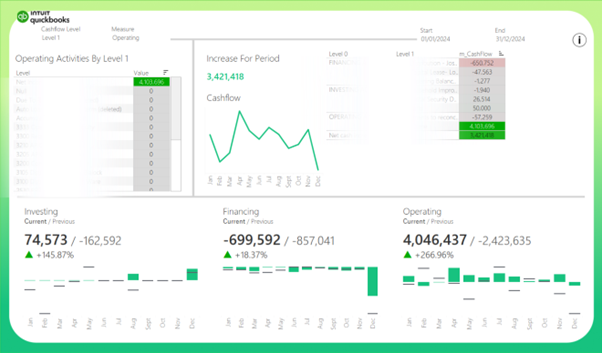
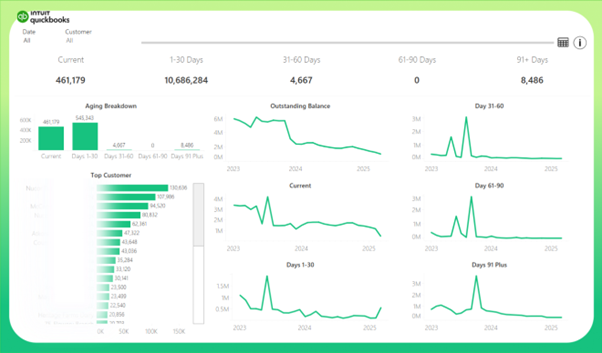
If you are on QuickBooks Online, our QuickBooks Online Tableau templates come free with the connector and give you those same four dashboards as a starting point.
For more of the dashboards we have built, see our Tableau dashboard examples.
If you are weighing your options for a Tableau report automation tool, here is how the pieces fit together:
On exports specifically, a subscription can send a view or a PDF on a schedule, and the REST API can generate a PDF or image export on demand. That covers most of what people mean when they ask about exporting a report to PDF automatically. And if that reporting ends up in a recurring exec deck, a monthly board pack or a quarterly review, the same scheduled exports can feed straight into PowerPoint or Google Slides, so the deck rebuilds from current numbers instead of someone pasting in screenshots by hand. The tools above cover the Tableau side while the source side, your databases and how well they perform, is where our database consulting work comes in.
A few habits separate automation that runs quietly in the background from automation that keeps breaking:
These habits keep the automation side reliable. For the wider set that keeps any BI project healthy, see our BI best practices.
Yes. Tableau subscriptions send a view or a PDF to whoever you choose on a schedule, and the REST API can push exports out from your own workflow.
In Tableau Cloud or Server, set an extract refresh schedule on the data source or workbook. If you need event-driven timing, trigger the refresh through the REST API.
Yes. A subscription can deliver a PDF on a schedule, and the REST API can generate a PDF or image export whenever you need one.
No. Extract schedules and subscriptions are all set up in the interface. You only really need code for event-driven refreshes or custom exports through the REST API.
If you want to automate your Tableau reporting but are not sure where to start, our team can help you map it out, from connecting your sources through to scheduling and delivery. Contact us and we will talk it through!


