
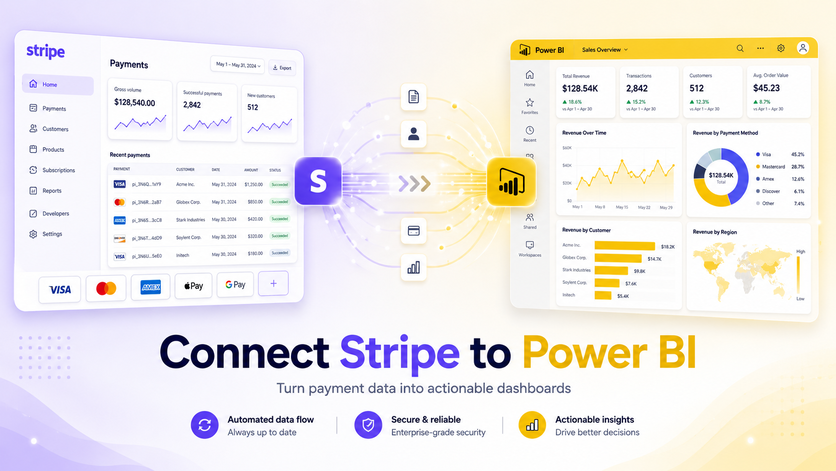
Stripe provides detailed information about payments, customers, invoices, subscriptions, refunds, and fees. However, its standard reports can be limiting when you need custom KPIs, data across multiple Stripe accounts, or analysis that integrates payment data with marketing and operational systems.
Vidi Corp has developed a dedicated Stripe Power BI connector that automatically extracts Stripe data into an Azure SQL database. Our connector has passed the Stripe technical and security reviews. Power BI connects to this structured database rather than relying on repeated CSV exports or processing raw API responses within the report.
This guide explains how to connect Stripe to Power BI through the Vidi Corp connector.
A Stripe Power BI connection transfers data from Stripe into Power BI so that it can be modelled, calculated, and visualised in interactive reports.
Businesses need a third-party connector, an intermediate database, or a custom API integration to access Stripe data in Power BI.
The connection can support several reporting areas:
The exact analysis depends on which Stripe objects are extracted and how they are connected inside the Power BI data model.
The Vidi Corp connector uses the following architecture:
Stripe → Azure SQL Server → Power BI
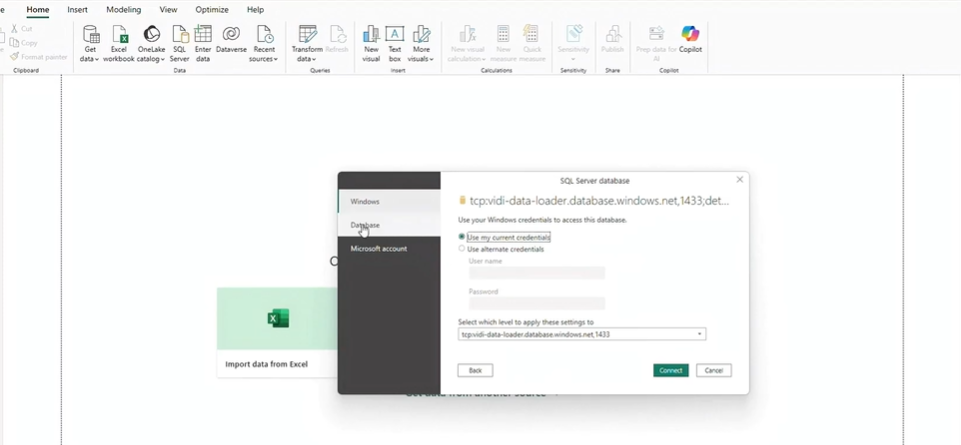
The connector extracts data from Stripe and stores it in an Azure SQL database. Power BI then connects to that database through its standard SQL connector.
This structure separates data extraction from report development. API calls, authentication, and data preparation are handled outside the Power BI file, while Power BI focuses on modelling, calculations, and visualisation.
Using Azure SQL as an intermediate layer also makes it easier to work with larger volumes of data. The data can be structured and processed before it reaches Power BI, instead of requiring every report to request and transform raw Stripe API responses.
The standard Vidi Corp connector page lists the following tables:
Additional tables and customisations can be requested when a reporting requirement is not covered by the standard data model.
Each table supports a different type of analysis.
The Customers table contains customer-level records from Stripe. It can be used to count unique customers, analyse repeat purchasing, segment customers, and connect payment activity to customer attributes.
Some Stripe transactions may not have a reusable customer record. This commonly happens when businesses accept guest payments without creating a Stripe Customer object.
The Charges table represents payment attempts and their outcomes. It is normally the main table for analysing successful transactions, payment values, payment status, and daily sales activity.
Charges should be filtered by status when calculating successful revenue. Failed, pending, or uncaptured payments should not automatically be included in completed sales.
The Refunds table records amounts returned against previous payments. Stripe supports both full and partial refunds, so one original charge may be associated with more than one refund record.
Refunds should normally remain as separate transactions in the model. This makes it possible to analyse refund rates, refund timing, reasons, and net revenue without changing the original charge record.
The Invoices table is particularly useful for subscription and business-to-business reporting. It can support analysis of billed revenue, payment status, overdue invoices, recurring billing, and customer payment history.
Invoices and charges should not be added together as if they represented separate sales. An invoice can generate a payment, which can then create a charge.
Balance transactions provide a ledger-style record of activity affecting the Stripe balance. They can include charges, refunds, transfers, payouts, fees, and adjustments.
This table is usually the better starting point for finance and reconciliation reports. Charges are generally more suitable for sales and customer behaviour analysis.
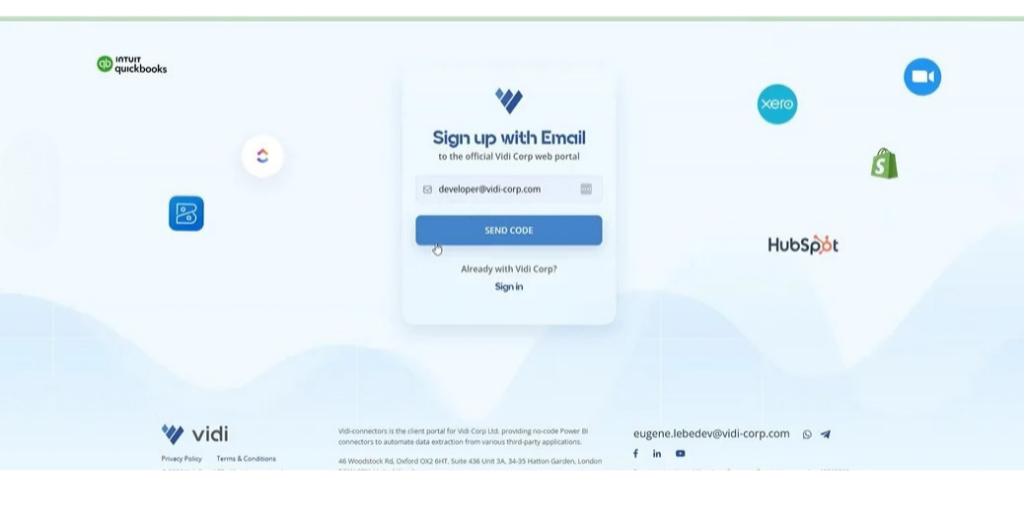
Open the Vidi Corp connector portal, and register an account with your email
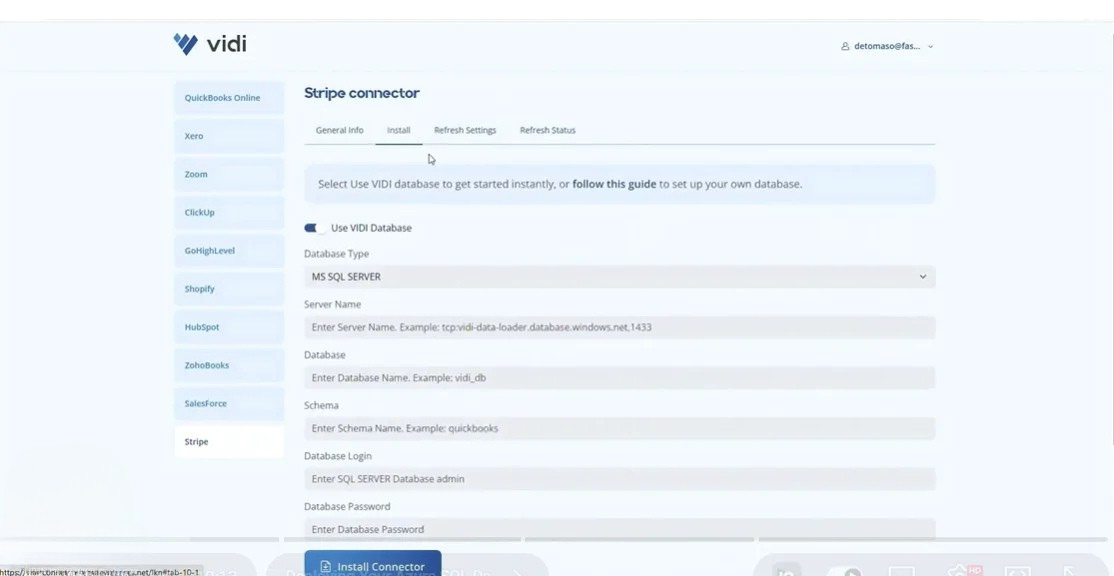
Choose where you want your data to land. Head to the Install tab and pick your database. If you have your own SQL database, untick “Use Vidi Database” and fill in your own details: server name, database name, schema name, username and password. Not comfortable with Azure or short on the technical side? Just tick “Use Vidi Database” instead. Give it a couple of minutes while our system spins up a database and builds all the underlying tables on our Azure account for you.
Click the “add new company ” button and authenticate. After this wait for your data to load for 10-20 min, depending on your data size. You can monitor the progress on the “refresh status” tab. Once every table there reaches 100% the data is ready to use.
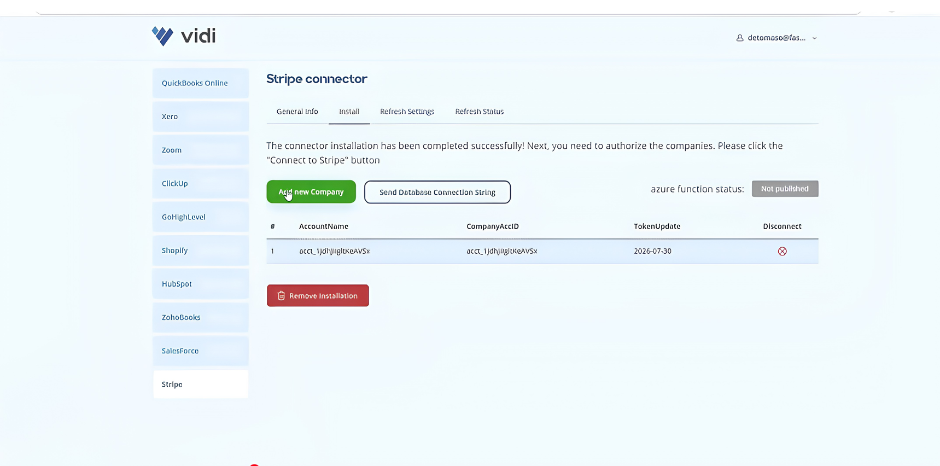
Click “send database connection string” on the install tab. Our system will send you an email to your registered email address with your connection details.

Vidi Corp provides a free Stripe Power BI template when you connect your data using the connector. The template gives you a working report layout that you can start using quickly, then modify in Power BI if needed.
The template is designed to help answer practical questions around customer retention, subscriptions, refunds, and invoices.
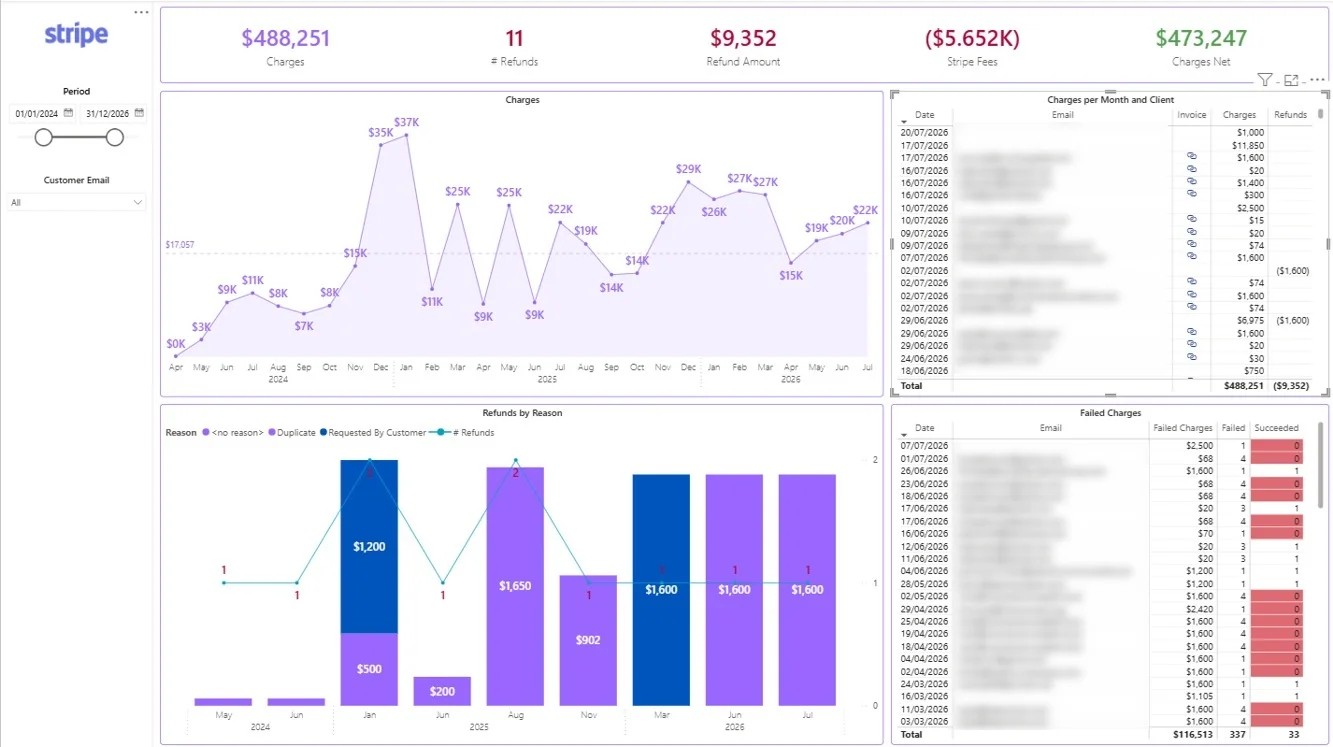
Most Stripe to Power BI problems come down to the same handful of issues: the connection to Azure SQL breaks, revenue does not match Stripe, numbers get duplicated, customers go missing, reports crawl, and scheduled refresh quietly fails. The Vidi Corp connector is built to take those problems off your plate, so you spend your time reading the dashboard rather than debugging it.
Getting Power BI talking to Azure SQL usually means wrestling with server names, authentication types, and firewall rules, and one wrong setting leaves you staring at a credential error on every refresh. Our setup handles the server name, database name, authentication, and network access for you, and we configure firewall access deliberately rather than opening everything up. You get a stable connection without loosening your security posture to force it to work.
When your Power BI total does not agree with your Stripe dashboard, the cause is almost always the same short list: failed payments counted as revenue, pending charges included, refunds deducted twice, test transactions left in, UTC and local dates mixed together, mismatched reporting periods, charges and invoices double counted, or currency converted incorrectly. The connector models these correctly from the start, so a charge means a charge and a refund is only ever counted once. If you ever want to check a figure, you can trace a single transaction cleanly through the tables, and it will reconcile.
Revenue balloons when a one-to-many relationship makes a charge repeat for every refund, invoice line, or balance transaction sitting underneath it. We keep financial measures in their original fact tables and use proper relationships and DAX measures instead of flattening everything into one merged dataset. Your totals stay honest because the model is structured to keep them that way.
Stripe can take a payment without attaching a reusable customer object, and a naive setup either drops those payments or lumps them all under one generic ID, so every guest looks like the same person. The connector separates identified customers from guest payments and reports them as distinct metrics. You see the full picture without distorting who your customers actually are.
Slow reports usually come from unused columns, high-cardinality text fields, and detailed transaction tables sitting on every page. The connector ships with a star schema, trims the fields you do not need, and uses import mode for responsive dashboards. As your transaction history grows, incremental refresh and more aggregated SQL tables keep performance steady rather than letting it drift.
Scheduled refresh tends to fail for predictable reasons: stale credentials, a firewall change, a renamed table, a schema update, or Power BI starting before the database has finished loading. We sequence the refresh so the database is ready first, and the connection is set up to survive the schema and credential changes that would otherwise break it overnight. When something does need attention, the refresh history gives you a clear place to look.
To be straight with you, no connector removes the need to understand your own numbers, and there will be edge cases specific to how your business uses Stripe. What the Vidi Corp connector does is handle the parts that trip nearly everyone up, so the work you are left with is analysis rather than plumbing.
Connecting Stripe to Power BI gives finance, sales, marketing, and management teams a clearer view of payment activity. The key is to use a reliable data pipeline, separate commercial and financial measures, and define every KPI before building the visuals.
The Vidi Corp connector provides a structured route from Stripe through Azure SQL into Power BI. Once the data is connected, you can develop payment, customer retention, subscription, refund, and reconciliation reports around the processes that matter to your business.
For help setting up the connector or designing the final dashboard, contact Vidi Corp to discuss your Stripe accounts, required tables, reporting frequency, and KPIs.
Power BI does not currently include a native Stripe connector. You need to use a third-party connector, an intermediate database, or a custom Stripe API integration.
The connector extracts data from Stripe and stores it in an Azure SQL database. Power BI then connects to that database using its standard SQL Server connector.
The standard connector includes customers, charges, refunds, invoices, and balance transactions. Additional Stripe tables and custom fields can be added depending on your reporting requirements.
Yes. Data from multiple Stripe accounts can be combined into one model and analysed by company, brand, country, business unit, or account.


