
If you run an agency, you already know the monthly report is where a client decides whether you’re worth the retainer. Your campaigns can be doing great, but if the client can’t see it clearly (or the numbers look a bit off), the relationship starts to wobble.
As a marketing analytics agency, we’ve built more than 100 marketing agency dashboards for agencies including Neil Patel’s NP Digital and TubeScience, a Facebook Ads agency managing over $2B in annual ad spend.
In this guide, you’ll find the dashboards we’ve built, grouped by the kind of agency they’re made for: SEO, paid media, search marketing, ecommerce, email and B2B performance marketing. For each one, we explain who it’s for and how an agency uses it in front of a client, not just what’s on the screen. At the end, there’s a short guide to choosing a marketing dashboard consultant, in case you’d rather hand the whole build over.
At Vidi Corp, we build custom marketing agency dashboards on a project basis. We work with tools amd technologies such as Looker Studio, Power BI, BigQuery, and Windsor, selecting the technology that best fits your existing data stack and reporting requirements.
Our marketing dashboard consultants manage the full dashboard development process. We start by understanding the clients, channels, KPIs, and reporting workflows your agency needs to support.
Next, we automatically extract data from sources such as Meta Ads, Google Ads, Google Analytics, Klaviyo, and other platforms your agency uses. We standardise the data so metrics are calculated consistently across sources, then build dashboards that refresh automatically as new data becomes available.
We also have a library of dashboards from previous agency projects that we can partially reuse where relevant to speed up development.
We structure the reporting around how your team works. This can include high-level client summaries for CMOs as well as detailed campaign, channel, and account-level analysis for your internal specialists.
Once the dashboards are ready, we train your team on the metrics, calculations, and reporting logic. This helps account managers confidently explain the numbers to clients, identify what is driving performance, and turn the data into practical recommendations.
Every dashboard can also be fully white-labelled with your agency branding. Access is configured around your preferred client workflow, whether clients log in to view their own performance or your team keeps the dashboards internal and shares reports on a set schedule.
Throughout the project, we work with your existing systems rather than asking you to change them. The result is a reporting setup built specifically around how your agency manages clients, analyses performance, and communicates results.
In the video below, hear from Kris Sugatan, CEO of performance marketing agency Sugatan.io, about her experience working with our team in the testimonial below. We built custom Looker Studio dashboards for 30+ of her agency’s clients, giving her team an automated way to report on marketing performance, all in one consistent setup. This saved the team around 20 hours a month and improved retention, since clients could see results in real time. Because dashboards rely on accurate tracking, we often start with a GA4 audit services to make sure the data is right.
A marketing agency dashboard is a single report that pulls your clients’ campaign data from ad platforms, analytics tools and CRMs, then refreshes it automatically. You’ll also hear it called an agency dashboard, an agency client dashboard or a client reporting dashboard. The name changes, the job doesn’t.
In practice, it has two audiences. Your team uses an internal view that covers every client, so account managers can spot problems before the client does. Each client gets their own branded view that shows only their numbers, which is the version you open on a review call or give them a login to check whenever they like.
SEO clients are usually patient for the first few months, then they want proof. These dashboards answer the three questions they keep asking: are we more visible in Google, is the traffic going to pages that matter, and (for local businesses) are people actually calling and visiting?
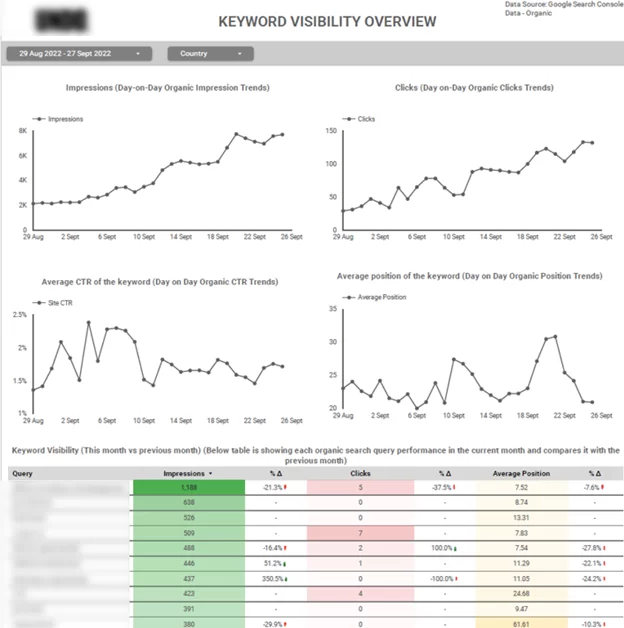
Best for: SEO agencies and content agencies that need to prove rankings and visibility are growing.
This Google Search Console dashboard is the one SEO agencies lean on most, because it shows progress well before revenue catches up. On a monthly review call, you’d start with the KPI cards for impressions, clicks, CTR and average position against the previous period.
Impressions usually move first, so a steady climb there is your early evidence that Google is showing the site for more searches, even when clicks haven’t followed yet.
From there, you’d filter the query table down to the keywords you agreed to target and show which new terms have started ranking. It’s also where you spot queries that moved up in position without gaining clicks, which gives you a natural reason to talk about title and meta description work for the month ahead.
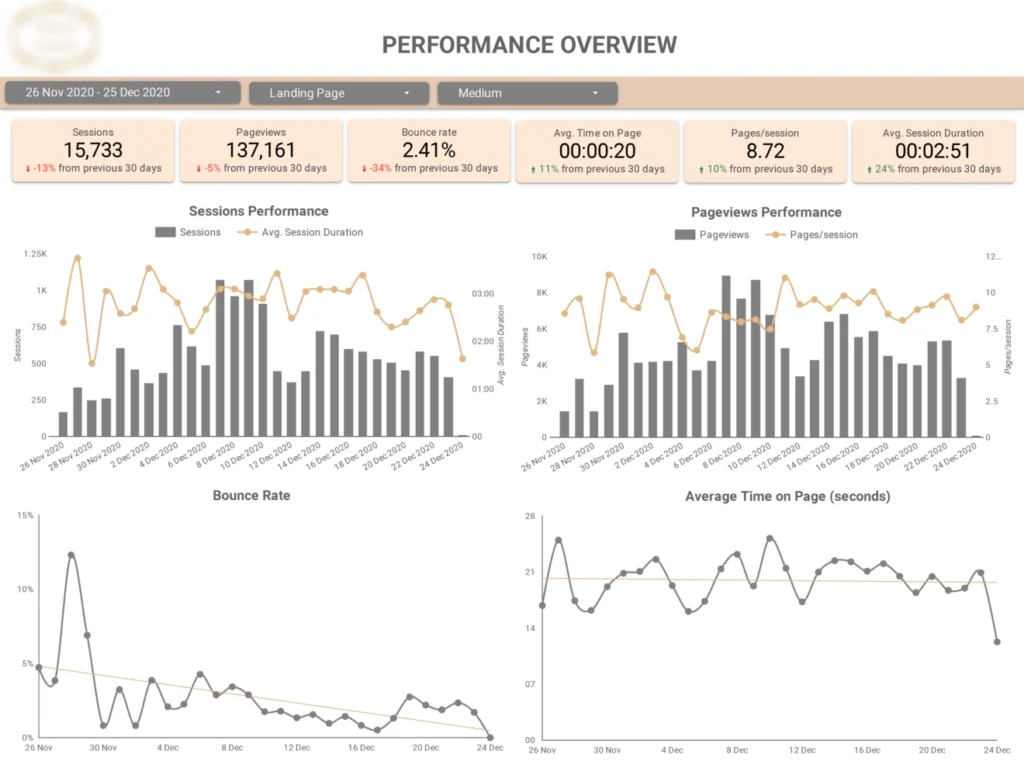
Best for: SEO agencies that want one white-labeled page to show a client their overall organic progress.
Where the Search Console dashboard gets into the detail, our Google Analytics SEO dashboard is the summary you put in front of a busy marketing director. The headline metrics sit at the top with a comparison to the previous 30 days, and daily trend charts underneath make it obvious when visibility has stepped up after a batch of new content or a technical fix.
Clients don’t need to log into Search Console or GA4 to understand it, and nobody on your side has to export anything. We white-label it with your branding and can layer keyword ranking and backlink data on top, so it tells the whole visibility story on one screen.
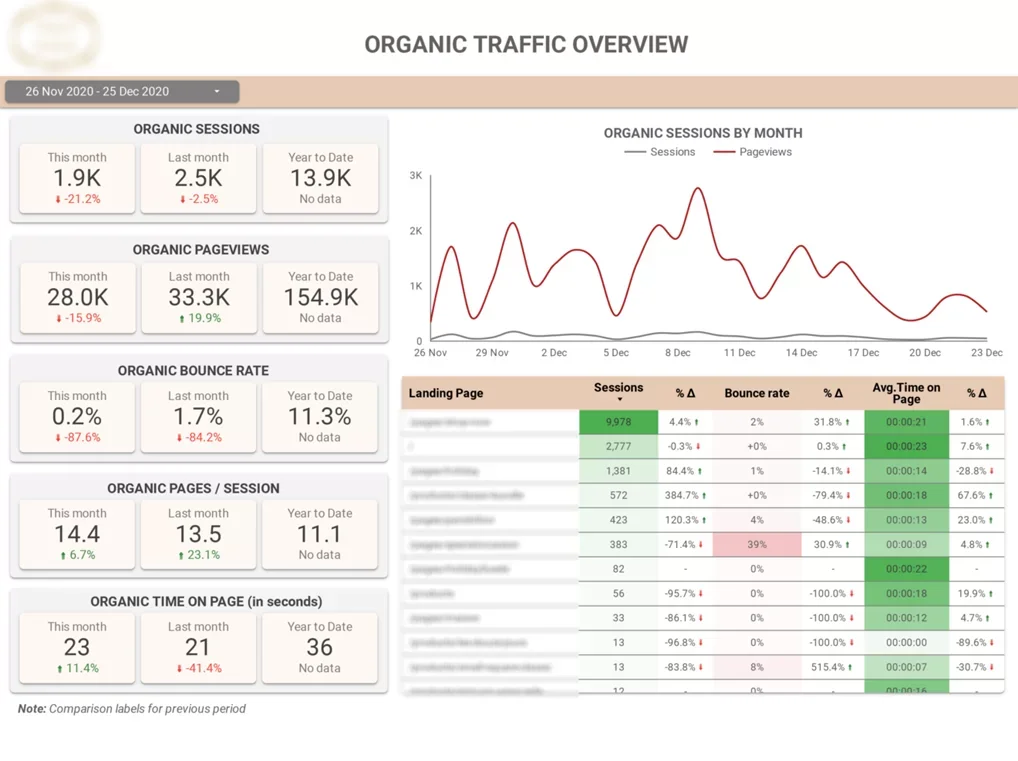
Best for: SEO agencies showing that organic traffic is growing, and that it’s landing on the pages the brand actually cares about.
Plenty of SEO reports celebrate traffic growth that turns out to be a handful of blog posts pulling in visitors who’ll never buy. This Google Analytics dashboard avoids that trap. It compares organic sessions and users month over month, then breaks performance down by landing page with color coding so you can see exactly where growth came from.
On a client call, this is where you filter to the service pages, product categories or location pages the client told you matter. Showing that organic traffic to those pages grew, and that visitors stuck around (pages per session, time on site, bounce rate), is a much stronger argument than a bigger sessions number on its own.
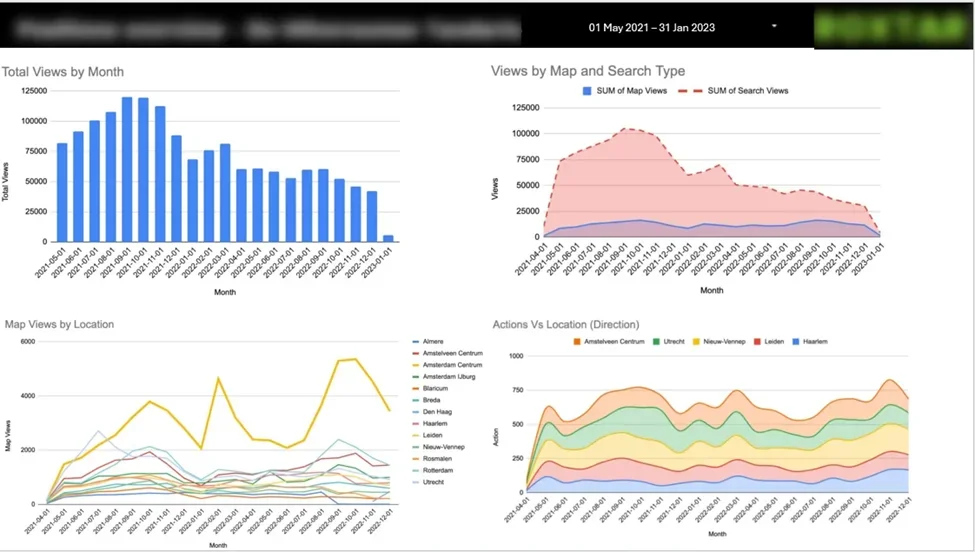
Best for: local SEO agencies and agencies working with multi-location brands.
We built this Google My Business dashboard for a multi-location phone repair chain, pulling several Google Business Profile accounts into one report. It splits profile views between Google Maps and Google Search, then shows calls, website clicks and direction requests for each location.
For a local SEO agency, the location comparison is the most useful part of the monthly call. If one branch gets plenty of views but very few calls, you’ve found your next piece of work (reviews, photos, categories, opening hours) and the client can see exactly why you’re recommending it. Local businesses think in phone calls and footfall, so this report speaks their language far better than rankings alone.
Paid media clients see the ad invoice every single month. The whole point of these dashboards is to show that the spend is profitable, clearly enough that the client keeps the budget running (and ideally grows it).
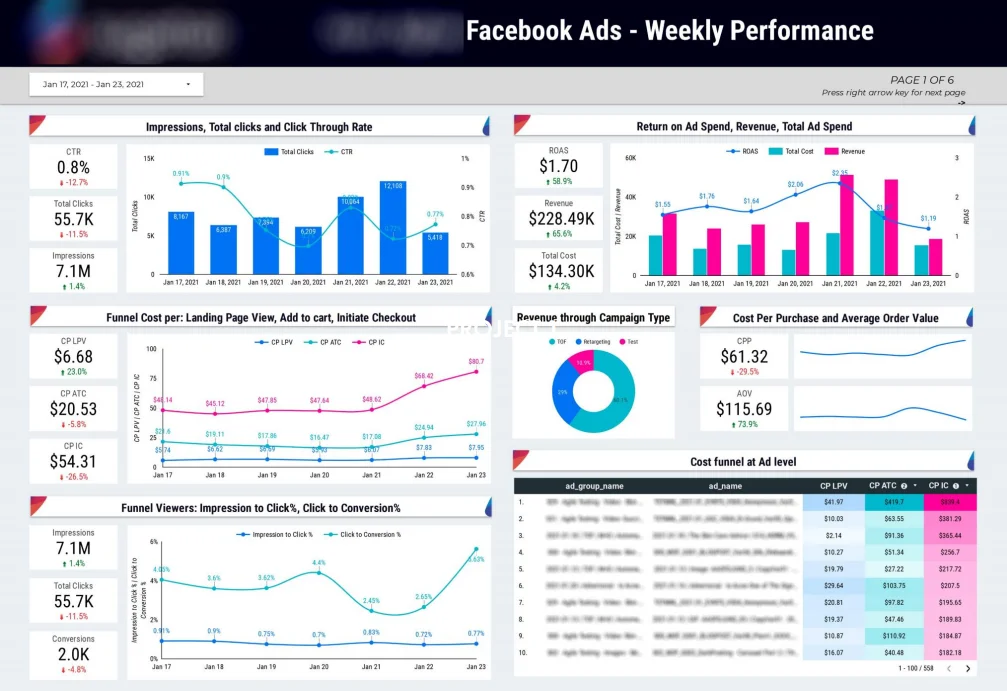
Best for: media agencies and paid social agencies that need to prove return on ad spend.
This is our go-to media agency dashboard. The Facebook Ads dashboard we built for an ecommerce brand puts ad spend, revenue and ROAS at the top with daily trends, then follows the funnel down through clicks, landing page views, add to cart, checkout and purchase, with the cost at every stage.
On a monthly review, you’d open with spend, revenue and ROAS against last month, because that’s the answer to “is this worth it?” The funnel view earns its place when results dip. If cost per add to cart looks healthy but fewer people are finishing checkout, you can show the client the problem sits on the website rather than in the ads, which keeps the conversation productive and protects the budget. Cost per purchase next to average order value then shows whether each sale is actually making money.
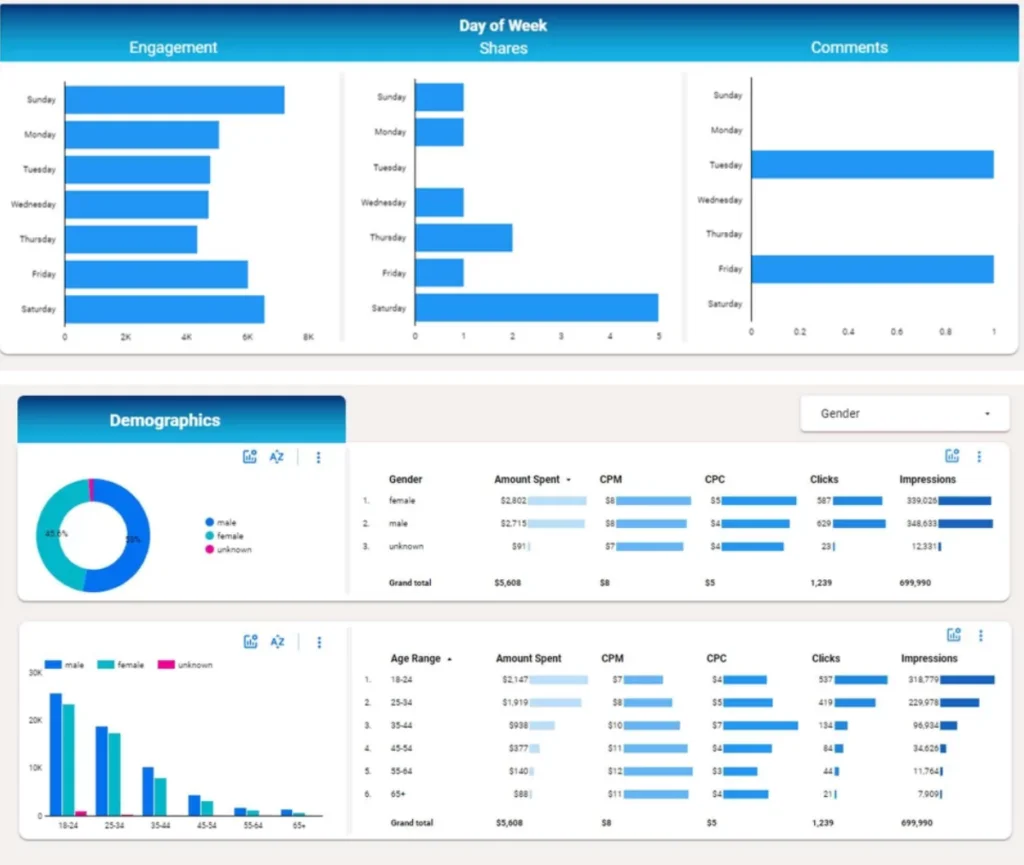
Best for: paid social and media agencies running Instagram campaigns for consumer brands.
Like the Facebook dashboard, this one is about showing the client their budget is working hard. Our Instagram Ads dashboard breaks performance down by day of the week and by age and gender, so you can see which audiences and which days respond best.
On a client call, this is how you explain the optimizations you’ve made. You can show that spend moved away from the days and age groups that weren’t converting and toward the ones that were, which is a simple, visual way to prove you’re getting more out of the same budget.
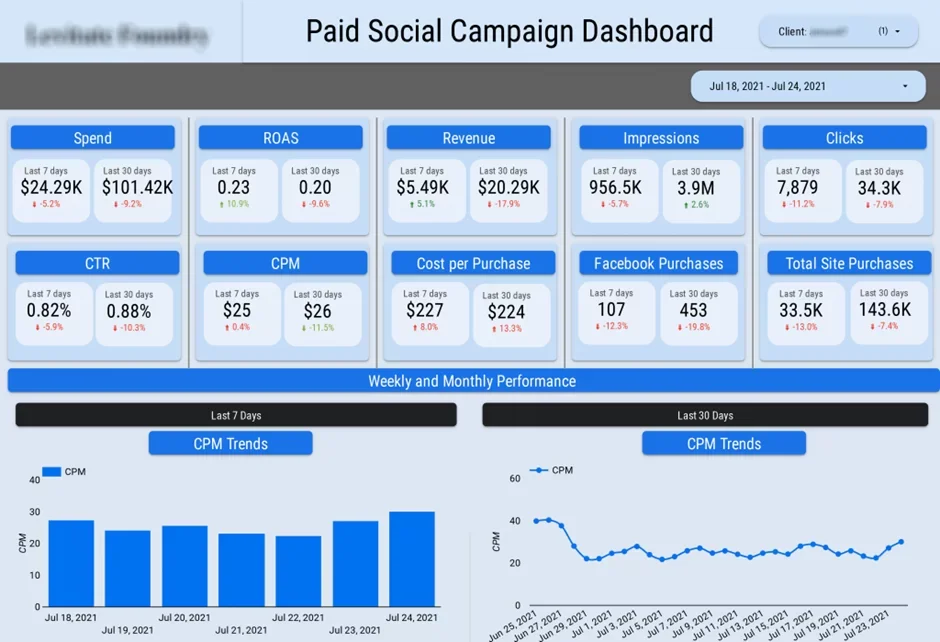
Best for: PPC and paid media agencies managing ad accounts for many clients at once.
This PPC dashboard is built as a true agency client dashboard. A filter at the top switches between clients, accounts, campaign types and date ranges, so one report covers your entire client list. Data from each ad platform flows in through automated pipelines.
Internally, account managers use the all-clients view before their calls to check budget pacing and flag any account that’s overspending or underdelivering. Externally, you filter it to a single client and walk through budget, spend and results by campaign, showing where money is returning well and where you’re moving it next. Same profitability story as the Facebook dashboard, just across every platform.
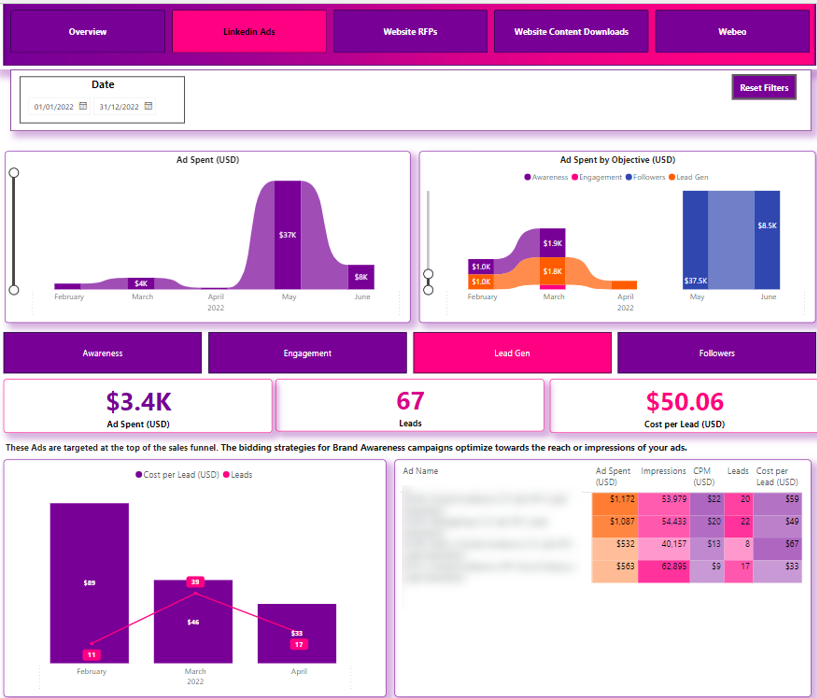
Best for: PPC agencies and B2B marketing agencies running LinkedIn campaigns.
LinkedIn clicks are expensive, so B2B clients question the spend more than on almost any other platform. We built this LinkedIn Ads dashboard for a global company with more than 400,000 employees, and it lets you switch between campaign objectives inside the report.
That switch matters on a review call. Awareness campaigns get judged on impressions, clicks and CTR, so you can show the brand is reaching the right audience at a sensible cost. Lead generation campaigns get judged on the leads they produce and what each one costs. Keeping the two apart stops a client from writing off an awareness campaign because it didn’t generate leads it was never meant to generate, and shows the lead gen side is profitable on its own terms.
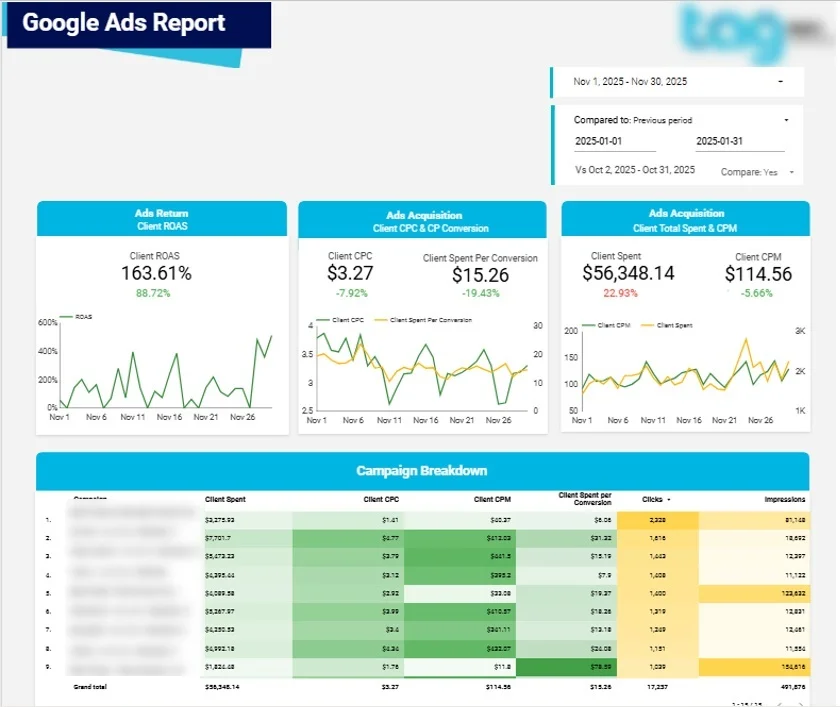
Best for: search marketing and Google Ads agencies.
Our Google Ads dashboard combines Google Ads cost data with revenue and conversion value from Google Analytics. The summary covers ROAS, CTR, CPC, CPM and total spend, with comparisons to the previous period.
On a monthly call, you walk the client from the top line down: here’s what we spent, here’s how it split across campaigns, and here’s the revenue and conversions each campaign brought in. Putting cost next to revenue from GA4, rather than relying only on the conversions Google Ads reports about itself, gives the client a view of profitability they can trust.
Search marketing agencies get asked two questions constantly: where did the budget go, and what did it bring back? These dashboards answer both on one screen.
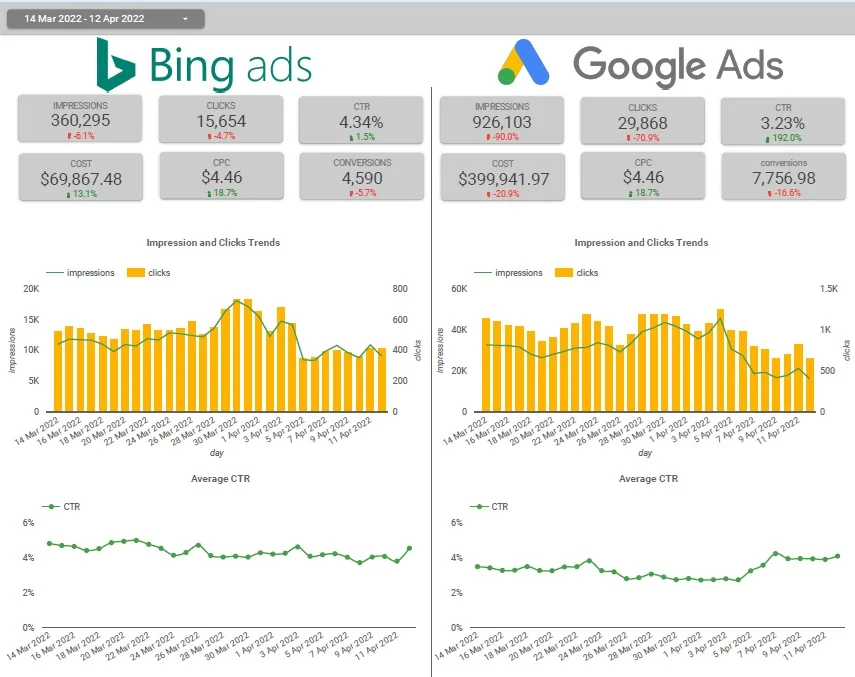
Best for: search marketing agencies running campaigns across Google and Bing.
This dashboard does the same job as the Google Ads one, but its real value is comparison. It shows conversions and conversion value by channel and device, tracks the weekly trend in conversion rate, and plots daily ad cost against revenue.
Agencies use it to settle the “should we be on Bing at all?” debate with evidence. If Bing converts at a similar rate for less money, you can show the client exactly why you’re recommending shifting part of the budget. You can explore a similar setup in our Bing and Google Ads dashboard.
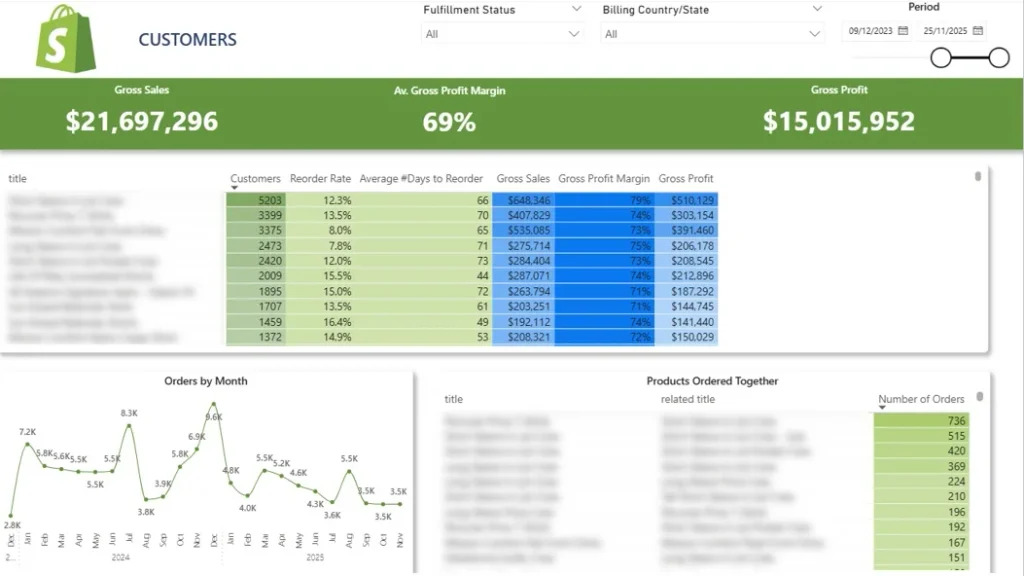
Best for: agencies that build Shopify websites and then run the store’s online marketing.
If you built the store, the client expects you to help it sell more, not just drive traffic to it. Our ecommerce dashboard for a Shopify brand covers total sales, discounts, shipping, tax, average order value and items sold, with trend charts you can flip between daily, weekly and monthly.
The product-level view is where agencies find the most to talk about. You can spot which products are frequently bought together and package them into one offer, build upsell offers around best sellers, and check which discount codes actually drove extra revenue versus just giving away margin. The geographic view shows where customers are buying from, which feeds straight into ad targeting. Each of those becomes a recommendation you can bring to the next call, backed by the client’s own sales data.
Best for: full-service agencies running several channels for an ecommerce client.
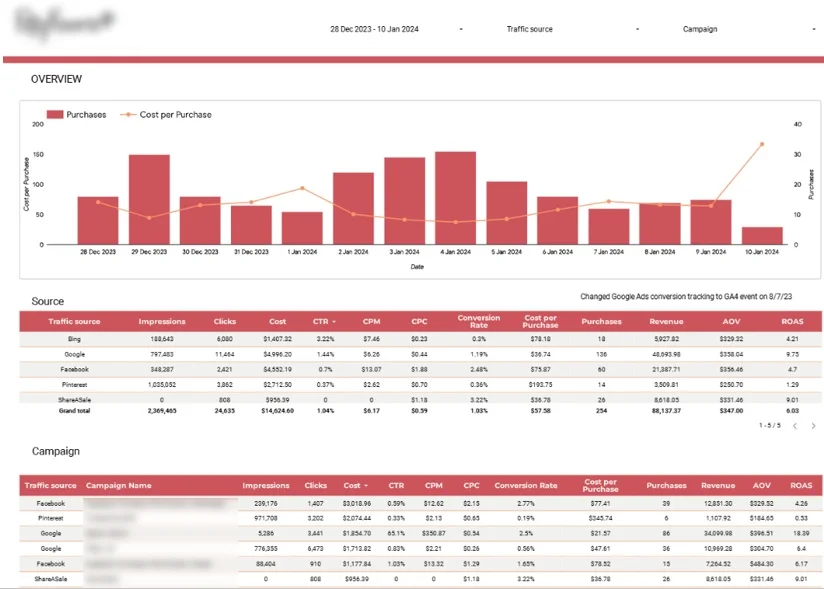
This cross-channel marketing dashboard was built for a flower delivery brand and pulls in Google Analytics, Google Ads, Bing, Facebook, Pinterest and affiliate platforms. The top view puts daily purchases next to cost per purchase, so you can check acquisition cost against average order value at a glance.
For a full-service agency, this is the report that answers “which channel is really pulling its weight?” You compare CPA, ROAS and revenue across every channel on the same terms and use it to justify moving budget toward whatever’s working best, which is much easier to agree when the client can see all the channels side by side.
Best for: email marketing and outbound lead generation agencies.
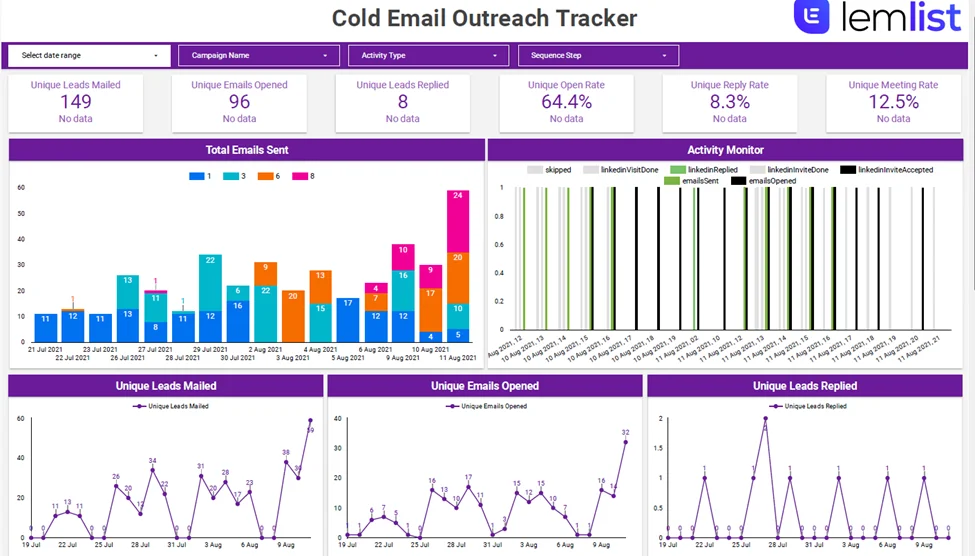
Our marketing analysts built this dashboard for an agency running multi-channel outreach through Lemlist and LinkedIn. It tracks leads emailed, open rate, reply rate and meetings booked, then breaks activity down by sequence step, channel, weekday and hour.
For a lead generation client, meetings booked is the number that pays the bills, so that’s where the call starts. The rest of the dashboard shows the optimizations behind it. If replies fall away after a particular step in the sequence, you can show you rewrote that step. If the hourly view shows replies cluster at certain times, you can show you moved the send window. Clients stay when they can see you’re actively improving things, not just hitting send. If your clients are ecommerce brands sending newsletters and flows instead, take a look at our Klaviyo dashboards.
Best for: performance marketing agencies working with B2B clients.
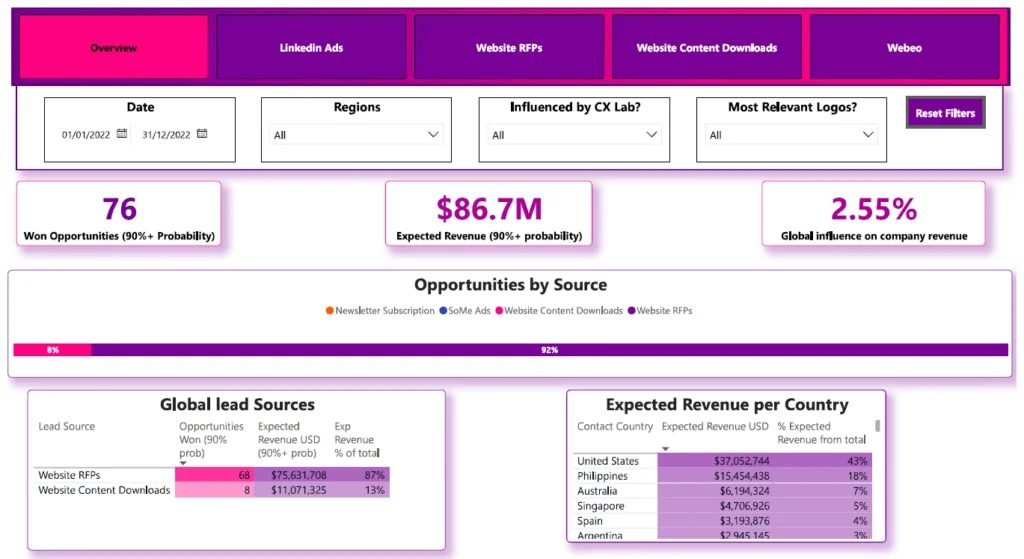
With B2B clients, the sale happens weeks or months after the click, and it happens in the CRM, not the ad platform. Our Power BI sales pipeline dashboard connects marketing data to won opportunities and expected revenue, and shows what percentage of that revenue marketing influenced. Deeper pages break it down by lead source and customer country.
This is the report for a quarterly business review rather than a quick monthly check-in. It shows the client exactly where their leads came from and how many turned into real pipeline, which ends the familiar argument where sales says the marketing leads are poor. When you can point to the revenue each source produced, the budget conversation gets a lot easier.
Benefits Of Using a Marketing Dashboard
A marketing agency dashboard pulls your campaign, website, and lead data into one place to report from. For agencies, that means data you can trust, a clear read across every channel, and lower reporting costs.
Reduce Human Error
A dashboard pulls data straight from Google Ads, Meta Ads, GA4, and your CRM, so nobody is copying numbers across by hand. That manual step is where most reporting mistakes come from, and it’s the one the dashboard takes out.
We built automated Looker Studio dashboards for a full-service digital agency running 80+ clients. We cleaned up their GA4 tracking along the way, which pushed their reporting accuracy up 40%.
Save Time on Reporting
Once the data pulls, calculates, and refreshes on its own, the recurring report stops eating anyone’s week. That time goes back to the campaigns themselves.
For the same agency, we automated reporting across 80+ client dashboards, pulling from Facebook Ads, Google Ads, SEMrush, GA4, form data, and more. They told us it saved 50 hours a week, and the quarterly lead report that used to take 20+ hours now runs itself.
Centralize Marketing Data
Put advertising, analytics, organic, and CRM data in one report and you can compare channels on the same metrics instead of stitching together five exports.
For DS Smith, we built a Power BI marketing dashboard covering 6 Facebook Ads accounts, 7 Google Ads accounts, 14 LinkedIn Ads accounts, organic social, and CRM data. It replaced three legacy reports and became their single source of truth for digital performance.
Lower Reporting Costs
When the reports maintain themselves, you can take on more clients without adding the same hours behind them.
For The Wanamaker Project, we automated Looker Studio reporting for seven clients across SEO, PPC, and more. It saved them 10 hours a month, and GA4 visibility across ad channels went up 25% for several of their clients.
The right metrics depend on what your client is paying you to deliver. A client who hired you for SEO doesn’t lie awake worrying about cost per purchase, and an ecommerce brand won’t care much about average position if sales are flat. The quickest way to lose a client’s attention is to hand them a report full of numbers that don’t connect to the reason they signed with you.
So before you build anything, ask one simple question: what does this client actually want to know when they open the report? Once you have that answer, choosing the metrics gets much easier. Here’s where we’d put the focus for each type of agency.
| Agency type | What the client wants to know | Metrics to put front and center |
|---|---|---|
| SEO agency | Are we more visible in Google, and is the right traffic coming in? | Impressions, clicks, average position, new ranking keywords, organic sessions to priority pages |
| Local SEO agency | Are more people calling and visiting? | Profile views on Maps and Search, calls, direction requests, website clicks by location |
| Paid media agency | Is the ad spend profitable? | Spend, revenue, ROAS, cost per purchase, funnel costs, average order value |
| Search marketing agency | Where did the budget go, and what did it return? | Spend by campaign, conversions, conversion value, ROAS, CPC, platform comparison |
| B2B and LinkedIn agency | Are we reaching the right people and generating leads we can afford? | Impressions and CTR for awareness, leads and cost per lead for lead gen |
| Ecommerce and Shopify agency | Is the store selling more, and what should we push next? | Revenue, average order value, product sales, discount code performance, sales by region |
| Email marketing agency | Is outreach turning into meetings? | Leads contacted, open rate, reply rate, meetings booked, performance by sequence step |
| B2B performance agency | Is marketing producing real pipeline? | Leads by source, won opportunities, expected revenue, marketing-influenced revenue |
Whether you build it in-house or hand it to us, it comes down to five steps.
If you’d rather skip all of that, our team will build the whole thing for you.
If you’re thinking about bringing in a marketing dashboard consultant, the build itself is only part of what you’re paying for. Here’s what we’d look for, and what we’d ask, before signing with anyone (including us).
An SEO agency and a paid media agency need very different reports. Ask to see dashboards built for agencies in your space, using the same platforms you use. If they can’t explain how you’d use each page on a client call, they’re building charts, not client reporting.
A beautiful dashboard built on broken tracking just shows wrong numbers more attractively. A good consultant audits GA4, your tags and your conversion setup before building, and tells you honestly what needs fixing.
Since wrong data is what damages client trust, ask exactly how they validate the dashboard. You want to hear that they reconcile totals against Google Ads, Meta, Shopify and your CRM before launch, and that they’ll tell you when a platform reports differently and why.
Check they can deliver white-labeled reports, keep every client’s data completely separate and give you an internal view across all clients. Adding a new client should take hours, not a fresh project.
Find out who owns the reports, data connections and any warehouse behind them. Some setups lock you into a connector subscription that gets more expensive with every client you add. It’s worth comparing that against a fixed-price alternative before you commit.
Ad platforms change their APIs regularly, and connectors break when they do. Ask what happens when a data source stops updating, how fast they respond and whether ongoing support is included or charged separately.
Looker Studio is often the natural fit for Google-heavy agencies, while Power BI suits agencies whose clients already live in Microsoft or need more complex data modeling. A consultant who only ever recommends one tool may be selling what they know rather than what you need.gency Dashboard?
Manual reporting quietly eats hours every week, and it hides the numbers that would actually change how a campaign is run. A custom marketing dashboard fixes both: it collects the data for you, puts every metric in one place, and gives you and your clients a live view across every channel.
Our marketing dashboard consulting team can scope it, build it, and automate it for you, whether your stack is GA4, BigQuery, and a handful of ad platforms or something more involved. What it costs and how long it takes depends on how many data sources and clients are in the build, so tell us what you’re working with and we’ll come back with a quote and a timeline.
Manual reporting quietly eats hours every week, and it hides the numbers that would actually change how you run a campaign. A custom agency client dashboard collects the data for you, keeps it accurate and gives your clients a clear, live view of the value you’re delivering. That’s what keeps them renewing.
Our marketing dashboard consulting team can scope it, build it and automate it, whether your stack is GA4, BigQuery and a few ad platforms or something more involved. Tell us what you’re working with and we’ll come back with a quote and a timeline.
It should include the metrics that prove the value of the service you’re selling. SEO agencies lead with visibility and organic traffic to priority pages, paid media agencies lead with spend, revenue and ROAS, and B2B agencies lead with leads and pipeline by source.
An agency dashboard often means the internal view that covers all your clients at once. An agency client dashboard is the branded version each client sees, filtered to their own data. Most agencies need both, and we usually build them from the same data so the numbers always match.
Looker Studio works well for agencies focused on Google platforms that want free, easy-to-share reports. Power BI is stronger when you need complex data models, large data volumes or clients who already use Microsoft tools. We build in both and recommend based on your stack.
It depends on how many data sources and clients are involved and how much tracking needs fixing first. Tell us what you’re working with, and we’ll give you a timeline and a quote.


