

Data analytics for car dealers involves analysing the dealership sales, marketing and inventory data to optimise performance. Car dealers who use it have an edge because it helps them to respond quickly to market shifts and have more control over business development.
In this article, we’ll cover everything you need to know to start using data analytics as a competitive advantage over your car dealership competitors.
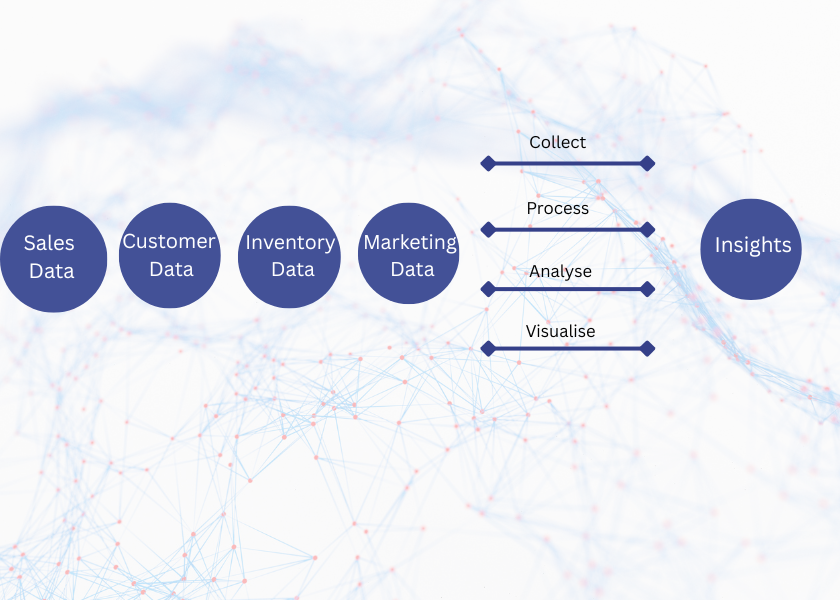
Data analytics for car dealers is the process of collecting, processing, analysing, and visualising data from sales, customers, inventory, and marketing to gain insights that help you:
In modern automotive retail, data analytics is a transformative force, enabling dealerships to move beyond traditional sales tactics and adopt data-driven strategies for greater success. To ensure analytics efforts are effective and actionable, it is crucial to collect reliable data and focus on relevant data points that directly impact dealership performance.
Whether you’re a one-person dealer or running a full dealership, data analytics helps you see your business more clearly and make more informed decisions. With data analytics, you can:
Let’s look at real-world examples of this in action.
Most dealerships are not short on data. Your DMS logs every sale, every service booking and every part that leaves the shelf. Your CRM knows which leads went cold and which salesperson closed them. Your finance system tracks margin down to the last unit. The problem is that all of it lives in separate places, and by the time someone has pulled it into a spreadsheet, the month is already over, and the decision you needed to make has made itself.
Our Business intelligence consulting services close that gap. Instead of waiting for a manager to stitch together three exports on a Friday afternoon, you get one view that updates on its own, pulling from your DMS, CRM and accounting systems so the numbers agree with each other for once. You can see gross per unit by model, days in stock before a car turns, technician efficiency in the workshop, and which marketing spend is actually bringing buyers through the door rather than tyre kickers.
The honest part is that this is not magic, and it will not fix a reporting habit that nobody trusts. If your data entry is sloppy or your DMS fields are used inconsistently across departments, a dashboard will simply show you that mess faster.
As a data analytics consultancy, we have helped many car dealerships go from raw data to tangible business results. In this article, we’ll use two examples to show how auto dealer analytics creates real value in your industry.
Automotive marketing analytics mainly involves analysing online marketing data to understand what products are in demand, increasing the volume of leads and crafting enticing offers. The main data sources for marketing analytics are Google Analytics 4, pay-per-click platforms (e.g. Facebook Ads, Google Ads, Bing Ads, etc) and local search engines (e.g. Google Maps).
We have been working with a marketing agency that specialises in supporting car dealerships for 2+ years. Our role was to track key website events in Google Analytics and then translate that raw data into insights the dealers could act on. (You can read the client’s review here.)
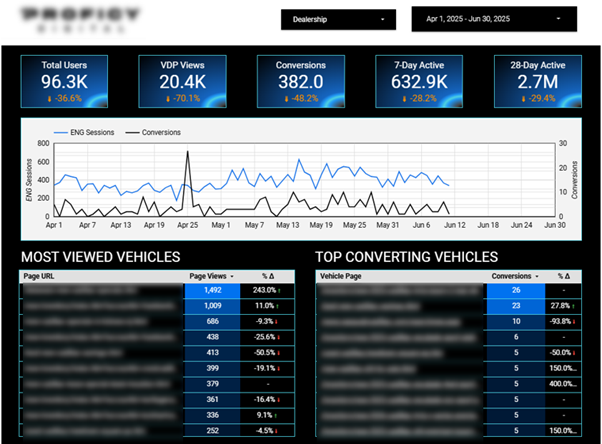
We built this dashboard to help the client track 3 key metrics on their website:
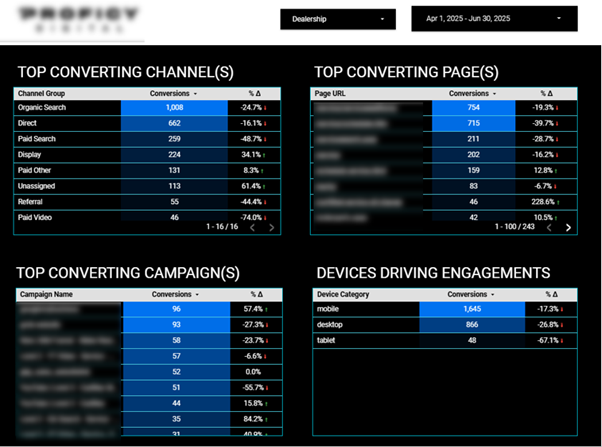
This other dashboard helped the client identify which marketing channels generated the highest-converting traffic, which campaigns were working, and even which devices (mobile, desktop, or tablet) were driving the most engagement.
They stopped wasting ad spend on underperforming campaigns, doubled down on those that brought in genuine buyers, and ran re-marketing campaigns to people who showed interest but didn’t convert the first time.
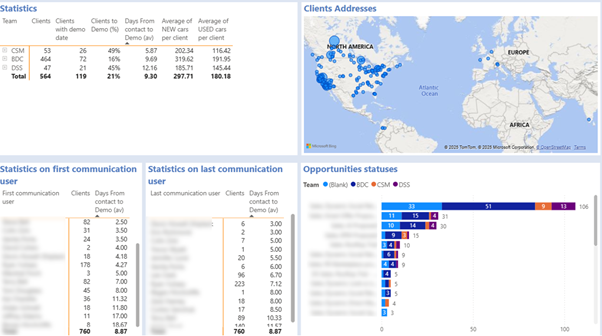
Automotive sales analytics is all about analysing the sales performance of each dealership, salesperson and product. Sales analytics helps car dealerships to plan their inventory, forecast financial performance and plan for promotions.
We collaborated with a car manufacturer on an automotive sales analytics project to help them track sales agents’ daily activities and assess their impact on conversions. The key KPIs we analysed were:
As you can see in the screenshot above, those KPIs were tracked on a simple dashboard, allowing the dealership to identify which agents were more successful at converting leads to clients and who were converting conversations to demos more quickly.
This helped them balance the workload of the agents, plan targeted training, and shorten the time to move customers from first contact to demo.
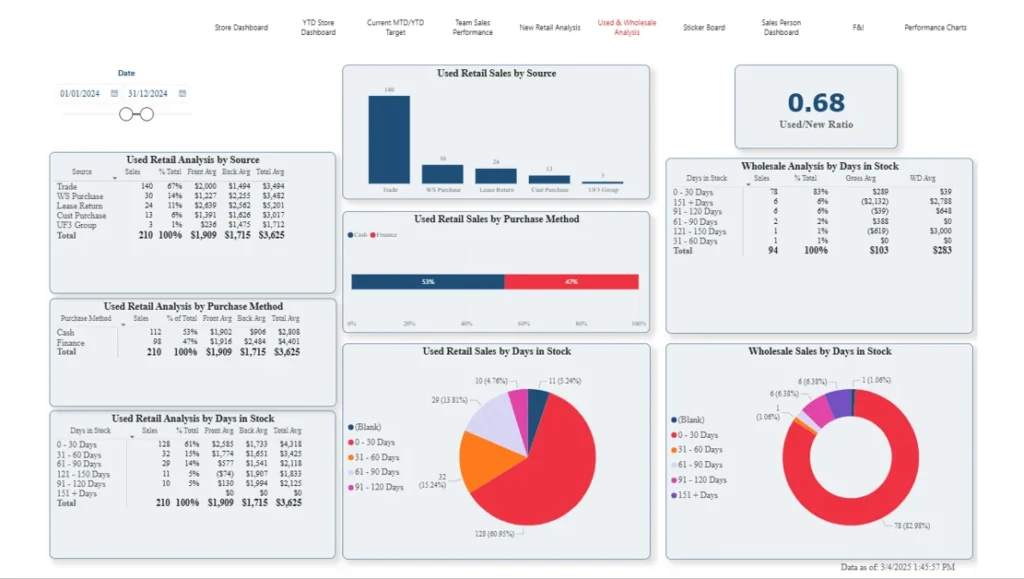
For sales managers, finance teams and general managers, being able to keep track of vehicle sales performance, stock levels, and revenue split across all the different sales channels is vital. This is where a good automotive dealership dashboard comes in – a vital tool that helps dealerships get a handle on inventory turnover, optimise their sales strategy and boost profitability on both new and used vehicles.
Our data visualization consultants built a custom Power BI dashboard for an automotive dealership, giving them the detailed view they need of their sales performance. What we looked at was how customers pay for their vehicles – cash, credit or finance – and how long those vehicles sit on the lot before they get sold. Users can then filter that analysis by new versus used vehicles, or drill down into individual models for a more detailed look at what’s really going on. There’s also a detailed breakdown of used car sales by source, including lease returns, trade-ins and direct purchases from customers, plus a comparison of how new versus used sales are doing across the business.
This data analytics strategy helps dealers see where they need to adjust their sales strategy and inventory management to make the most of their performance data. They can spot which financing options are generating the best returns, keep an eye on stock that’s not moving so they can either drop the price or give it a bit more promotion, and tweak their used vehicle sourcing strategy to take into account what’s actually selling. And with a clear view of the mix of new versus used sales, they can make more informed decisions about pricing, buying and promotional activity. That way, inventory levels and sales efforts stay in sync with what customers are actually looking for.
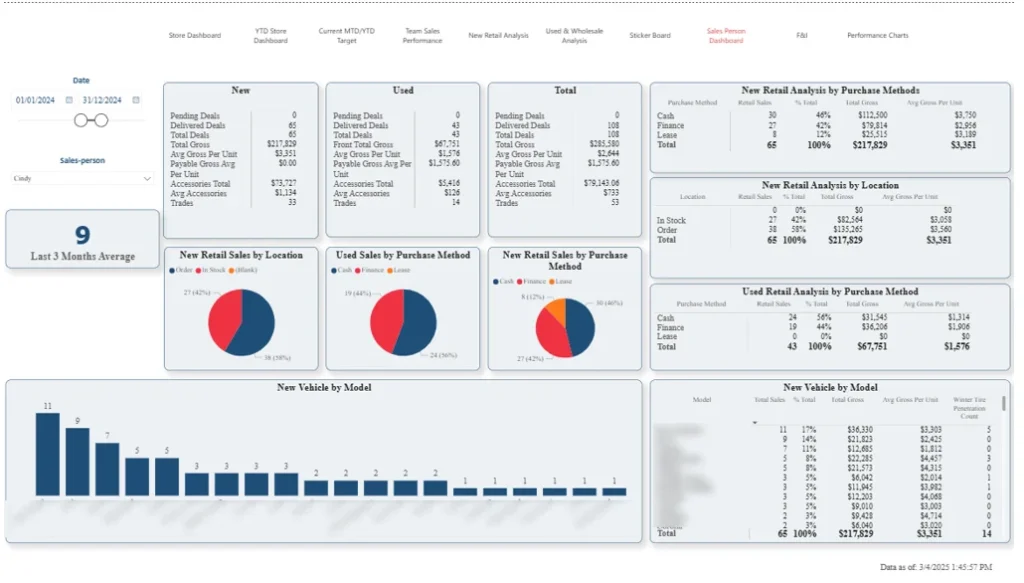
A further application of business intelligence for automotive dealerships is enabling sales managers and general managers to evaluate the performance of individual salespeople across revenue, deal flow and inventory movement. It provides a clear picture of how each salesperson is contributing to overall results and where there are opportunities for improvement.
This project produced a custom Power BI dashboard, which was built with a focus on salesperson-level analysis. Users can select an individual salesperson and review key metrics, including pending deals, delivered deals, total revenue and trade-ins. These metrics are separated between new and used vehicles, with additional breakdowns covering new car sales by model and all sales by payment method, whether cash, lease or finance. The dashboard also distinguishes between vehicles sold from existing stock and those ordered specifically to fulfil customer requests.
These custom reporting solutions give management a practical framework to evaluate performance and take meaningful action. Sales leaders can identify top performers by revenue and deal type, assess how effectively salespeople are selling accessories and other high-margin products, and understand how reliant each individual is on in-stock versus ordered vehicles. These insights support more focused coaching conversations, better informed stock planning and clearer sales strategies that drive performance across the dealership.
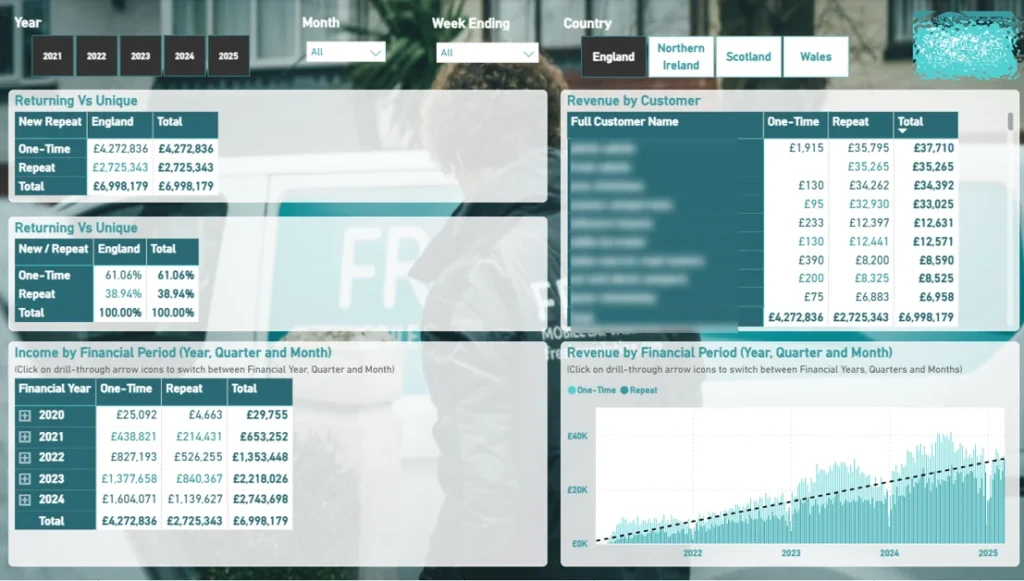
Business intelligence for car dealerships is more than just about selling cars – it also includes repairs, inspections and keeping them on the road. For the people who run the service departments, these BI dashboards are a must-have so they can keep track of how well they’re keeping customers coming back, see patterns in how many people need their cars serviced at any given time, and make sure they’re getting the revenue they need.
In a recent project, our Power BI consultants worked with a company that does on-the-go car servicing, including valeting, bodywork repairs and routine maintenance. They wanted a custom Power BI dashboard that could help them make sense of their sales. What the dashboard actually does is compare single visits to repeat business, and breaks those down by country and year so that they can see where their most loyal customers are. It also gives them a close-up view of each customer, showing which ones are most likely to come back for repeat business, and also gives them a look at the big picture over the course of a month to see how demand is changing over time.
That kind of information lets teams really get under the hood of what their customers are doing and figure out how to offer the right services in the right places. Managers can pinpoint the areas that are driving most of the repeat business, keep an eye on the customers who are most likely to disappear, and focus on the ones that are worth keeping – and they can do all this using the monthly trends to make sure they’ve got the right level of staff and resources in the right places to stay on top of things without getting overwhelmed.
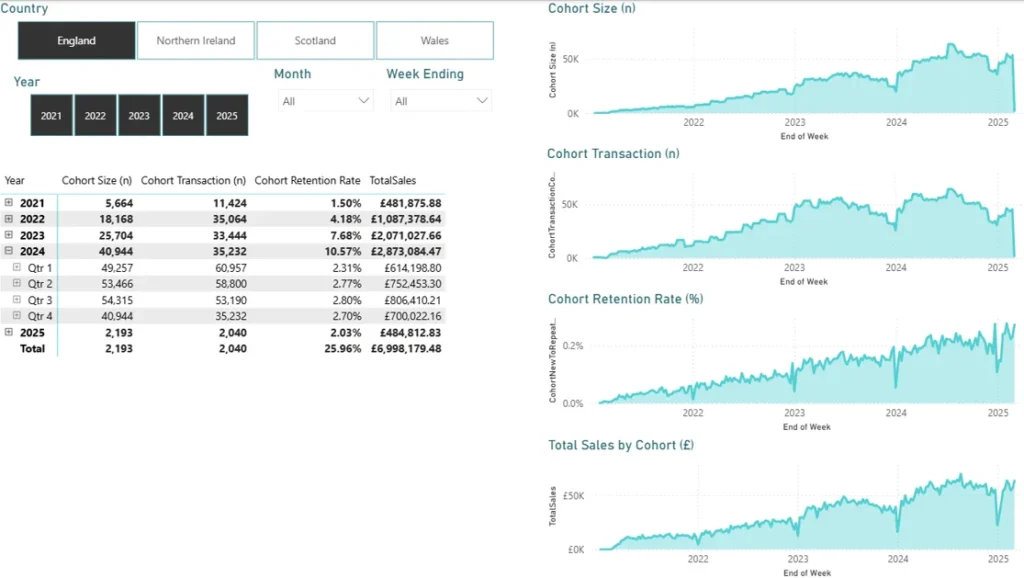
Automotive business intelligence teams equip marketing, sales and leadership with the insight needed to understand how customers are acquired and how likely they are to return. These dashboards are used to evaluate the long-term value of customers and measure the effectiveness of acquisition strategies across the business.
We put these dashboards to use by evaluating the long-term value of customers and measuring whether various sales strategies are actually working for the business. In this project, we built a fully customisable Power BI customer analytics dashboard to help track customer acquisition over time – by year and quarter. We grouped these customers into little ‘cohorts’ based on the first time they turned up and then calculated what percentage of each of these groups comes back for more. By looking at all these cohorts side by side, we can make comparisons and spot trends in customer behaviour as they go through the whole lifecycle of being a customer. We use this structure to go beyond just counting how many customers we get, to actually thinking about the quality of our customer acquisition – whether we’re getting customers in who are actually going to stick with us.
Management uses this info to pinpoint the periods when they got the most loyal customers and uses that to adjust their marketing or sales strategies to get more customers that way. And it also gives them a clear view of how their customer retention is shaping up over time – helping them make more informed decisions about customer engagement, managing the whole lifecycle of a customer and where to put their acquisition budget to get lasting value from it.
| Category | Metric | Description |
| Inventory & Pricing | Inventory Turn | Shows how many times you sell and replace your whole stock in a year. |
| Days to Turn / Age Buckets | How many days to sell a vehicle and age buckets (e.g. 0–15, 16–30 days); shows slow moving stock and aging risk. | |
| Market Day Supply vs. Local Demand Signals | How many days current inventory would last at current sales rates vs. local market demand; helps with stocking levels. | |
| Cost-to-Market / Price-to-Market Bands | How vehicle prices and acquisition costs compare to market average; guides discount timing and competitive positioning. | |
| Acquisition to Frontline Time | How long it takes to get a car ready for sale (to the frontline) after buying it. | |
| Marketing & Sales | Lead Response Time | Measures how fast your team replies to new leads. |
| Contact Rate | Shows the share of qualified leads your team actually reaches. | |
| Appointment Set/Show | Tracks how many leads schedule and show up for appointments. | |
| Close Rate | Tells you the percentage of leads or appointments that turn into real sales. | |
| Cost per VDP View | Shows how much you spend to get one person to view a vehicle listing online. | |
| Cost per Sold | Divides your total marketing and sales spend by the number of cars sold. | |
| Units per Employee | Measures how many cars each staff member sells. | |
| Service & Retention | Effective Labour Rate | Tells you the average revenue you earn for each billed service hour. |
| Hours Sold per Repair Order | Shows the average technician hours billed per repair. | |
| Gross % | Tracks your gross profit margin (the amount of revenue left after deducting the cost of the cars sold) | |
| CSI/Retention | Combines customer satisfaction scores and repeat visits to measure loyalty. | |
| Fixed Coverage / Absorption | Shows how much of your overhead is covered by service and parts. |
Understanding the market is essential for any car dealership aiming to attract and retain customers. Market analysis empowers dealerships to dive deep into customer behavior, preferences, and demographics, allowing them to segment customers and tailor marketing efforts to specific groups. By using analytics tools to track website traffic, monitor customer interactions, and analyze sales conversion rates, dealerships gain valuable insights into what drives customer decisions.
This data-driven approach helps dealerships identify emerging trends and adapt their marketing strategies accordingly. Whether it’s spotting a growing interest in electric vehicles or recognizing shifts in consumer preferences, market analysis enables dealerships to launch targeted marketing campaigns that resonate with their audience. By staying attuned to market trends and customer needs, car dealerships can uncover new growth opportunities, refine their marketing efforts, and boost overall performance in a competitive landscape.
To get real insight into how well their business is doing, car dealerships have to get serious about using some top-notch analytics tools. These are no ordinary tools; they’re designed from the ground up to help dealerships keep an eye on what really matters: sales numbers, customer loyalty, and how often they sell through old stock, giving them a crystal clear view of where they stand and where they need to improve.
Some of the most well-known car dealership analytics tools out there are CRM systems, data management platforms and marketing automation software. These different tools all work together to pull in data from loads of different places – like sales records, customer emails and website traffic – giving dealerships a complete overview of what’s going on in the business. With features like data reporting and analysis, visualising the numbers, these tools help dealerships come up with strategies that can actually make a difference – things like making their sales process more efficient, getting their marketing just where it needs to be and making sure their customers are happy.
By putting these tools to work, car dealerships can make smart decisions, keep an eye on how they’re doing against their goals and stay on their toes in a market that’s always changing. The upshot of all this is a business that runs like a well-oiled machine, with the customer at the heart of it all, driving growth, making more profit and giving its customers a top-notch experience.
Getting started with analytics in your dealership will be a smoother journey if you establish the right process from the outset. Begin this way:
Using analytics in your car dealership business will certainly pay off, but it could backfire if you fail to use it responsibly.
Data analytics gives car dealers the clarity to sell smarter, manage stock better, and protect profits in a fast-moving market. Start small, focus on the right KPIs, and build from there. The results will follow.
If you need help from experienced data analytics consultants, please reach out to us today! Our consultants have helped 600+ clients to achieve their data analytics needs. We would be excited to bring our experience into your project!
Dealerships use data analytics to track sales, manage inventory, understand customer demand, and enhance marketing outcomes.
Important KPIs to track are sales performance, inventory turn, lead response time, and close rate.
Analytics helps you price used cars competitively, reduce how long they sit on the lot, and cut reconditioning delays.
To get started, you will need your existing sales and inventory data, along with a simple dashboard tool like Power BI or Excel.
Car dealership analytics is the practice of turning the data your dealership already generates, from vehicle sales and service bookings to marketing spend and stock levels, into clear reporting you can act on. Rather than digging through separate systems to work out how the business is performing, you get a single view that shows what is selling, where margin is leaking, and which parts of the operation need attention. The goal is simple: help you make faster, better decisions without living in spreadsheets.
Auto dealer analytics is another term for the same thing, and the two phrases are used interchangeably depending on whether you are in a UK or US market. It covers the reporting and dashboards that pull together sales, aftersales, finance, and marketing performance so you can see the whole dealership in one place. If you run a group with several sites, it also lets you compare rooftops side by side and spot which locations are outperforming or falling behind.
Most dealerships start with their DMS (Dealer Management System) and CRM, since those two hold the core of your sales, stock, service, and customer activity. From there it is common to bring in marketing platforms such as Google Ads and Meta, your website and lead forms, finance and accounting tools, and manufacturer or franchise reporting feeds. The more sources you connect, the easier it becomes to trace a customer from first enquiry all the way through to sale and repeat service.
The KPIs that matter most tend to sit across three areas: sales performance (units sold, gross profit per unit, days in stock, and lead to sale conversion), aftersales (service revenue, workshop utilisation, and hours sold per RO), and marketing (cost per lead, cost per sale, and return on ad spend). Beyond those, keeping an eye on stock ageing and customer retention often reveals where money is quietly being lost. The right mix depends on your priorities, so it is worth starting with the handful of numbers that most directly affect profit rather than trying to track everything at once.
Cost varies quite a lot depending on how many sites you run, how many data sources you need connected, and whether you want a one-off dashboard build or an ongoing managed service. As a rough guide, a single-site setup can start in the low thousands, while a multi-site group with complex integrations and continuous support will sit considerably higher. The most honest answer is that pricing should be scoped against what you actually need, so it is always worth getting a tailored quote rather than relying on a headline figure.


