
Supply chain analytics strategy is the structured approach businesses use to turn supply chain data into consistent, decision-driving insight. It defines what to measure, how systems connect, who owns each KPI, and how insights translate into operational or strategic action. By bringing together sourcing, procurement, inventory, warehouse, logistics, and financial data into one structured reporting environment, a supply chain analytics strategy transforms fragmented information into practical dashboards and forecasts that support cost control, service performance, and working capital optimization.
As a supply chain data analytics company, we built 1,000+ custom business intelligence solutions for retailers, manufacturers, distributors, and global procurement teams. That includes consolidating data from multiple systems, designing scalable data models, and delivering dashboards that reflect how operations teams and leadership actually manage performance. The focus is always on clarity, consistency, and ensuring that the numbers can be trusted across departments.
This article explains what supply chain analytics is, why it matters in supply chain management, and how to build a structured supply chain analytics strategy. It also covers real-world dashboard examples, practical implementation techniques, key benefits and challenges, software options, and what the future of supply chain analytics looks like in practice.
Supply chain analytics is the process of using data to understand, monitor, and improve every stage of the supply chain, from demand planning and procurement to inventory, warehousing, logistics, delivery, and returns.
Instead of relying on disconnected spreadsheets or delayed reports, supply chain analytics brings data from systems such as ERP, WMS, TMS, procurement platforms, supplier portals, sales channels, and finance tools into a clear view of performance. This helps businesses see what is happening across the supply chain, why it is happening, what is likely to happen next, and what actions should be taken.
For example, a business can use supply chain analytics to identify slow moving stock, predict demand changes, compare supplier performance, track delivery delays, reduce logistics costs, and prevent stockouts before they affect customers.
At a basic level, supply chain analytics answers questions such as:
| Question | Example |
|---|---|
| What happened? | Which products were delayed last month? |
| Why did it happen? | Was the delay caused by supplier lead times, warehouse capacity, or carrier performance? |
| What is likely to happen next? | Which products are at risk of stockout next quarter? |
| What should we do? | Should we reorder, change suppliers, rebalance inventory, or adjust delivery routes? |
The real value of supply chain analytics is turning complex operational data into faster, smarter decisions that improve service levels, reduce costs, increase resilience, and help the business respond quickly to disruption.
Supply chain analytics works by collecting data from different operational systems, preparing that data so it can be trusted, turning it into performance models and dashboards, and then using the insights to make better supply chain decisions.
The process connects data, people, and decisions across procurement, inventory, warehousing, transportation, finance, and customer fulfilment.
The first step is to bring together data from the systems that manage different parts of the supply chain. Most businesses already have this data, but it is often spread across multiple platforms, teams, and spreadsheets.
This data usually comes from ERP systems, which hold purchase orders, sales orders, production plans, stock movements, and cost data. It can also come from warehouse
Combining these sources gives businesses a clearer view of how goods, costs, and risks move through the supply chain.
Once the data has been collected, it needs to be cleaned and standardized. Supply chain data often comes from different systems that use different formats, naming conventions, and definitions.
For example, the same supplier may appear under several names, product codes may not match across systems, and locations may be recorded differently by warehouse, transport, and finance teams. Units of measure can also vary, with one system recording products in cases, another in pallets, and another in individual units.
Other common issues include duplicate supplier records, missing shipment IDs, duplicate purchase orders, inconsistent product descriptions, incorrect location names, and different teams using different definitions for the same KPI. For instance, one team may define on-time delivery as arrival at the customer site, while another may define it as dispatch from the warehouse.
Cleaning and standardizing the data makes dashboards, forecasts, and reports more reliable.
After the data has been prepared, it can be structured into models, KPIs, dashboards, forecasts, and alerts.
This is where raw data becomes useful business insight. Instead of viewing thousands of rows of transactions, teams can track clear performance indicators such as supplier lead time, stock availability, delivery performance, forecast accuracy, inventory turnover, warehouse throughput, and logistics cost per order.
For demand planning, analytics can show forecast accuracy, demand variance, and seasonal trends. For inventory, it can show stock on hand, stockout risk, excess stock, and inventory turnover. For procurement, it can track supplier lead time, purchase price variance, and supplier reliability. For warehousing, it can monitor picking accuracy, order cycle time, and storage utilization. For transportation, it can compare on-time delivery, carrier performance, and cost per shipment. For finance, it can show landed cost, margin impact, and working capital tied up in inventory.
Teams can track metrics such as supplier lead time, stock availability, delivery performance, forecast accuracy, inventory turnover, warehouse throughput, and logistics cost per order.
The final step is using the insights to make practical decisions. Supply chain analytics is only valuable when it leads to action.
For example, if analytics shows that a product is likely to run out before the next replenishment cycle, the business can raise a new purchase order, increase safety stock, or transfer inventory from another warehouse. If transportation data shows that a carrier is causing repeated delays, the logistics team can change routes, renegotiate service levels, or switch to a better-performing carrier.
Analytics can also support inventory rebalancing when one warehouse has too much stock and another is running low. It can guide supplier reviews when lead times are increasing or quality issues are becoming more frequent. It can help procurement teams identify cost increases, compare supplier pricing, and improve contract negotiations.
Supply chain analytics needs data from every part of the supply chain, including procurement, inventory, warehousing, transportation, sales, finance, and suppliers. This data helps businesses understand how products move, where costs are rising, and where delays or risks are likely to happen.
Common data sources include purchase orders, supplier lead times, stock levels, warehouse activity, shipment status, delivery performance, sales demand, production schedules, and freight costs. External data such as weather, fuel prices, port congestion, tariffs, and market demand can also improve forecasting and risk planning.
The more connected and reliable the data is, the easier it becomes to identify problems, predict future demand, optimize inventory, reduce costs, and make faster supply chain decisions.
| Data category | Examples | Used for |
|---|---|---|
| Procurement data | PO value, supplier, lead time, contract terms | Supplier performance, spend analysis |
| Inventory data | stock on hand, stockouts, safety stock, weeks of supply | Inventory optimization |
| Warehouse data | inbound volume, pick rate, dwell time, capacity | Warehouse productivity |
| Transportation data | carrier, route, delivery time, freight cost | Logistics optimization |
| Demand data | sales orders, POS, seasonality, forecast | Demand planning |
| Finance data | landed cost, margin, working capital | Cost control |
| External data | weather, port congestion, tariffs, commodity prices | Risk prediction |
In modern supply chain management, analytics is the engine that drives smarter and more effective decision-making. By leveraging different types of supply chain analytics, organizations can transform raw data into actionable insights that optimize every stage of the supply chain process and boost operational efficiency.
There are four primary types of analytics used within supply chain management:
Descriptive Analytics: Descriptive analytics focuses on summarizing historical supply chain data to answer the question “What has happened?”. By analyzing past performance, such as inventory levels, order fulfillment rates, and transportation costs, supply chain professionals gain a clear view of trends and patterns. This foundational layer of chain analytics provides the visibility needed to establish benchmarks and monitor ongoing supply chain performance.
Diagnostic Analytics: Diagnostic analytics digs deeper to uncover the reasons behind supply chain outcomes. By examining the root causes of issues such as late deliveries, stockouts, or supplier delays, diagnostic analytics helps supply chain managers understand “Why did it happen?”. This type of analysis is essential for identifying inefficiencies and implementing targeted improvements across the supply chain network.
Predictive Analytics: Predictive analytics uses advanced analytics techniques, including machine learning and statistical modeling, to forecast future supply chain events. By analyzing historical data and market trends, predictive analytics enables organizations to anticipate demand fluctuations, potential disruptions, and capacity constraints. This forward-looking approach empowers supply chain teams to proactively manage risks and optimize inventory levels, ensuring the supply chain remains agile and resilient.
Prescriptive Analytics: Prescriptive analytics takes supply chain optimization a step further by recommending specific actions based on data-driven insights. By simulating different scenarios and evaluating potential outcomes, prescriptive analytics answers the question, “What should we do next?” This enables supply chain managers to make informed decisions about inventory replenishment, transportation routes, and supplier selection, ultimately driving operational efficiency and competitive advantage.
Together, these types of supply chain analytics form the backbone of modern supply chain management. By integrating descriptive, diagnostic, predictive, and prescriptive analytics into daily operations, organizations can move beyond reactive problem-solving to proactive decision-making, unlocking new levels of efficiency, agility, and performance across the entire supply chain.
Supply chain management involves constant coordination between suppliers, warehouses, transport providers, retailers, and customers. Without structured data analytics, decisions are often based on delayed reports, fragmented information, or assumptions. This makes it difficult to control cost, maintain service levels, or respond quickly to disruptions.
Data analytics brings visibility across the entire supply chain. It allows businesses to monitor inventory levels, track delivery performance, analyse supplier reliability, and measure procurement efficiency in a consistent way. When metrics are clearly defined and regularly reviewed, operational performance becomes measurable rather than reactive.
Analytics also connects operational activity to financial outcomes. Inventory decisions affect working capital. Delivery delays impact revenue and customer retention. Tariff exposure influences margin. By analysing these relationships, leadership can balance cost, service, and risk more effectively.
In modern supply chains, complexity is increasing due to global sourcing, multi-channel distribution, and demand volatility. Data analytics provides the structure needed to manage that complexity. It enables better forecasting, faster issue resolution, and stronger alignment between operations and business strategy.
In short, data analytics is no longer a support function within supply chain management. It is a core capability that determines how efficiently, profitably, and resiliently a supply chain operates.
Supply chain analytics strategy is the structured plan that defines how a business uses data to improve sourcing, inventory, logistics, warehousing, and procurement performance.
It goes beyond building dashboards. A strategy connects business objectives—such as reducing cost, improving service levels, or freeing up working capital—to clearly defined metrics, data sources, reporting processes, and ownership.
Without a strategy, companies often build isolated reports that answer individual questions but do not support long-term decision-making. With a strategy in place, analytics becomes embedded into operational workflows and leadership discussions.
A strong supply chain analytics strategy typically defines:
In simple terms, supply chain analytics provides the data.
Supply chain analytics strategy ensures that data consistently drives the right decisions.
When implemented correctly, it aligns procurement, operations, finance, and logistics around shared metrics, turning supply chain performance into a measurable and continuously optimised part of the business strategy.
A strong supply chain strategy depends on visibility. If sourcing, inventory, warehouse, and procurement data sit in separate systems, leaders are forced to make decisions based on partial information.
The dashboards below show how supply chain analytics works in practice. Each example focuses on a specific operational challenge and turns raw data into clear, decision-ready insight. Together, they demonstrate how structured reporting can reduce cost, protect service levels, improve control, and strengthen overall supply chain performance.
Many importers and manufacturers manage cross-border procurement without clear visibility into where goods are sourced and how import duties impact total landed cost. Tariff data often sits separately from purchasing and shipment data, making it difficult to analyse cost drivers holistically.
Without structured analytics, organisations struggle to identify high-cost sourcing regions, monitor trade agreement utilisation, or detect tariff overpayments. As a result, unnecessary costs remain embedded in the supply chain and directly reduce margin.
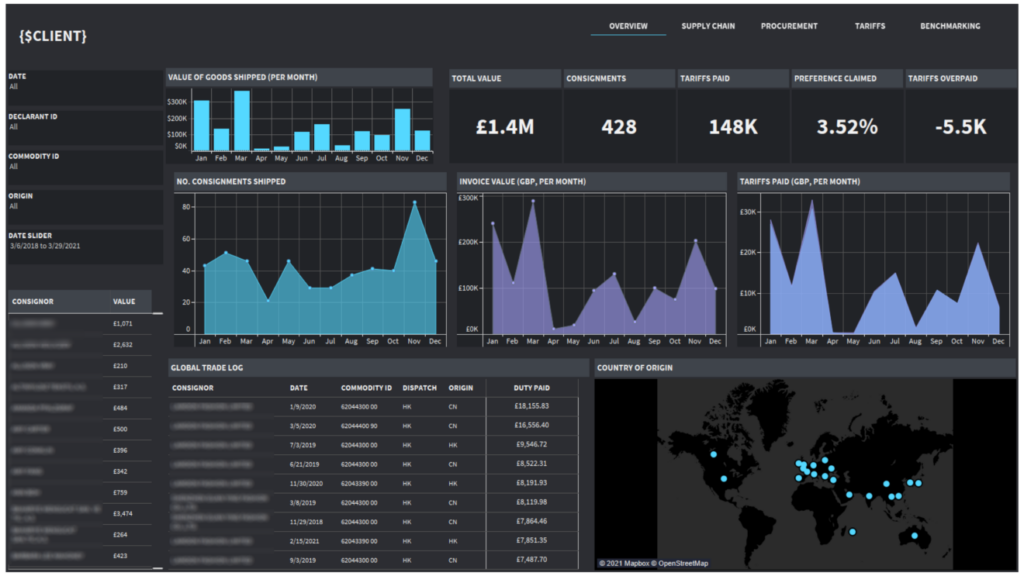
Our Tableau experts built a custom dashboard that consolidates purchasing, shipment, and customs data into a single analytical view.
The dashboard visualises sourcing geography and tracks shipment activity alongside import duties. It highlights which imports fall under preferential trade agreements and compares tariffs paid against eligible reduced rates.
Key Metrics:
This dashboard supports a cost-optimisation supply chain strategy. Leadership can identify high-cost sourcing regions and evaluate whether alternative suppliers or trade routes would reduce landed costs.
The preferential tariff analysis enables finance and procurement teams to systematically monitor compliance with trade agreements and proactively reclaim overpaid duties. This directly improves margin and working capital management.
Strategically, the dashboard transforms customs data from a compliance function into a cost intelligence tool. It allows procurement, finance, and operations teams to align sourcing decisions with measurable cost impact, strengthening the overall supply chain analytics strategy.
Many consumer goods brands and manufacturers sell through large retailers without direct control over in-store inventory. They often lack clear visibility into how much stock sits on shelves, how quickly it is selling, and when replenishment is required.
Without structured inventory analytics, stockouts go unnoticed until sales decline. Weeks of supply are not proactively monitored, and discussions with retailers rely on assumptions instead of data. This leads to lost sales, lower on-shelf availability, and weaker negotiating power.
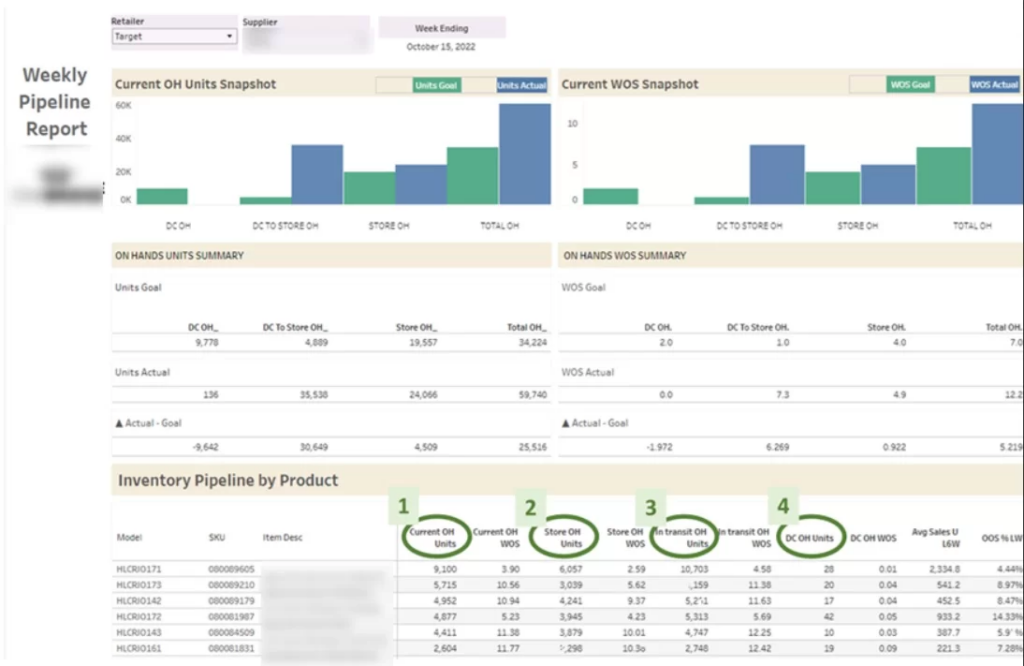
Our BI experts built a custom retail inventory dashboard that consolidates store-level inventory and sales data into a single analytical view.
The dashboard visualises how much inventory retailers hold in-store (On Hand) and calculates Weeks of Supply (WOS) based on sales velocity. It highlights products that fall below target coverage levels and tracks out-of-stock performance over time to support replenishment decisions.
Key Metrics:
This dashboard supports an availability-focused supply chain strategy. Leadership can proactively identify products at risk of stockouts and initiate data-backed replenishment discussions with retail partners.
By monitoring WOS and OOS% together, supply chain and sales teams can justify increased order quantities and optimise distribution planning. This reduces lost sales, improves shelf availability, and strengthens retailer negotiations.
Strategically, the dashboard transforms retailer inventory data into a demand and replenishment intelligence tool. It enables brands to align sales, supply chain, and retail relationship management around measurable availability metrics, strengthening the overall supply chain analytics strategy.
Many retailers, distributors, and FMCG brands struggle to maintain optimal stock levels across their product portfolio. Without clear visibility into current inventory, safety thresholds, and maximum capacity levels, businesses either run into stockouts or tie up excessive working capital in slow-moving stock.
When stock control relies on static reports or manual checks, replenishment decisions are reactive. This increases emergency restocking costs, reduces service levels, and creates unnecessary pressure on operations teams.
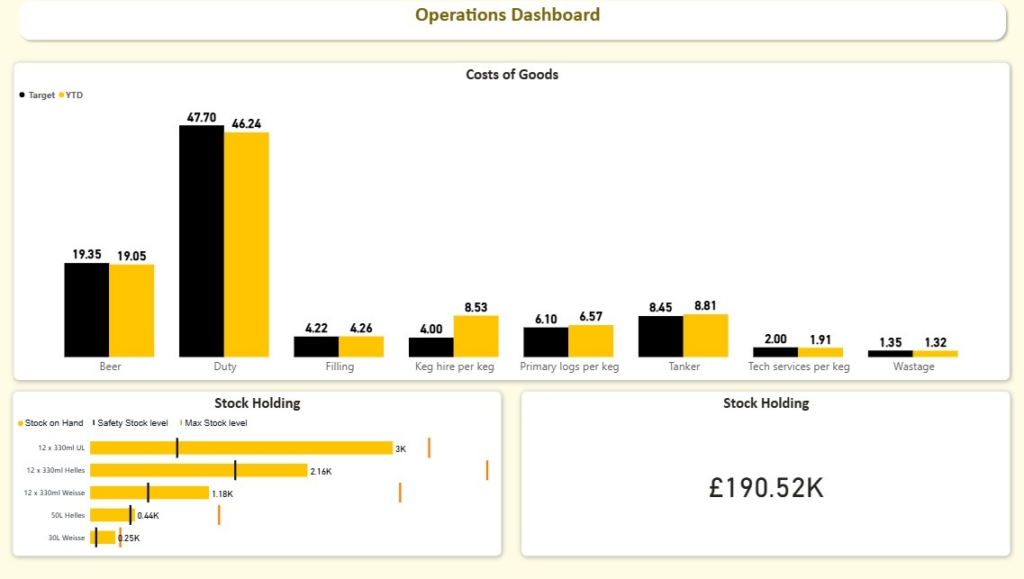
Our Power BI experts built a custom stock level dashboard that provides a real-time view of inventory health across all products.
The dashboard tracks Stock on Hand by product and calculates both Safety Stock Level and Max Stock Level based on demand patterns and lead times. It automatically highlights when inventory approaches critical thresholds, enabling proactive replenishment planning.
Key Metrics:
This dashboard supports a control-driven supply chain analytics strategy. Operations leaders can instantly see whether stock levels are within the optimal range and prioritise replenishment accordingly.
By monitoring safety thresholds in real time, the business reduces emergency restocking and protects service levels. At the same time, visibility into maximum stock levels prevents over-ordering and unnecessary capital lock-up.
Strategically, the dashboard turns inventory data into a working capital optimisation tool. It enables supply chain teams to balance availability and cost with measurable thresholds, strengthening overall inventory governance within the supply chain analytics strategy.
Many logistics-driven organisations struggle to maintain real-time visibility over warehouse inbound activity. Without structured operational analytics, teams cannot clearly see storage capacity constraints, unallocated stock, or handling bottlenecks.
When inbound deliveries are not monitored systematically, rack and bulk locations become congested, pallets remain unprocessed, and forklifts carry unfinished tasks. This reduces receiving efficiency, increases handling delays, and creates operational friction inside the warehouse.
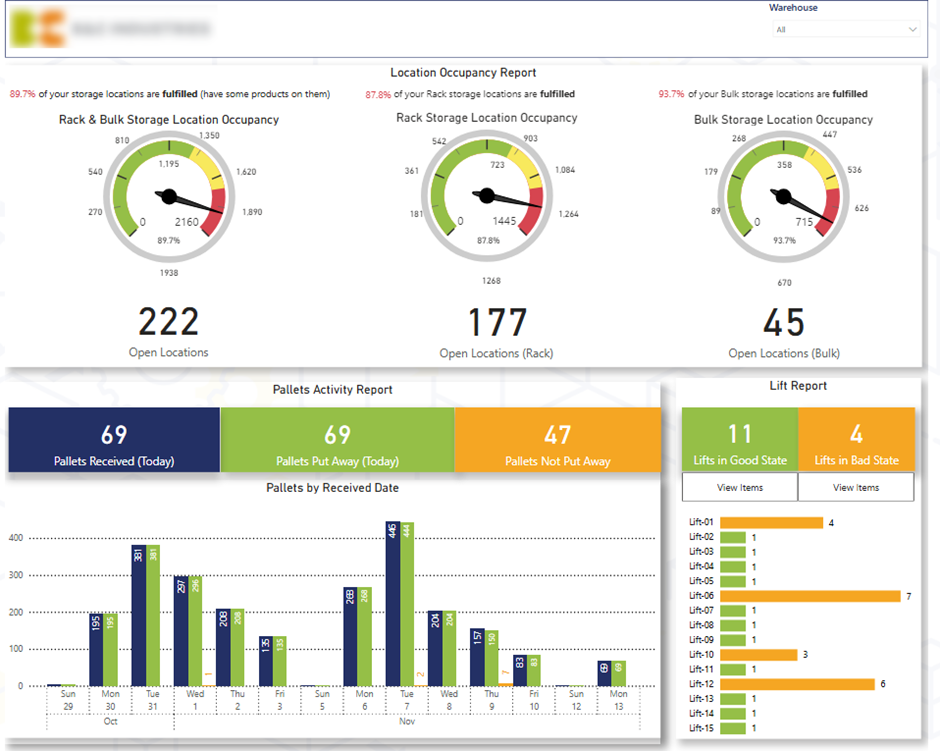
Our Power BI experts built a custom warehouse dashboard that provides a real-time operational health check for inbound warehouse activity.
Key Metrics:
This dashboard supports an efficiency-focused supply chain analytics strategy. Warehouse managers can immediately identify storage constraints and rebalance inbound flows before congestion escalates.
Visibility into unprocessed pallets and items left on forklifts enables task prioritisation and faster clearance of inbound stock. This improves space utilisation, accelerates receiving cycles, and reduces handling delays.
Strategically, the dashboard transforms warehouse activity data into operational performance intelligence. It allows supply chain leaders to optimise inbound throughput, storage capacity, and labour allocation based on measurable real-time indicators.
Many warehouse operations lack structured visibility into outbound order flow and delivery readiness. Without clear tracking of order status and shipping delays, bottlenecks in allocation, picking, packing, or staging go unnoticed until service levels decline.
When late shipments are identified too late, teams react under pressure. This leads to inconsistent throughput, missed delivery targets, and reduced customer satisfaction.
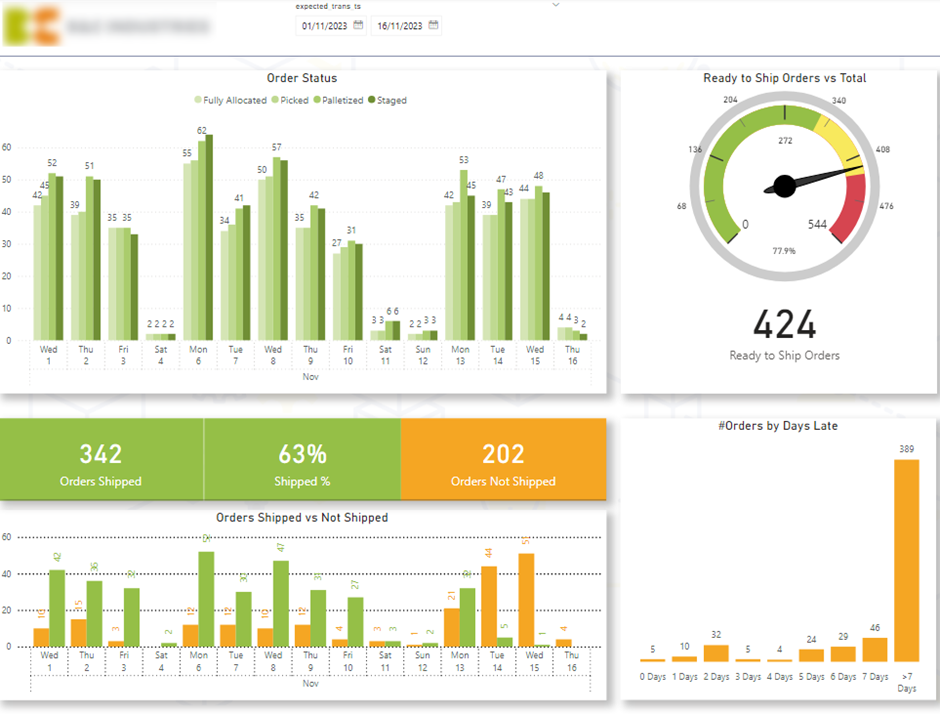
Our data visualization experts built a custom outbound warehouse dashboard that provides full visibility into order processing and delivery performance.
Key Metrics:
This dashboard supports a service-level-driven supply chain analytics strategy. Warehouse managers can monitor readiness in real time and maintain consistent outbound throughput across the week.
Status-level visibility enables teams to identify whether delays originate in allocation, picking, packing, or staging and address the root cause quickly. Late-order analysis allows proactive prioritisation of delayed shipments before customer commitments are breached.
The dashboard transforms outbound activity data into delivery performance intelligence. It strengthens on-time shipping rates, improves customer satisfaction, and aligns warehouse operations with measurable service-level targets within the broader supply chain analytics strategy.
Large organisations operating across multiple countries often struggle to maintain clear visibility over procurement approvals and budget control. Purchase requests move through multiple stakeholders, regions, and systems, making it difficult to track where requests are delayed or whether spend has been properly authorised.
Without structured procurement analytics, approval bottlenecks remain hidden, budget overruns go unnoticed, and audit readiness becomes reactive instead of controlled. This increases governance risk and reduces confidence in procurement processes.
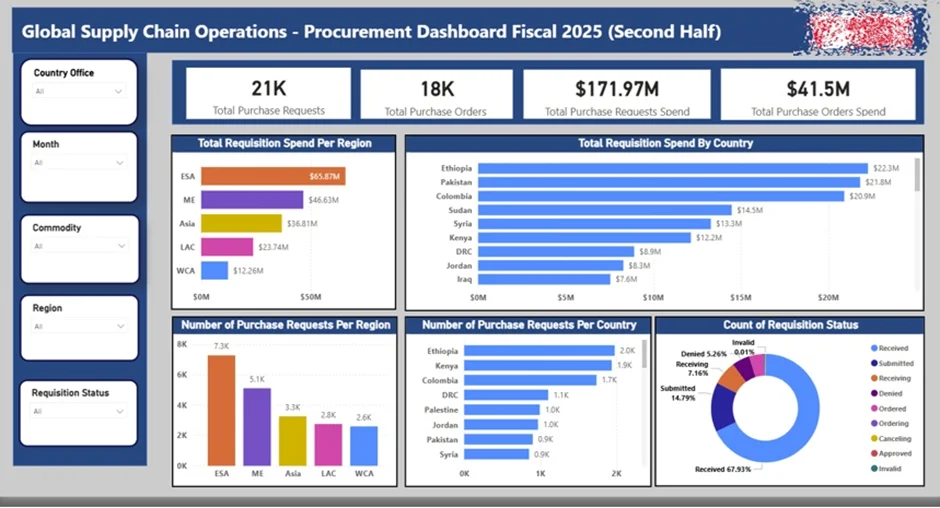
Our team built a custom procurement dashboard that provides full transparency across the request-to-purchase lifecycle.
Key Metrics:
This dashboard supports a governance-driven supply chain analytics strategy. Procurement leaders can monitor approval workloads in real time and identify bottlenecks before they delay operations.
By linking requests directly to approved budgets and purchase orders, the business strengthens spend control and reduces the risk of unauthorised purchasing. Regional breakdowns also enable leadership to compare procurement activity across countries and ensure consistent governance standards.
Strategically, the dashboard transforms procurement data into a control and compliance intelligence tool. It improves audit readiness, enhances budget discipline, and aligns global purchasing processes with measurable oversight within the broader supply chain analytics strategy.
Supply chain analytics solutions help businesses move from basic reporting to smarter planning, faster decisions, and better operational control. The best solutions connect data across procurement, inventory, warehousing, transportation, suppliers, finance, and customer demand, then turn that data into useful insights.
Demand forecasting helps businesses predict future customer demand using historical sales, seasonality, market trends, promotions, and external signals. This makes it easier to plan purchasing, production, inventory, and fulfilment.
With better demand forecasting, businesses can reduce stockouts, avoid excess inventory, improve service levels, and respond faster when demand changes.
Inventory optimization helps businesses maintain the right stock levels across products, locations, and channels. It shows which items are overstocked, understocked, slow moving, or at risk of running out.
This capability helps teams improve stock availability, reduce carrying costs, free up working capital, and rebalance inventory across warehouses or stores.
Supplier performance tracking gives teams visibility into supplier reliability, lead times, order accuracy, cost changes, and quality issues. It helps procurement and supply chain teams identify which suppliers are performing well and which ones are creating delays or risk.
This insight can support supplier reviews, contract negotiations, sourcing decisions, and contingency planning.
Transportation analytics helps businesses monitor freight costs, carrier performance, route efficiency, delivery times, and shipment delays. It can show which routes are becoming more expensive, which carriers are missing service targets, and where delivery bottlenecks are happening.
This helps logistics teams improve on-time delivery, reduce freight costs, optimize routes, and make better carrier decisions.
Warehouse analytics focuses on the performance of warehouse operations. It can track inbound volumes, picking accuracy, order cycle times, storage utilization, labour productivity, and fulfilment speed.
These insights help warehouse teams improve throughput, reduce errors, manage capacity, and identify process bottlenecks before they affect customer orders.
Network modelling helps businesses understand how products, suppliers, warehouses, transport routes, and customers are connected. Scenario planning allows teams to test different options before making major decisions.
For example, a business can model what happens if demand increases, a supplier is delayed, freight costs rise, or a new warehouse is added. This supports better decisions around distribution networks, sourcing, inventory placement, and risk management.
Real-time visibility helps teams monitor supply chain performance as events happen. Instead of waiting for weekly or monthly reports, teams can see delays, stock risks, cost changes, or service issues earlier.
Alerts can notify decision-makers when a shipment is late, inventory drops below a threshold, supplier lead times increase, or transport costs exceed expectations. This helps teams act faster and reduce disruption.
Sustainability and emissions tracking helps businesses measure the environmental impact of their supply chain. This can include freight emissions, fuel usage, supplier sustainability performance, waste, packaging, and energy consumption.
By tracking these metrics, businesses can identify opportunities to reduce emissions, improve compliance, choose more sustainable suppliers, and build a more responsible supply chain.
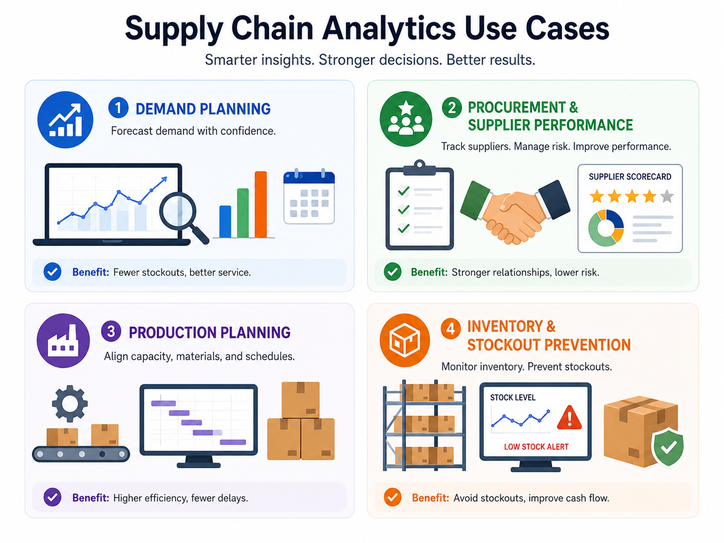
Supply chain analytics can be used across different parts of the supply chain to improve planning, reduce waste, manage risk, and make faster decisions. Below are some of the most common use cases.
Supply chain analytics helps businesses forecast future demand by analysing sales history, seasonality, customer behaviour, promotions, and market trends. This allows teams to plan purchasing, production, inventory, and fulfilment more accurately.
With better demand planning, businesses can reduce stockouts, avoid overstocking, improve customer service, and respond faster when demand changes.
Analytics helps procurement teams track supplier lead times, pricing, order accuracy, delivery performance, and quality issues. It gives businesses a clearer view of which suppliers are reliable and which ones may be creating delays, cost increases, or supply risks.
These insights can support supplier reviews, contract negotiations, sourcing decisions, and backup supplier planning.
Supply chain analytics supports production planning by connecting demand forecasts, raw material availability, supplier lead times, labour capacity, and manufacturing schedules. This helps teams understand what needs to be produced, when it should be produced, and whether the required materials and resources are available.
It can also help identify production bottlenecks, capacity issues, and delays before they affect customer orders.
Analytics helps businesses monitor stock levels, reorder points, safety stock, slow-moving items, and products at risk of running out. This makes it easier to maintain the right amount of inventory across warehouses, stores, and sales channels.
By using analytics for inventory and stockout prevention, teams can reduce excess stock, free up working capital, improve availability, and avoid missed sales caused by out-of-stock products.
Technology plays a central role in executing a supply chain analytics strategy. The right tools help collect data, structure it, visualise it, and turn it into actionable insight across sourcing, inventory, warehousing, and procurement.
Below are the main categories of tools that support a strong analytics foundation.
If you are looking to implement or improve this layer, explore our Business Intelligence consulting services to see how we design scalable, decision-focused BI solutions.
No single tool defines a strong supply chain analytics strategy. The value comes from how these systems are connected and aligned with business objectives. When integrated properly, they create a reliable data foundation that supports cost control, service improvement, and operational stability.
Building a supply chain analytics strategy is not about starting with dashboards. It starts with business priorities and works backwards into data, metrics, and decision processes.
Below is a practical framework we use when designing supply chain analytics strategies.
1. Define Clear Business Objectives
Start with measurable goals that link directly to financial or operational impact. Supply chain analytics should support outcomes that matter to leadership, not just operational reporting.
Examples include reducing landed cost by 5%, improving on-time delivery to 98%, reducing stockouts by 30%, or freeing up 10% of working capital tied up in inventory. Without clear objectives, analytics becomes reporting for reporting’s sake.
2. Identify Core Supply Chain KPIs
Once objectives are defined, translate them into specific and trackable metrics:
KPIs should remain focused and clearly owned by departments. Too many metrics dilute accountability and make prioritisation difficult.
3. Map and Connect Data Sources
Supply chain data typically sits across multiple systems, including ERP platforms for orders and finance, WMS tools for warehouse activity, inventory systems, retailer portals, and customs or trade platforms.
A strong analytics strategy defines how these systems integrate into a central data model. Clean, consistent, and connected data builds trust. Without it, dashboards will not drive action.
4. Build Role-Specific Dashboards
Different teams require different visibility. Procurement focuses on approvals and budget control. Operations monitors stock levels and replenishment. Warehouse teams track inbound and outbound flow. Leadership reviews margin, service levels, and working capital.
Dashboards should be designed around decisions. If a dashboard does not influence a specific action, it does not belong in the strategy.
5. Establish Governance and Ownership
Analytics must have structure and accountability. Every KPI should have a clear owner, a defined review cadence, and a predefined action when thresholds are breached.
For example, if Weeks of Supply drops below the safety threshold, replenishment should be triggered. If out-of-stock rates exceed target levels, the issue should be escalated to the retail account team. If inbound pallets are not put away within capacity limits, labour allocation may need adjustment.
This step turns reporting into operational control. Without governance, insights remain passive.
6. Move From Visibility to Proactive Optimisation
Once descriptive reporting is stable, the strategy should mature. Predictive and prescriptive analytics can then be layered in to anticipate issues before they impact performance.
This may include demand forecasting models, lead time variability analysis, automated replenishment recommendations, or warehouse capacity forecasting. The goal is to shift from reacting to problems to preventing them.
A supply chain analytics strategy does more than improve reporting. It creates structure, visibility, and accountability across sourcing, inventory, logistics, and procurement.
When data is connected and aligned with business objectives, supply chain performance becomes measurable and controllable. The benefits extend beyond operations, directly influencing margin, cash flow, service levels, and long-term competitiveness.
1. Improved Cost Control
A supply chain analytics strategy gives leadership clear visibility into cost drivers across sourcing, logistics, inventory, and procurement. Instead of reviewing expenses retrospectively, teams can monitor landed cost, tariff exposure, warehouse handling costs, and cost-to-serve in real time.
This enables faster corrective action and protects margin before inefficiencies compound.
2. Better Inventory Management
Structured analytics improves control over stock levels, safety thresholds, and replenishment cycles. Businesses can reduce stockouts while avoiding excess inventory that ties up working capital.
The result is stronger availability with healthier cash flow.
3. Higher Service Levels
With visibility into on-time delivery, order readiness, and warehouse throughput, businesses can detect performance gaps early. Delays can be addressed before customer commitments are breached.
Consistent monitoring strengthens reliability and improves customer satisfaction.
4. Faster and More Confident Decision-Making
When procurement, operations, and leadership work from the same data model, decisions become clearer and faster. Dashboards reduce dependency on manual reporting and eliminate conflicting numbers across departments.
This alignment improves accountability and shortens review cycles.
5. Reduced Operational Risk
Supply chain disruptions, supplier delays, and capacity constraints are easier to identify when data is structured and monitored consistently.
Analytics highlights bottlenecks, approval delays, or demand shifts early, allowing teams to respond proactively instead of reactively.
6. Stronger Governance and Compliance
In global organisations, procurement approvals, budget control, and trade compliance require structured oversight. A supply chain analytics strategy ensures visibility into approval workflows, spend controls, and regulatory exposure.
This improves audit readiness and reduces governance risk.
7. Long-Term Competitive Advantage
Over time, consistent use of supply chain analytics builds institutional knowledge. Trends become clearer, forecasting improves, and operational decisions become more data-driven.
Organisations that embed analytics into daily operations operate with greater control, efficiency, and resilience than competitors relying on fragmented reporting.
Implementing a supply chain analytics strategy is not only a technical project. It requires structured data, clear ownership, cross-department alignment, and ongoing maintenance.
Many organisations struggle not because dashboards are difficult to build, but because the underlying data, processes, and accountability structures are not fully aligned. Understanding these common challenges helps businesses design a more realistic and sustainable analytics strategy.
Supply chain analytics is moving beyond static dashboards toward predictive and decision-driven systems. Businesses are increasingly using forecasting models to anticipate demand shifts, supplier delays, and capacity constraints before they disrupt operations. The focus is shifting from explaining what happened to preparing for what is likely to happen next. Advanced supply chain analytics enables real-time visibility, proactive planning, and increased efficiency across various supply chain functions, supporting better decision-making and operational performance.
Real-time visibility is becoming more common as ERP, WMS, and inventory platforms are better integrated. Faster data refresh cycles allow teams to react quickly to stock risks, warehouse congestion, and delivery delays, reducing operational friction and service issues.
Artificial intelligence and automation will continue to expand. Replenishment triggers, approval workflows, and performance alerts are gradually becoming automated based on predefined thresholds. This reduces manual monitoring and allows teams to concentrate on higher-value planning activities.
Supply chain analytics is also becoming more closely linked to financial and strategic planning. Inventory levels, service performance, supplier risk, and sustainability metrics are increasingly analysed alongside margin and cash flow. As a result, supply chain performance is no longer treated as purely operational, it becomes a core driver of overall business resilience and competitiveness.
A supply chain analytics strategy is no longer optional. As supply chains become more complex, businesses need structured visibility across sourcing, inventory, warehousing, logistics, and procurement to control cost, protect service levels, and manage risk.
When data is connected, KPIs are clearly defined, and dashboards are aligned with decision-making, supply chain performance becomes measurable and continuously optimised. Instead of reacting to problems, your teams can anticipate issues, act earlier, and operate with greater confidence.If you are ready to design or improve your supply chain analytics strategy, contact us! We will help you connect your data, define the right KPIs, and build decision-focused dashboards that support real operational impact.
Supply chain analytics is the process of using data to understand and improve how products, materials, costs, and information move through the supply chain. It helps businesses monitor performance, identify problems, predict risks, and make better decisions across procurement, inventory, warehousing, transportation, and delivery.
A supply chain analytics strategy is a plan for how a business will collect, manage, analyse, and use supply chain data to improve performance. It defines the key goals, data sources, KPIs, tools, dashboards, decision processes, and teams needed to turn supply chain data into practical business actions.
Supply chain analytics needs data from procurement, suppliers, inventory, warehouses, transportation, sales, finance, and customer demand. Common examples include purchase orders, supplier lead times, stock levels, shipment status, delivery performance, sales forecasts, production schedules, freight costs, and external data such as weather, fuel prices, tariffs, and market demand.
The four main types of supply chain analytics are descriptive, diagnostic, predictive, and prescriptive analytics. Descriptive analytics shows what happened, diagnostic analytics explains why it happened, predictive analytics forecasts what is likely to happen next, and prescriptive analytics recommends what action to take.
Supply chain analytics improves inventory management by showing which products are overstocked, understocked, slow moving, or at risk of running out. It helps businesses set better reorder points, adjust safety stock, rebalance inventory across locations, reduce excess stock, prevent stockouts, and free up working capital.
Common supply chain analytics use cases include demand planning, procurement analysis, supplier performance tracking, production planning, inventory optimization, warehouse analytics, transportation analytics, route optimization, cost control, risk monitoring, and sustainability tracking.
Supply chain dashboards should track KPIs such as forecast accuracy, inventory turnover, stockout rate, order fulfilment rate, on-time delivery, supplier lead time, purchase price variance, warehouse throughput, order cycle time, freight cost per shipment, perfect order rate, and supply chain cost as a percentage of revenue.
Supply chain analytics can use tools such as ERP systems, warehouse management systems, transportation management systems, procurement platforms, data warehouses, business intelligence tools, dashboard software, forecasting tools, and AI or machine learning platforms. Common BI and analytics tools include Power BI, Tableau, Qlik, Looker, and cloud data platforms such as Snowflake, BigQuery, and Azure.
The biggest challenges include disconnected data, poor data quality, inconsistent definitions, legacy systems, limited real-time visibility, lack of analytics skills, unclear KPIs, and difficulty turning insights into action. Many businesses also struggle when teams rely on spreadsheets or separate systems that do not share data easily.
AI is used in supply chain analytics to improve forecasting, detect patterns, identify risks, automate alerts, recommend actions, and support faster decision-making. For example, AI can predict demand changes, flag potential stockouts, detect supplier delays, optimize routes, identify cost anomalies, and suggest better inventory or procurement decisions.


