
If you want an Amazon advertising Google Data Studio dashboard, the hard part is usually that your numbers live in two places. Sales sit in Seller Central, ad performance sits in Amazon Ads, and nobody has a single view of what the store is actually making once fees and spend are taken out.
We built this dashboard to fix exactly that. It pulls the organic sales from Seller Central and the paid numbers from Amazon Ads into one report, so an e-commerce manager can open a single link and see profit, ad spend and return without exporting anything.
The client was an e-commerce analytics retailer selling on Amazon. They wanted paid and organic sales in the same place, a clear read on profitability, and a way to tell which campaigns were pulling their weight and which were quietly burning budget. Here is what we built and how they use it.
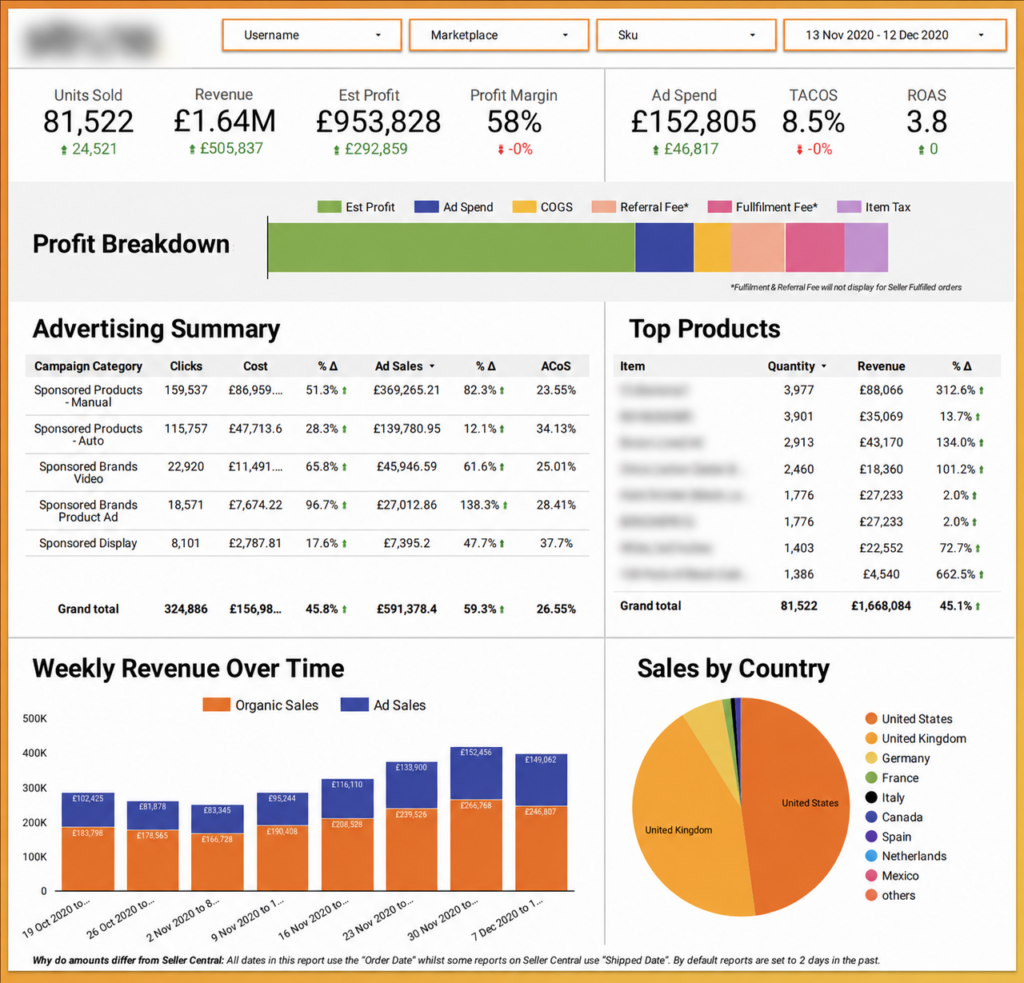
The first thing you see is the row of cards across the top: units sold, revenue, estimated profit, profit margin, ad spend, TACOS and ROAS, each for the date range you pick and each showing how it has moved since the last period. Below that, the profit breakdown bar splits revenue into its parts, so estimated profit sits next to ad spend, COGS, referral fees, fulfillment fees and item tax.
Then it gets more granular. The advertising summary table breaks spend down by campaign type, the top products table ranks best sellers by quantity and revenue, the weekly revenue chart stacks organic sales on top of ad sales, and the sales by country chart shows where the demand is coming from. It is worth knowing that referral and fulfillment fees do not show for seller-fulfilled orders.
Pulled together on one screen, this gave the team a read they could do in seconds. Rising TACOS against a slipping margin flagged when ad spend was starting to eat into returns. The fee breakdown showed how much of the top line survived Amazon’s cut and where there was still room to spend, and the split between organic and paid sales showed how much of the growth was being paid for rather than earned. It was data visualization doing its job, turning a pile of Amazon exports into one clear read on the business.
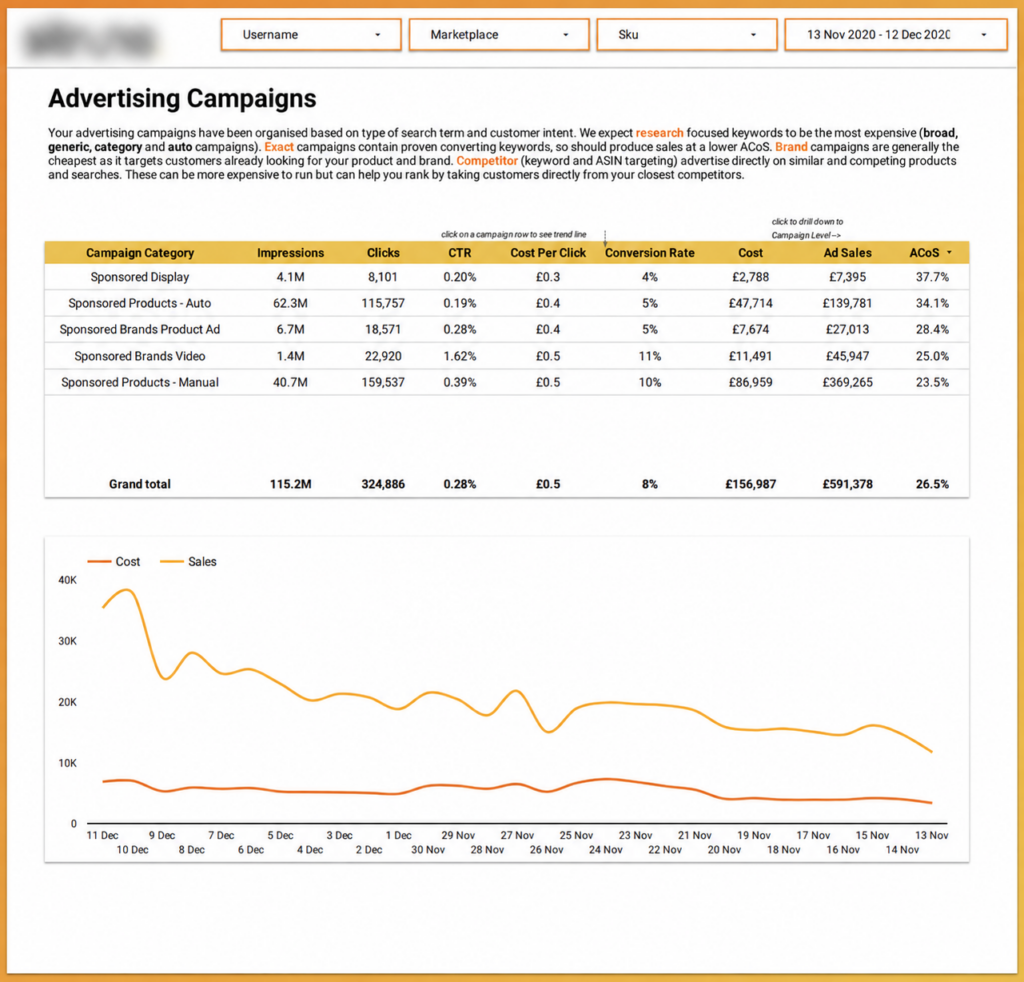
The campaign page is where the ad team spends most of its time, and where the marketing analytics really earn their keep. Campaigns are grouped by search term and buyer intent, from broad research keywords through to exact, brand and competitor targeting, so it is easy to see where the budget is working instead of staring at a flat list of campaign names. For each group the table lays out impressions, clicks, CTR, cost per click, conversion rate, cost, ad sales and ACoS, and the chart underneath plots ad cost against ad sales over time. You can click into any campaign row to see its trend line or drill down to the individual campaign.
Laid out this way, the spending decisions became clear instead of something to hunt for through reports. A campaign running at a high ACoS stood out straight away, which pointed to where more budget was worth putting behind the cheap converters and where spend needed tightening or pausing. Grouping by intent also set fair expectations, since research and competitor campaigns were always going to cost more while brand and exact campaigns held sales at a lower ACoS.
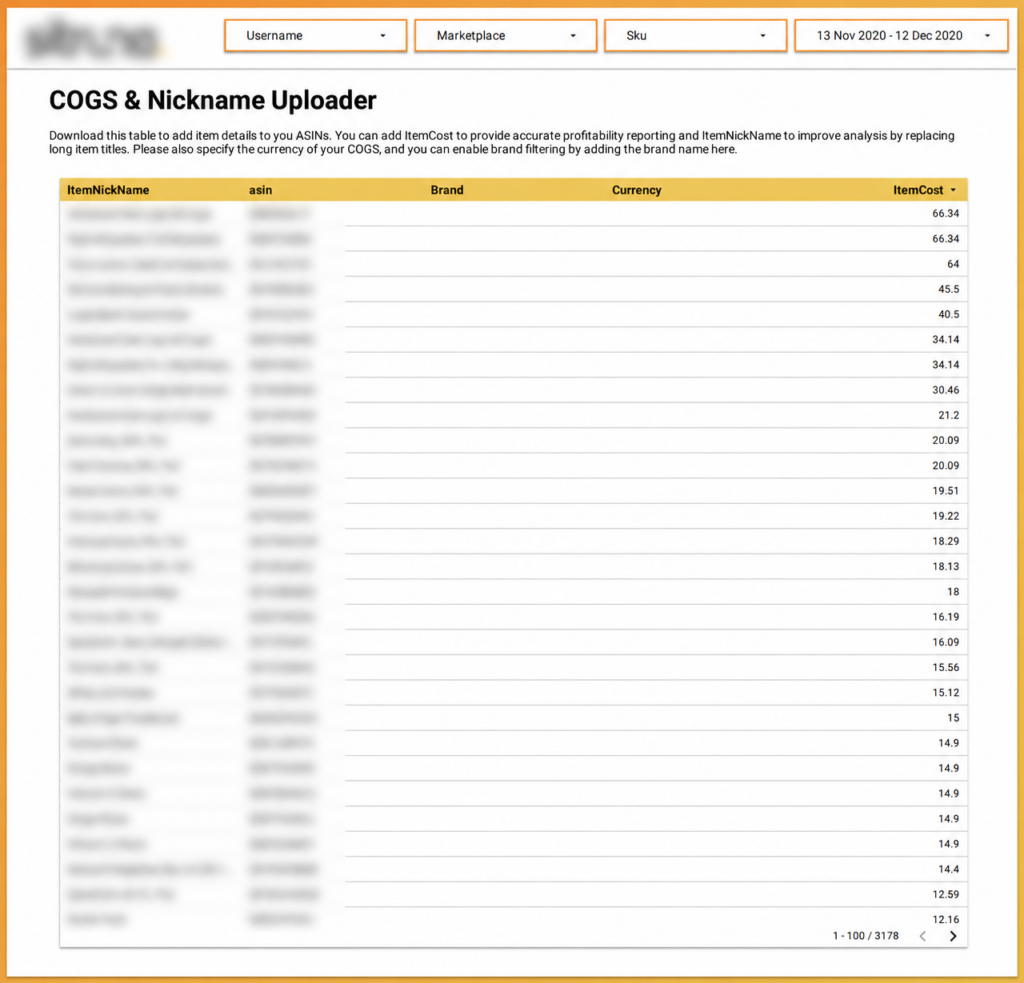
A profit figure is only as good as the cost data behind it, so we gave the client a simple way to keep that current. On this page they add a cost of goods and a short nickname for each ASIN, along with the currency and the brand. The item cost feeds straight into the profit and margin calculations across the rest of the report, the nicknames swap Amazon’s long product titles for something readable, and the brand field turns on brand-level filtering.
This was what made the profit numbers across the rest of the dashboard trustworthy rather than a guess. With accurate costs in place the team could read margins with confidence, and brand-level filtering let anyone running more than one brand narrow the whole report down and see how each was performing on its own.
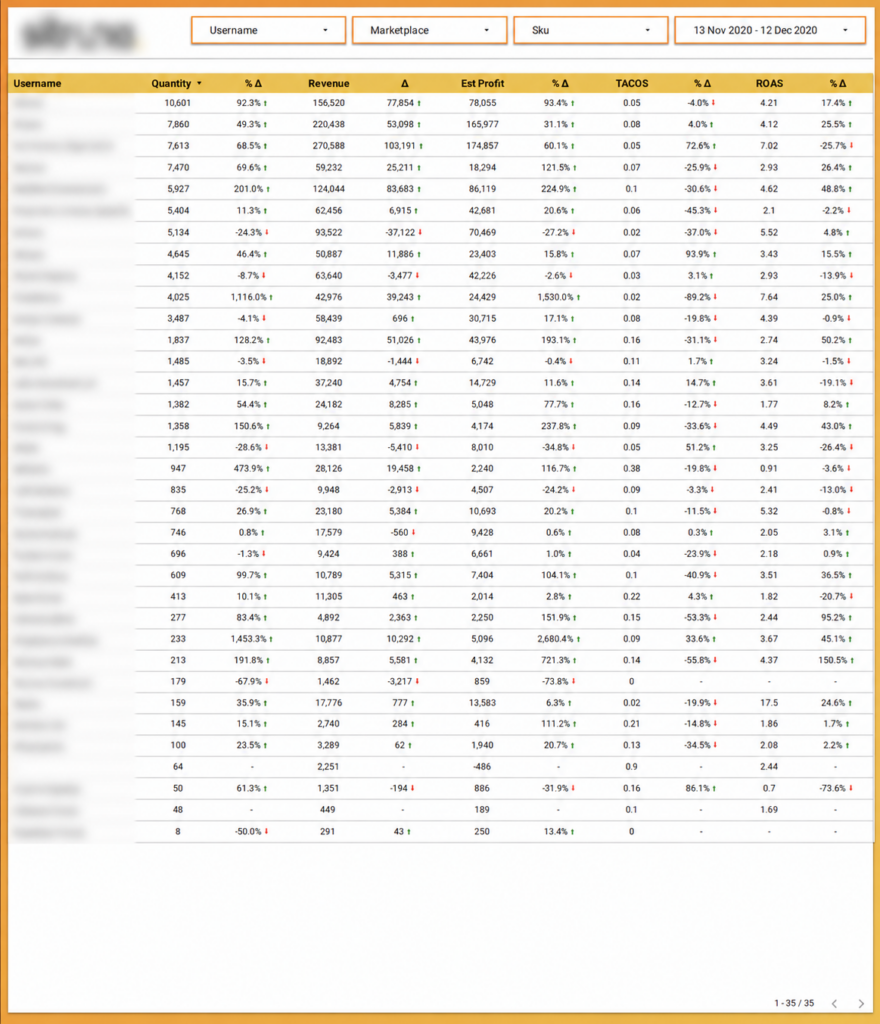
For anyone looking after several brands or accounts at once, this page rolls the numbers up per account for fast management reporting: units, revenue, estimated profit, TACOS and ROAS, each with the change on the previous period.
Instead of a stack of separate account reports, that roll-up put the whole portfolio in one view. The accounts that were growing, the ones losing money and the ones where a strong ROAS pointed to room for more spend all stood out side by side, which was the overview needed to see where attention was worth spending first.
Amazon does not have a native Google Data Studio connector, so the data has to be brought in before you can report on it. There are a few ways to do it, and the right one depends on how current the numbers need to be and how much you want to automate.
You can export from Amazon Ads and Seller Central and load the files into Looker Studio for a one-off or monthly report. You can use a third-party connector to pull Amazon Ads into Looker Studio on a schedule. Or you can build a data pipeline from the Amazon Advertising API into a data source that Looker Studio reads from, which is the most flexible option when you are combining ads with Seller Central sales like we did here. This is the kind of API integration work we handle as part of our data integration consulting services, so the pipeline is built once and keeps running. For this dashboard we brought the Amazon Ads and Seller Central data into a single model so the paid and organic numbers line up.
We built this report in Google Data Studio, now called Looker Studio. It connects to the Amazon Ads and Seller Central data, refreshes on a schedule so nobody is exporting spreadsheets by hand, and shares with a team through a single link.
The thinking behind it is the same whatever tool you use. We automate the pull from the APIs, clean and transform the data, and model organic and paid sales together so that profit, TACOS and ROAS all come out correct rather than being stitched together after the fact. We build the same kind of report in Power BI and Tableau too, so if your team already lives in one of those we can go that way instead.
Selling on Amazon gets a lot easier to manage when your ads and your sales sit in one view instead of two. This dashboard gives an e-commerce team the whole picture, from profit and TACOS down to which campaigns are worth scaling, and it stays current without anyone rebuilding a spreadsheet. If that is the kind of clarity you want over your own Amazon performance, get in touch and we will build an Amazon advertising Google Data Studio dashboard around what you sell!
Amazon advertising is the set of paid ad formats Amazon offers sellers and brands, including Sponsored Products, Sponsored Brands and Sponsored Display. It sits inside Amazon Ads and runs on your product listings and search results to drive visibility and sales.
It is one report that brings your Amazon Ads spend together with your Seller Central sales, so you can see revenue, profit, ad cost and return in the same place instead of across separate exports.
Looker Studio, formerly Google Data Studio, is Google’s free reporting and visualization tool. It connects to data sources like Amazon Ads and Seller Central and turns them into shareable dashboards, which is what we used to build the report on this page.
ACoS compares ad spend to the sales that came from ads. TACOS compares ad spend to total sales, both organic and paid, which shows how much your overall revenue leans on advertising.
Yes. We build them in Google Data Studio, also known as Looker Studio, and we also work in Power BI and Tableau. The data pipeline and the metrics are the same in each.
Yes. We pull organic sales from Seller Central and paid performance from Amazon Ads, then model them together so profit and margin are worked out across both.
An Amazon Ads connection or export, your Seller Central sales, and a cost of goods figure for each ASIN so the profit numbers are accurate.

Support
All the support you need – when you need it. From 1-hour quick fix support to longer-term partnership that drives your business forward.

Consultancy
Advanced data thinking, creative ideas and the best Power Platform practices to unlock the true potential of your business data.

Training
Succeess shouldn’t be a one-off. When we train you teams user adoption surges and your Power Platform results radically improve.


