
Financial planning and analysis is going through a major shift. As data piles up and planning cycles speed up, FP&A teams are ditching static spreadsheets for integrated platforms that give real-time visibility and scenario modelling on a large scale. Microsoft Power BI for FP&A has become the foundation for this transformation, allowing finance pros to bring budgeting, forecasting, and performance reporting into one place where it gets governed.
I spent 3+ years as a Financial BI Analyst at Autodesk where I helped develop Power BI reports for the CFO, Financial Directors, and VPs of Finance. Since then I started a Power BI consultancy in 2022 and my team has now delivered over 100 financial dashboards for clients like Google, Teleperformance, and Heineken.
Finance teams in today’s world are operating in a super-fast, really complex environment. Planning cycles are shorter and there are way more data sources than ever before. ERPs, CRMs, and operational systems are all pumping out data like crazy. Traditional FP&A workflows built around spreadsheets and manual exports just can’t keep up.
Using Power BI as a central platform for financial business intelligence, planning, analysis, and reporting is what we call “Power BI for FP&A”. This means taking data from multiple systems, working it into a governed model and presenting it in interactive dashboards. It lets finance teams manage budget, forecasts, and performance in one place.
The result is a much simpler and more scalable FP&A process where stakeholders can all access the same numbers, drill down into the detail and make decisions without having to rely on static reports. No more exporting data, manually mapping accounts and sending around Excel files via email.
Switching to Power BI for FP&A brings both strategic advantages – better business decisions through improved visibility – and operational gains through time saved on manual processes. Finance teams that’ve made the switch report huge changes in how they use their analyst time and how they work with business partners.
In practice, organisations can cut their variance analysis lead time from days to hours. Annual budget cycles get shorter by 20-40% through automation. Finance analysts shift from spending up to 70% of their time gathering data to spending that same amount of time on actual analysis and business partnering.
Power BI automates data extraction through native data integrations, transforms it using Power Query and refreshes dashboards using Power BI Service. This gets rid of manual exports and repeated Excel updates, so dashboards can refresh on a schedule or in near real-time.
One of our clients at Vidi Corp was able to get their report generation time down from 48 hours to under 5 minutes and cut manual data consolidation by 95%. This helped them switch to daily reporting instead of monthly
Power BI makes it easier to present financial insights by turning complex datasets into structured, interactive visuals with clear KPIs. This helps finance teams get their message across to stakeholders about performance, risks and opportunities in Power BI financial dashboards which is a format that’s easy to understand and act on.
One of our projects saw improved dashboard usability which contributed to a 20% increase in service revenue by enabling earlier intervention based on performance trends.
Power BI eliminates the need to send around huge Excel files which often won’t open on older laptops and are pretty useless on mobile devices. This limits C-level execs who need to review financial performance while on the go.
Instead, FP&A teams can publish dashboards through Power BI service which is a secure web portal, letting stakeholders access reports without having to download them. The Power BI mobile app also lets them access from phones and tablets, while ensuring everyone is working from the same, up-to-date version of the data.
One of our clients at Vidi Corp said they got a 50% reduction in time preparing and sharing reports, as well as improved data accuracy and consistency across stakeholders
Power BI keeps financial data consistent and secure by combining several built in controls that work together behind the scenes. It uses a centralised data model, so all reports and dashboards pull from the same structured dataset rather than separate Excel files. This creates a strong data governance for analytics and gives a single source of truth where KPIs, calculations and definitions are standardised across the organisation.
On top of all the other great stuff Power BI has to offer, it includes some nifty row-level security features that let finance teams dictate exactly what each user can see. So for instance, a regional manager can be configured to only have access to data that relates to their region, while executives get to see the whole picture – the company performance from start to finish. Permissions are managed through user roles and all interactions with the data are tracked, giving you clear audit trails and reducing the risk of version conflicts or sneaky changes that nobody’s supposed to be making.
Power BI is built to handle massive, super complex datasets that blow Excel out of the water. Rather than slowing down as the data piles up, it uses an optimised data model and in-memory processing to blast through millions of rows in no time. This means that FP&A teams can work with super detailed, transaction-level data across revenue, costs, cash flow, and all the other key financial areas without running into any performance issues.
Take our case study for Neterra Telecom, for example we implemented a telecom business intelligence dashboards on the database with dozens of millions of rows. We set up a solution that loaded fast and was used across multiple departments, including finance, sales and ops. As a result, the company spotted a nice little cost-saving opportunity of €50,000 pretty much as soon as they launched, generated €10-20K in new monthly recurring revenue, and saved themselves the hassle of having to employ a full-time analyst to keep up with making Excel reports.
FP&A teams are constantly getting asked for ad-hoc reports from all corners of the business. Sales teams want quick exports, managers want one-off breakdowns, and leadership wants fast answers to their specific questions. In the old days, this would put finance analysts in a reactive role, spending hours digging data out of Excel when they could be focusing on analysis.
Power BI flips this on its head by giving stakeholders direct access to the governed datasets. Users can explore dashboards, filter the data and even export what they need to Excel without having to bug finance all the time. And with the new capabilities in Microsoft Fabric, it gets even better – AI-powered data agents that let users ask questions in plain English and get instant answers. This cuts down on interruptions for FP&A teams and lets them focus on higher-value work like forecasting and scenario planning.
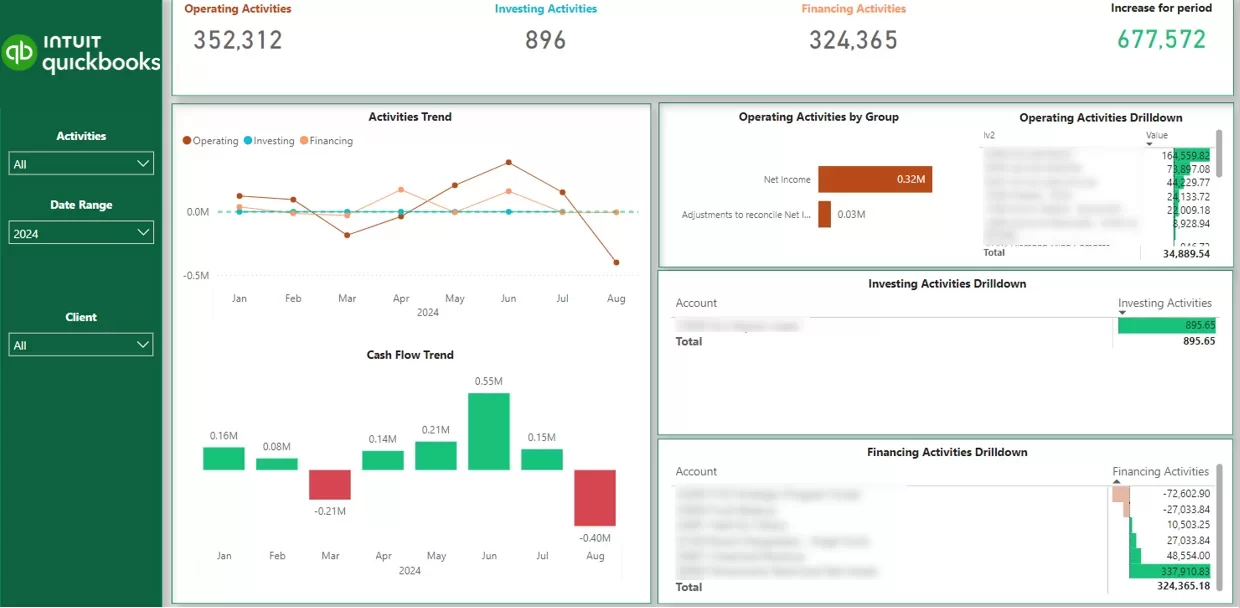
Power BI lets FP&A teams build dynamic cash flow models that give them a real-time view of their current cash position and short-term liquidity. By tying in data from accounting systems, CRMs and payroll platforms, finance teams can create rolling forecasts – like a 13-week cash flow model that updates automatically as new transactions come in. This lets financial directors keep a close eye on whether the business can fund upcoming initiatives and keep enough cash in the bank for ongoing operations.
Based on our experience in Business Intelligence consulting, these dashboards break cash flow down into operating, investing, and financing activities, making it way easier to understand where cash is coming from and where it’s going. Analysts can quickly spot large or irregular payments, track trends and set runway thresholds to flag potential risks early. This structured view turns cash flow from a static report into a live decision-making tool that supports daily financial planning.
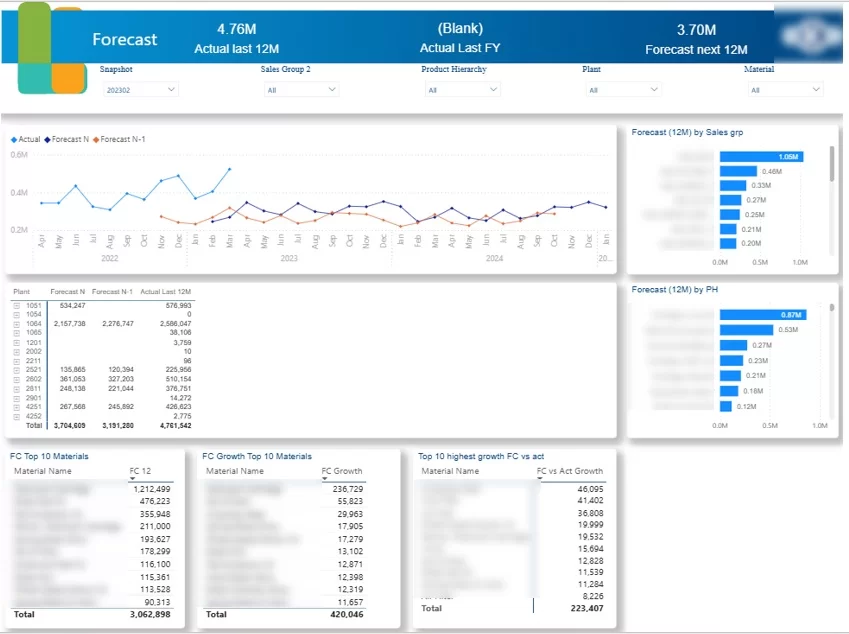
Power BI helps FP&A teams track how forecasts evolve over time and how accurate they are. In a lot of organisations, forecasts aren’t static – finance leaders update them all the time as new info comes in. For example, when I was a financial analyst, our finance director would adjust the quarterly revenue forecast every week, and by the end of the quarter we’d be analysing how each weekly forecast compared to actual results. Power BI makes this process more structured by visualising actuals vs forecast in one place and tracking forecast versions over time.
These dashboards usually combine forecast data with actual performance to highlight variances by week, month, product or region. A common approach is to build a weighted sales pipeline where each deal gets a probability of closing and contributes proportionally to the forecast. Power BI can then compare current forecasts with previous versions (e.g. Forecast N vs Forecast N-1) to measure forecast accuracy and spot systematic bias or over/underestimation trends.
In terms of implementation, forecasts are often created outside Power BI in Excel and then visualised in dashboards. But more advanced setups use Power BI forecasting features like DAX functions or AutoML to generate forecasts directly within the model. Either way, the goal is the same: giving CFOs and FP&A teams a clear, consistently updated view of expected performance and how reliable those expectations are.
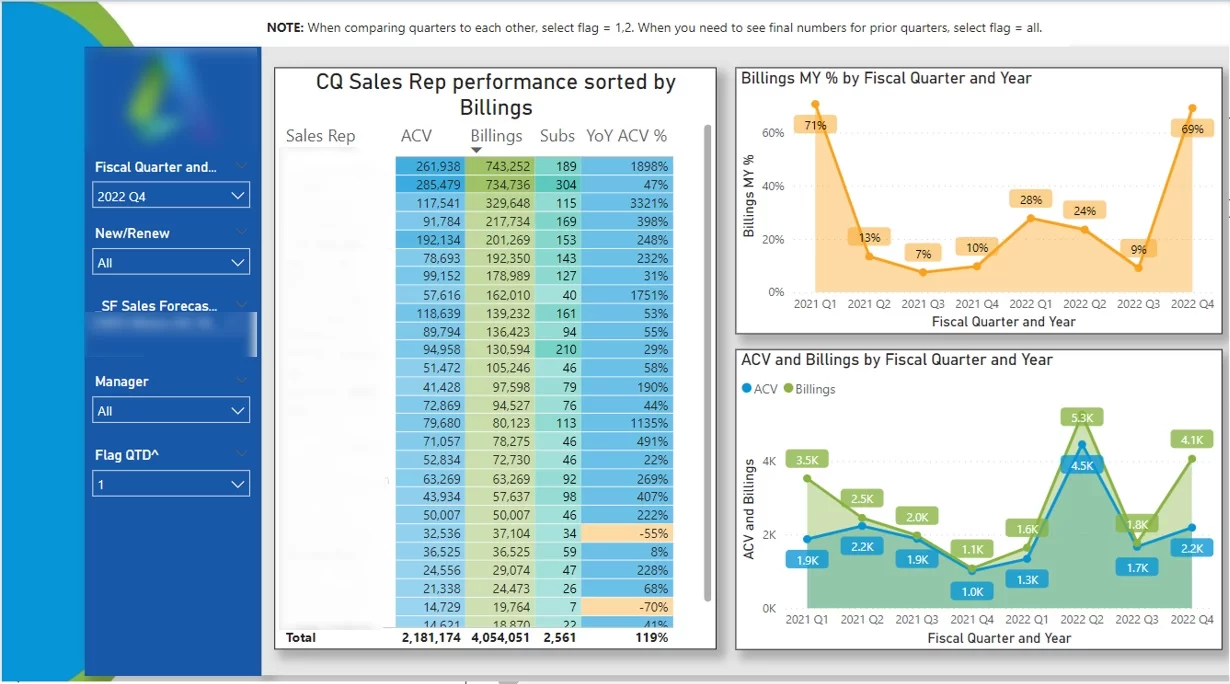
Power BI sales team dashboards are widely used by Finance Business Partners to support sales leaders with performance insights. In organisations like Autodesk, each sales team had a dedicated finance partner who’d analyse results and spot opportunities to boost revenue. These dashboards allow finance teams to break down performance by manager, sales rep, region and customer segment, helping them understand what’s driving results and where they need to step in.
In Practice, Finance Business Partners can have a look at the dashboard by a specific manager to check how their entire team is doing. From there, they can drill down into individual sales reps to have a gander at trends over time – such as quarterly revenue, pipeline development, or target achievement. This makes it super easy to pick out the top performers who can share their expertise and the reps who are underperforming and might need some extra leads, coaching or support.
By setting this analysis up in Power BI, finance teams can move beyond just reporting and start being active business partners. Instead of just tracking numbers, they can offer clear, data-backed recommendations that help sales directors to improve team performance and make better decisions on resource allocation.
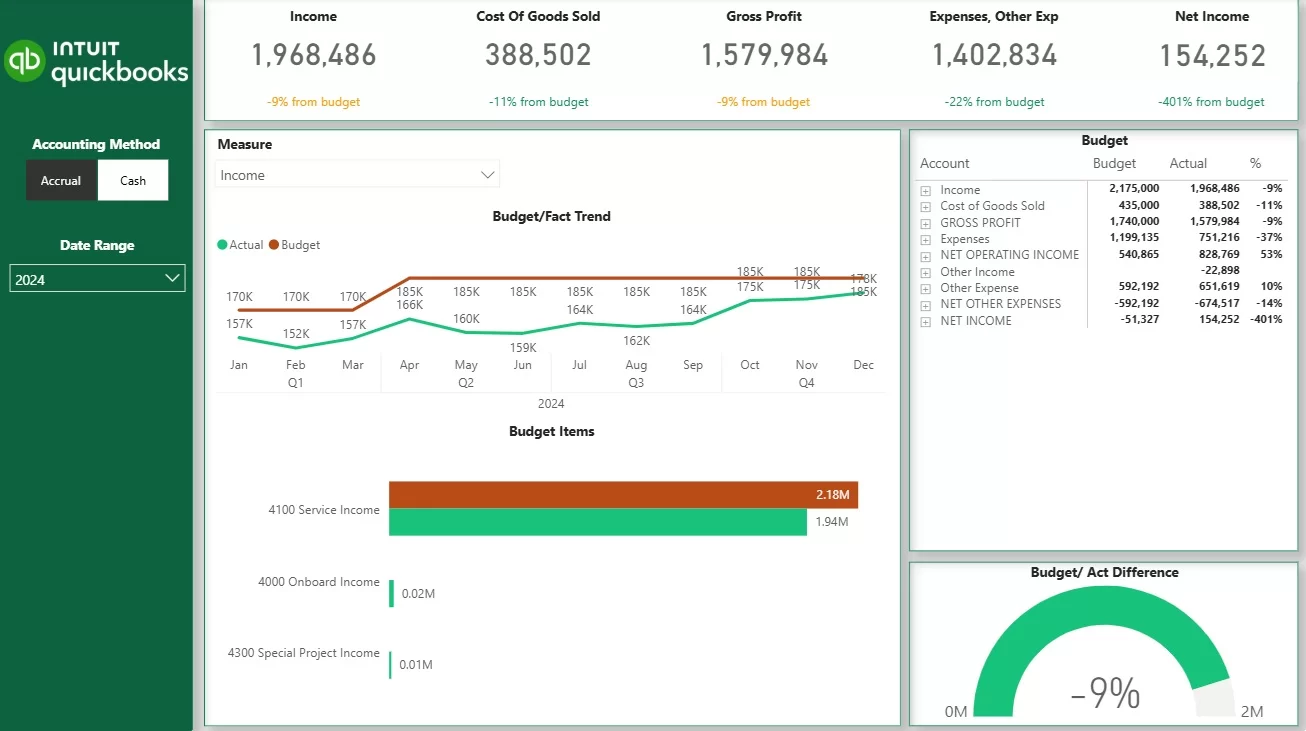
Actuals vs budget dashboards help CFOs and FP&A teams see how the business is doing in relation to its financial targets. Budgets get set once per year or quarter and stay fixed, so this analysis is about execution rather than prediction. Power BI puts these comparisons into one view, showing actual results alongside budgeted figures with clear variance calculations across revenue, costs, and profitability.
The level of detail all depends on how the budget is structured. Some organisations track budgets across the whole P&L, while others focus on specific areas like sales by product, department spend, or regional performance. Our Power BI developers usually build dashboards to match this structure, allowing users to drill down from high-level summaries into individual accounts or transactions to get to the bottom of exactly what’s driving the variances.
In practice, these CFO dashboards allow finance teams to quickly pick out overspending, underperformance, or areas that are exceeding expectations. This makes it much easier to explain results to stakeholders, adjust spending priorities, and make sure the business stays on track with its financial plan throughout the period.
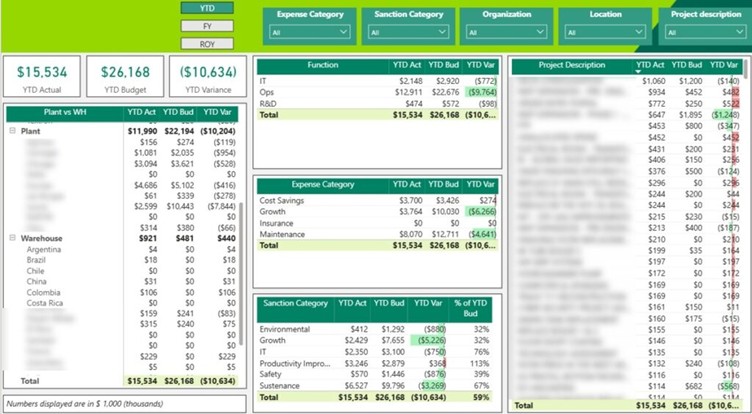
Expenses vs budget dashboards in Power BI help finance teams see how spending is lining up with planned budgets across different cost categories. This is especially important for capital expenditure (CapEx), where large investments in things like equipment, facilities, and infrastructure need to be carefully controlled. These dashboards give a clear view of how much has been spent versus what was approved, helping CFOs keep a tight lid on long-term investments.
For example, we built a Power BI CapEx dashboard for a chemical manufacturing company to compare actual versus budgeted spend across production plants, warehouses, and corporate offices. This manufacturing analytics dashboard breaks down expenditure into categories like maintenance, capacity expansion, and cost-saving initiatives. Users can then drill down into each category to analyse individual projects and see exactly where overspending or underspending is happening.
This level of visibility lets leadership act quickly when budgets get exceeded. If one project goes over budget, decision-makers can decide whether to pause other investments, reallocate funds, or adjust priorities. Instead of staring at static reports, finance teams get a structured, real-time view of spending that supports ongoing cost control and better capital allocation decisions
FP&A relies on having one reliable source of truth that combines financial data, operational inputs, and planning assumptions. Without this integration, analysts end up spending a chunk of their time reconciling numbers across systems instead of analysing performance. Power BI solves this by hooking directly into the core systems finance teams rely on – including ERPs (such as SAP, NetSuite), CRMs (such as Salesforce), HR systems (like Workday), and data warehouses (like Snowflake or Microsoft Fabric).
These connections are managed through built-in connectors and automated data pipelines. Power BI pulls the data from each source, transforms it into a consistent structure, and stores it in a centralised data model. This model combines actuals, budgets, and forecasts all in one place, so that all reports and dashboards are based on the same definitions and calculations.
Data refresh can be scheduled based on business needs. For example, dashboards may refresh daily during normal operations and shift to hourly refreshes during month-end close or forecasting cycles. A common use case is combining revenue data from a CRM with cost data from an ERP to analyse profitability by customer, product, or region. This means leadership always has the most up-to-date numbers without manual data preparation, creating a solid foundation for accurate forecasting and decision-making.
Power BI’s data modelling layer, combined with DAX (Data Analysis Expressions), lets FP&A teams build financial models similar to those used in advanced planning tools. Instead of relying on cell-by-cell Excel formulas, analysts define relationships between datasets and create reusable measures that calculate KPIs dynamically. This shift allows for more scalable and consistent analysis across the organisation.
Financial models in Power BI are usually structured as a star schema. Fact tables store core financial data such as actuals from the general ledger, budget versions, and rolling forecasts. These are linked to dimension tables that provide context, including chart of accounts hierarchies, cost centres, departments, products, customers, and fiscal calendars. This structure lets users slice financial performance across any business dimension without having to rebuild calculations.
On top of this model, FP&A teams create measures using DAX to calculate key metrics that give them a clear view of the business. This includes Year-to-Date revenue using built-in time intelligence, operating margin percentages, budget vs actual variances, rolling 12-month EBITDA, and contribution margin by product line. Since these measures are only created once and can be used across all reports, they keep financial logic consistent, while still allowing for super flexible and real-time analysis.
Power BI has several excellent features that really make a difference when it comes to financial planning and analysis. It allows finance teams to test assumptions, compare performance over time, and work with massive datasets in a way that’s super efficient. These features are all designed to help finance teams get the jump from static reporting to interactive, decision-driven analysis – which is what it’s all about.
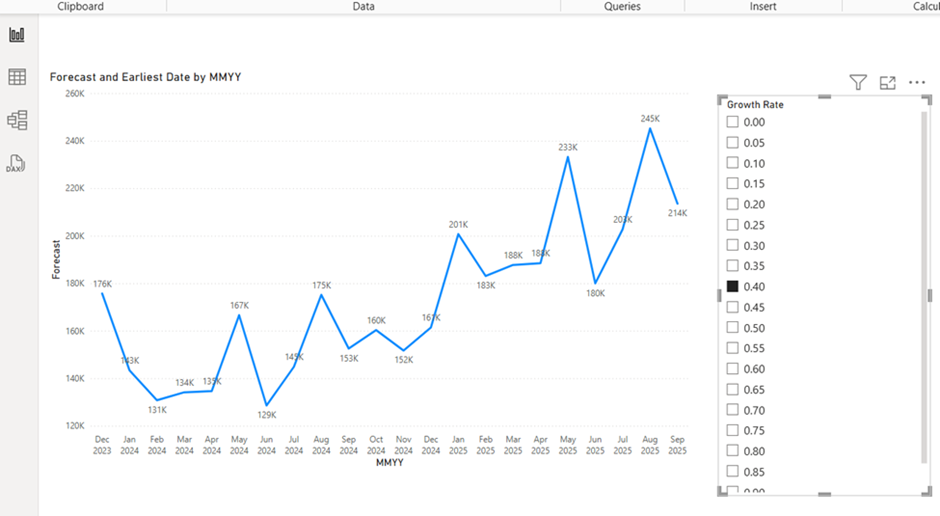
What if parameters are a game-changer for FP&A teams. They allow analysts to test different business scenarios without having to rebuild models from scratch. Just let them create simple input controls – such as a percentage change in pricing, hiring plans, or cost reductions – and Power BI will automatically recalculate the impact on revenue, profit, or cash flow. So when leadership asks questions like “What happens if we delay hiring?” or “What if prices increase by 5%?”, the answer can be generated instantly by tweaking a slider or input field.
Time intelligence functions make it super easy to compare performance across different periods without having to do all the complex manual calculations. For example, Power BI can automatically calculate year-to-date revenue, compare this quarter to the same quarter last year, or track month-over-month growth. Instead of rebuilding reports for each comparison, finance teams can just define these calculations once and apply them across all dashboards, which saves oodles of time and ensures consistency.
Performance optimisation features make sure that your dashboards remain fast and responsive even when working with huge datasets. Power BI uses techniques such as data compression, efficient relationships between tables, and incremental data refresh (only updating new data instead of reloading everything). This is super important for FP&A teams who are dealing with millions of transactions, as it lets them interact with reports in real time without delays, even during intensive planning or close cycles.
FP&A is inherently collaborative, involving finance teams, budget owners, and executives who all need to be working off the same numbers with clear controls. Power BI replaces all those fragmented Excel workflows with a centrally managed environment where dashboards are published, shared, and accessed through secure workspaces. They can distribute tailored views using Power BI Apps, so each stakeholder only sees the information that is relevant to them, while working from a single, consistent dataset.
Data access is controlled through features like row-level security, which restricts visibility based on user roles. For example, marketing teams see only their department’s P&L, while executives see company-wide performance. Budget versions are also managed centrally, with clear naming (e.g. Budget v1, v2, Final) and timestamps, so everyone is working with the right version and there’s no confusion caused by email-based file sharing.
Power BI can also be integrated with Power Automate to support approval workflows and planning cycles. This lets finance teams send automated notifications when new budgets are ready, assign tasks for variance explanations, and route submissions for approval. In addition, comments and annotations can be captured directly alongside the data, so explanations for variances are stored in the reporting environment rather than scattered across emails.
All of this is backed up by a full audit trail, where changes, timestamps, and user actions are recorded in the underlying data model. This keeps things transparent, supports compliance requirements, and lets finance leaders track how financial plans evolved over time.
As a result, organisations can scale Power BI to hundreds of users while maintaining strict control over financial reporting and decision-making.
Power BI is traditionally a read-only tool for analysing and visualising data, but FP&A processes require input – budgets, forecasts, and planning assumptions need to be entered, adjusted, and reviewed collaboratively. This gap can be bridged by extending Power BI with write-back capabilities, allowing users to input data directly into the reporting environment and see the impact instantly.
In practice, we implement this by embedding a Power App directly into a Power BI dashboard. So users can enter budget values, adjust forecasts, or update assumptions through a simple input interface, and the data is written back to a database. As soon as the data is submitted, the Power BI report refreshes and reflects the updated numbers in real time. This supports both absolute inputs (e.g. entering a budget value) and relative changes (e.g. increasing costs by 5%), enabling flexible planning workflows.
This approach enables core FP&A processes such as top-down target setting, bottom-up departmental budgeting, and driver-based forecasting. Teams can also create multiple scenarios – such as Base, Upside, and Downside – and switch between them using filters to instantly see the impact on P&L, cash flow, and other financial statements. During budget cycles, multiple users can input data simultaneously, while the central data model keeps everything consistent and under control.
We usually don’t recommend splashing out on paid write-back plugins, because at the end of the day, they often cost a small fortune – tens of thousands of dollars per year – without delivering the value you’d expect. We’ve found that a Power BI + Power Apps architecture can do the same job in a much more flexible and cost-effective way. This setup effectively turns Power BI from just a reporting tool into a fully-fledged FP&A platform – where planning, analysis, and decision-making all happen in one neat place.
When we’re putting Power BI to work in FP&A, we don’t start by trying to automate every single finance process in one go. That would be way too ambitious. What our financial analytics consultants do instead is begin with the reporting and planning areas that are causing the most headaches for your finance team – and then gradually build out from there. This approach helps us deliver value quickly, validate the numbers early on, and build trust before adding more advanced budgeting and forecasting workflows.
The first step we take is to understand how your FP&A process works at the moment. We go through your existing reports, budgeting files, planning models, and approval processes to see how actuals, budgets, and forecasts are currently being managed. At this point, we also map out your key data sources – such as your ERP, CRM, payroll, and planning files – and identify any common problems like manual reconciliations, inconsistent KPI definitions, or painfully slow month-end reporting.
Next, we work on designing the Power BI data model that will underpin your FP&A reporting. That means structuring actuals, budgets, and forecasts into one model, mapping the chart of accounts, setting up department and cost centre hierarchies, and getting agreement on the exact logic for KPIs like gross margin, EBITDA, or budget variance. Once that foundation is in place, we build an initial pilot dashboard – usually focused on a core use case like executive P&L reporting, cash flow, or actuals vs budget analysis.
After we’ve validated the pilot against your current finance reports, we start to build the solution out into broader FP&A workflows. This can include forecast input, scenario modelling, budget version control, and write-back functionality using Power Apps embedded inside Power BI. We also set up the security rules so that each stakeholder only sees the data that’s relevant to them, and automate the refresh schedules so that reports stay up to date without needing any manual input.
And then there’s the final step: rollout and optimisation. We train up your finance teams, budget owners, and leadership on how to use the dashboards, document KPI logic and report definitions, and gather feedback after we go live. From there, we keep on improving the solution by adding new planning modules – like OPEX, CAPEX, headcount planning, or forecast accuracy tracking. Our phased delivery model usually takes anywhere from 8 to 16 weeks for the initial rollout, depending on how complex the systems and planning processes are.
When we implement Power BI for FP&A, we always work out how we’ll measure success upfront. That way, CFOs can get a clear idea of the return on investment and work out where further improvements can be made. The most common metrics we track include report preparation time, speed of month-end close, forecast accuracy, and how quickly finance teams can respond to ad-hoc business questions.
In practice, the impact is often pretty immediate. For example, we’ve seen organisations go from taking several days to prepare board reports down to just one day, by automating data integration and ditching manual formatting. We also track how analyst time changes over time – moving from 60-70% spent on data gathering to the majority of time focused on analysis, forecasting, and business support.
But it’s not just about the numbers – the qualitative impact is just as important. Finance teams report that they get better alignment with operations because everyone’s working from the same data, more confidence in decision-making because of real-time visibility, and far less friction from version control or reconciliation issues. These improvements create a stronger foundation for expanding Power BI into more FP&A areas – like workforce planning, capital allocation, and operational performance analysis.
The real value of Power BI for FP&A comes from combining data integration, scalable modelling, and planning workflows into one system that supports both analysis and decision-making. From cash flow forecasting to budget tracking and scenario planning, Power BI enables FP&A teams to work with confidence and clarity. If you’re looking to implement or improve Power BI for FP&A, we can help you design and build a solution tailored to your finance processes, data sources, and planning needs. Contact us to discuss your requirements and see how we can support your FP&A transformation.
The following questions address common practical concerns that finance leaders and analysts raise when considering or deploying Power BI for FP&A.
Excel remains valuable for ad-hoc analysis and quick calculations, but Power BI FP&A centralizes financial data and business logic in a single governed model with role-based security and automated refreshes. Unlike Excel workbooks emailed between stakeholders, Power BI ensures one version of the truth accessible to hundreds of users simultaneously.
Complex time intelligence and multi-scenario comparisons are significantly easier to maintain in a Power BI data model than across multiple spreadsheet templates. When assumptions change, measures update automatically across all reports rather than requiring manual updates to dozens of linked files. For better decision making at scale, the unified approach outperforms fragmented spreadsheets.
Even small FP&A teams benefit from Power BI, especially those with recurring monthly financial reporting and annual budget cycles currently handled through manual spreadsheet processes. The investment in setup pays off through reduced repetitive work and faster response to leadership questions.
Smaller teams should start with a focused use case—such as a standardized P&L and cash flow dashboard covering the last 24 months—before extending into full budgeting and forecasting capabilities. Power BI’s cost model and cloud deployment make it accessible without large upfront infrastructure investments, and the Microsoft ecosystem integration means many organizations already have licensing in place.
Many organizations refresh core FP&A models at least daily, with more frequent (hourly or near real-time) refreshes during critical windows like month-end close or year-end planning cycles. This balances performance, licensing costs, and decision-making timeliness.
The optimal cadence depends on source system load capacity, Power BI licensing limits, and how quickly informed decisions need to react to new information. Scheduled refreshes and incremental refresh policies help manage large datasets efficiently while ensuring reports reflect current operational data.
Power BI is built on the Microsoft cloud security stack, supporting encryption at rest and in transit, granular access controls, and compliance with major regulatory standards when configured correctly. Organizations handling sensitive financial data regularly deploy Power BI for compensation planning, executive forecasts, and confidential strategic scenarios.
Row-level security restricts access so HR cost details or executive compensation are visible only to authorized users. FP&A implementations should follow governance best practices: least-privilege access, audited workspaces, clear ownership of datasets and models, and regular access reviews.
Key skills include understanding of financial statements and FP&A processes, familiarity with data modeling concepts (star schemas, relationships), and working knowledge of Power BI Desktop and basic DAX measures. Finance professionals do not need to become full-time developers to be effective.
Analysts should be comfortable building visuals, creating measures for common calculations, and developing simple models—or working closely with data specialists who handle technical complexity. Ongoing training and internal knowledge sharing help FP&A teams gradually take ownership of more capabilities, using Power BI as a powerful tool for their daily work rather than depending entirely on IT support.
![]()
![]()
![]()