Franchise analytics is the process of collecting, consolidating, and analysing data from multiple franchise locations to understand performance across the entire network. Loads of businesses make custom franchise reporting systems – that’s the collection of tools and dashboards that make sense of all that analysis. Usually, that’s pulling data from systems like POS, accounting, CRM and marketing together into one tidy view. Without it, franchisors struggle to compare locations, spot trends, and make decisions based on facts.
At Vidi Corp, our data visualization consultants worked with loads of franchise businesses in retail, healthcare and services to design and deliver custom analytics solutions. We’ve built dashboards that bring together data from POS systems, accounting tools, marketing platforms and HR systems into one reliable reporting layer.
In this article, we’ll talk through how franchise analysis works, the problems it sorts out, the key bits of a modern analytics stack and some real-life examples of the dashboards we’ve built for our franchise clients.
Franchise data is usually spread all over the place – lots of different systems and accounts, which makes it hard to get an overall view of performance. We worked with a retail franchise where each store had its own QuickBooks Online account, which meant management couldn’t see the financials across the brand in one go.
This fragmentation makes it hard to make decisions – leadership can’t easily compare revenue, costs or profitability between locations, which makes it harder to spot top performers or under-performing stores. It also makes reporting a nightmare – teams have to manually knock data together before they can even start analysing it.
Franchise analysis solves that by bringing data all together into one reporting layer. This gives a unified view of performance across all locations in a single business intelligence dashboard. As a result, teams save loads of time on manual reporting and can quickly spot trends, benchmark locations and make faster, fact-based decisions at the brand level.
Without proper analytics, it’s really hard to spot operational issues across loads of locations. Issues like high food costs, uneven inventory use, and overstaffing – these sorts of things get hidden within individual store data.
These issues hit profitability. Small cost overruns at each location can add up fast to make big losses across the franchise network. And if you don’t spot them quickly, it’s harder to sort them out and get back in control
Franchise analysis highlights trends across locations, making it easier to spot anomalies. For example, it can flag stores with very high labour costs or declining margins. This lets you act fast and get control back. Result: less waste, better margins and more efficient day-to-day management.
Franchises often struggle to compare store performance between locations because each one operates in different conditions. Some locations are in big cities, others are in smaller markets, and newer locations will naturally do better or worse than established ones. Without context, raw comparisons just don’t work.
This makes performance management less effective – leaders might draw the wrong conclusions about which locations are under-performing, or fail to spot great performance in tough markets. It also makes it hard to set fair targets or replicate success across the network.
Franchise analysis introduces like-for-like comparisons by grouping locations in a way that makes sense – by geography, maturity or size. This lets leadership evaluate performance in context and make more informed decisions. Result: better benchmarking, targeted support for franchisees and more confident strategic planning.
Marketing performance is often tricky to track in a franchise model. Campaigns run right across multiple locations, but results don’t get measured or attributed consistently, so it’s unclear which efforts are driving revenue.
In our experience in marketing analytics consulting, this creates a disconnect between marketing spend and business outcomes. Franchisees might keep shelling out for under-performing campaigns while successful channels get overlooked. And it limits the ability to scale successful strategies across the network.
Franchise analytics brings marketing data together with sales performance at the location level. This makes it possible to see which campaigns bring the biggest return and work best where. Result: better budget allocation, improved campaign performance and more predictable revenue growth across the franchise.
Data sources are the foundation of any franchise analytics stack. These are things like POS systems, online ordering platforms, payroll tools, CRM systems and accounting platforms like QuickBooks Online or Xero. Each system captures a bit of the business – sales, staffing, customer interactions or financial performance.
These systems are designed to store data in a neat, structured way, which makes them reliable for everyday use but not ideal for looking at data across loads of locations. Data is usually separated by location or function, which limits visibility at the brand level.
The usual suspects vary by function – POS systems like Shopify POS or Square handle transactions, CRM platforms like Salesforce manage customer data, and accounting tools like QuickBooks Online or Xero track financials. When you put them all together, you get the raw data layer of the analytics stack.
To make sense of all your franchise data, a Business Intelligence data warehouse brings everything together in one place. You don’t have to be querying individual systems one by one; data gets pulled from all of them, transformed, and loaded into a central database that’s perfect for crunching numbers. This centralised approach ensures a consistent data model right across all your locations and systems.
Based on our experience in data warehouse consulting, the go-to tools for this sort of thing are things like Azure SQL, Google BigQuery, and other cloud-based solutions that can handle massive amounts of data, run reports in a flash, and scale up or down as your franchise grows.
To get data into your warehouse, you typically need to write some Python scripts or use pre-made connectors. At Vidi Corp, we have our own ready-made data connectors to automate the process and get data from platforms like Shopify (online and POS), QuickBooks Online, and Xero updated and structured in a way that makes sense for our reporting.
Business Intelligence tools then sit on top of your data warehouse and help you make sense of it all. They let you explore performance, track key performance indicators (KPIs), and create dashboards that inform all your business decisions – operational and strategic.
Based on our experience in business intelligence consulting, the most popular tools in this space are Power BI, Tableau, and Looker Studio – all three offer top-notch data visualisation and can hook into modern data warehouses like a pro. Power BI is a natural fit if you’re already in the Microsoft ecosystem, Tableau stands out for its flexible visualisation options, and Looker Studio is great for lightweight, shareable reporting.
In short, these tools connect directly to your data warehouse, so you can rest assured that all your reporting is based on a single, unified source of truth.
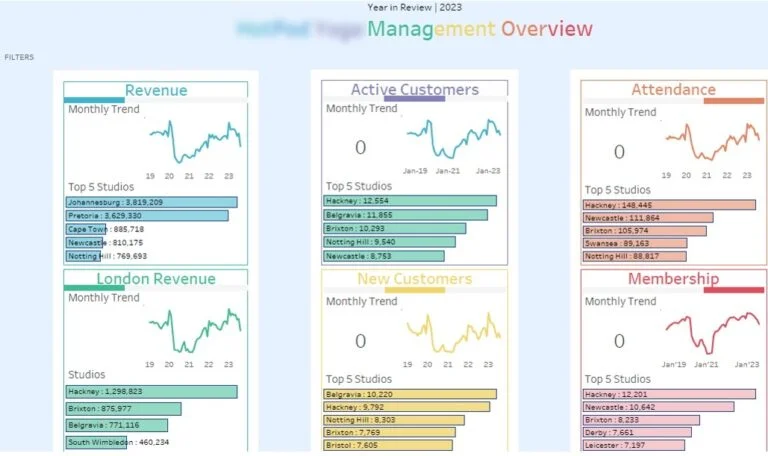
A sales dashboard for a franchise lets you see how things are going across all your locations, while also drilling down into individual locations for more detailed comparisons. Commercial and operations teams love this sort of tool for tracking revenue, customer behaviour, and location activity. Typical metrics you’d find on a dashboard like this are monthly revenue per customer, number of classes or transactions, new vs recurring customers, retention rate, and reactivated customers – and it lets you segment by factors like location size, market type, and age to get like-for-like comparisons.
In a recent project, our Tableau consultants built a custom sales dashboard for a yoga franchise with over 100 locations. The standard reporting tools just weren’t cutting it for the level of analysis this franchise needed, so we created a tailor-made solution that brought all that data together from across all locations. The dashboard let users see the whole franchise, or drill right down into a single location, all while grouping locations by city size and years in operation – that way, they could get some real context around their performance rather than just comparing raw numbers.
The sales dashboard is a go-to tool for the commercial director who’s responsible for managing all the franchisees. It supports key business processes like identifying underperforming locations, prioritising franchisee support, and coming up with strategies to boost retention. For example, the director might use retention and customer behaviour metrics to figure out which locations need some extra training to get their service up to scratch. And with data on how performance varies across locations, the director can have much more informed and data-driven discussions around pricing and franchise management.
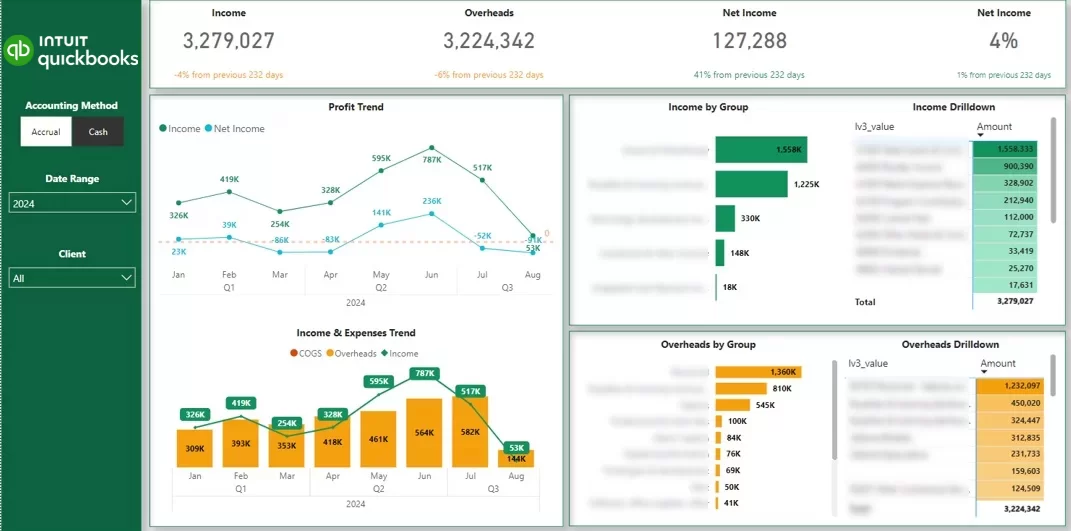
A franchise financial reporting dashboard is used to squeeze all that financial data together from multiple locations and make sense of it. Finance teams and business owners alike love it for tracking revenue, costs, and profitability at both the individual location and brand level. You’d expect to see metrics like revenue, cost of goods sold, overheads, and net profit, all with the ability to filter by location and time period for some real detail.
In one project, our Power BI consultants worked with a jewellery franchise that had five locations, each store was running its own QuickBooks Online account. This made it a nightmare to get a complete financial view of the business. We implemented our QuickBooks Online connector to automatically grab all that data and consolidate it into a single Power BI dashboard. That gave us a unified financial model that standardised reporting right across all locations.
The financial reporting dashboard is used by the business owner and the finance team to keep an eye on performance and manage their financial processes. It supports monthly reporting, location-level profitability analysis, and spotting trends in costs across stores. With all that financial data right in one place, the team can review performance across locations at management meetings and quickly identify which stores need a little extra attention or operational tweaking.
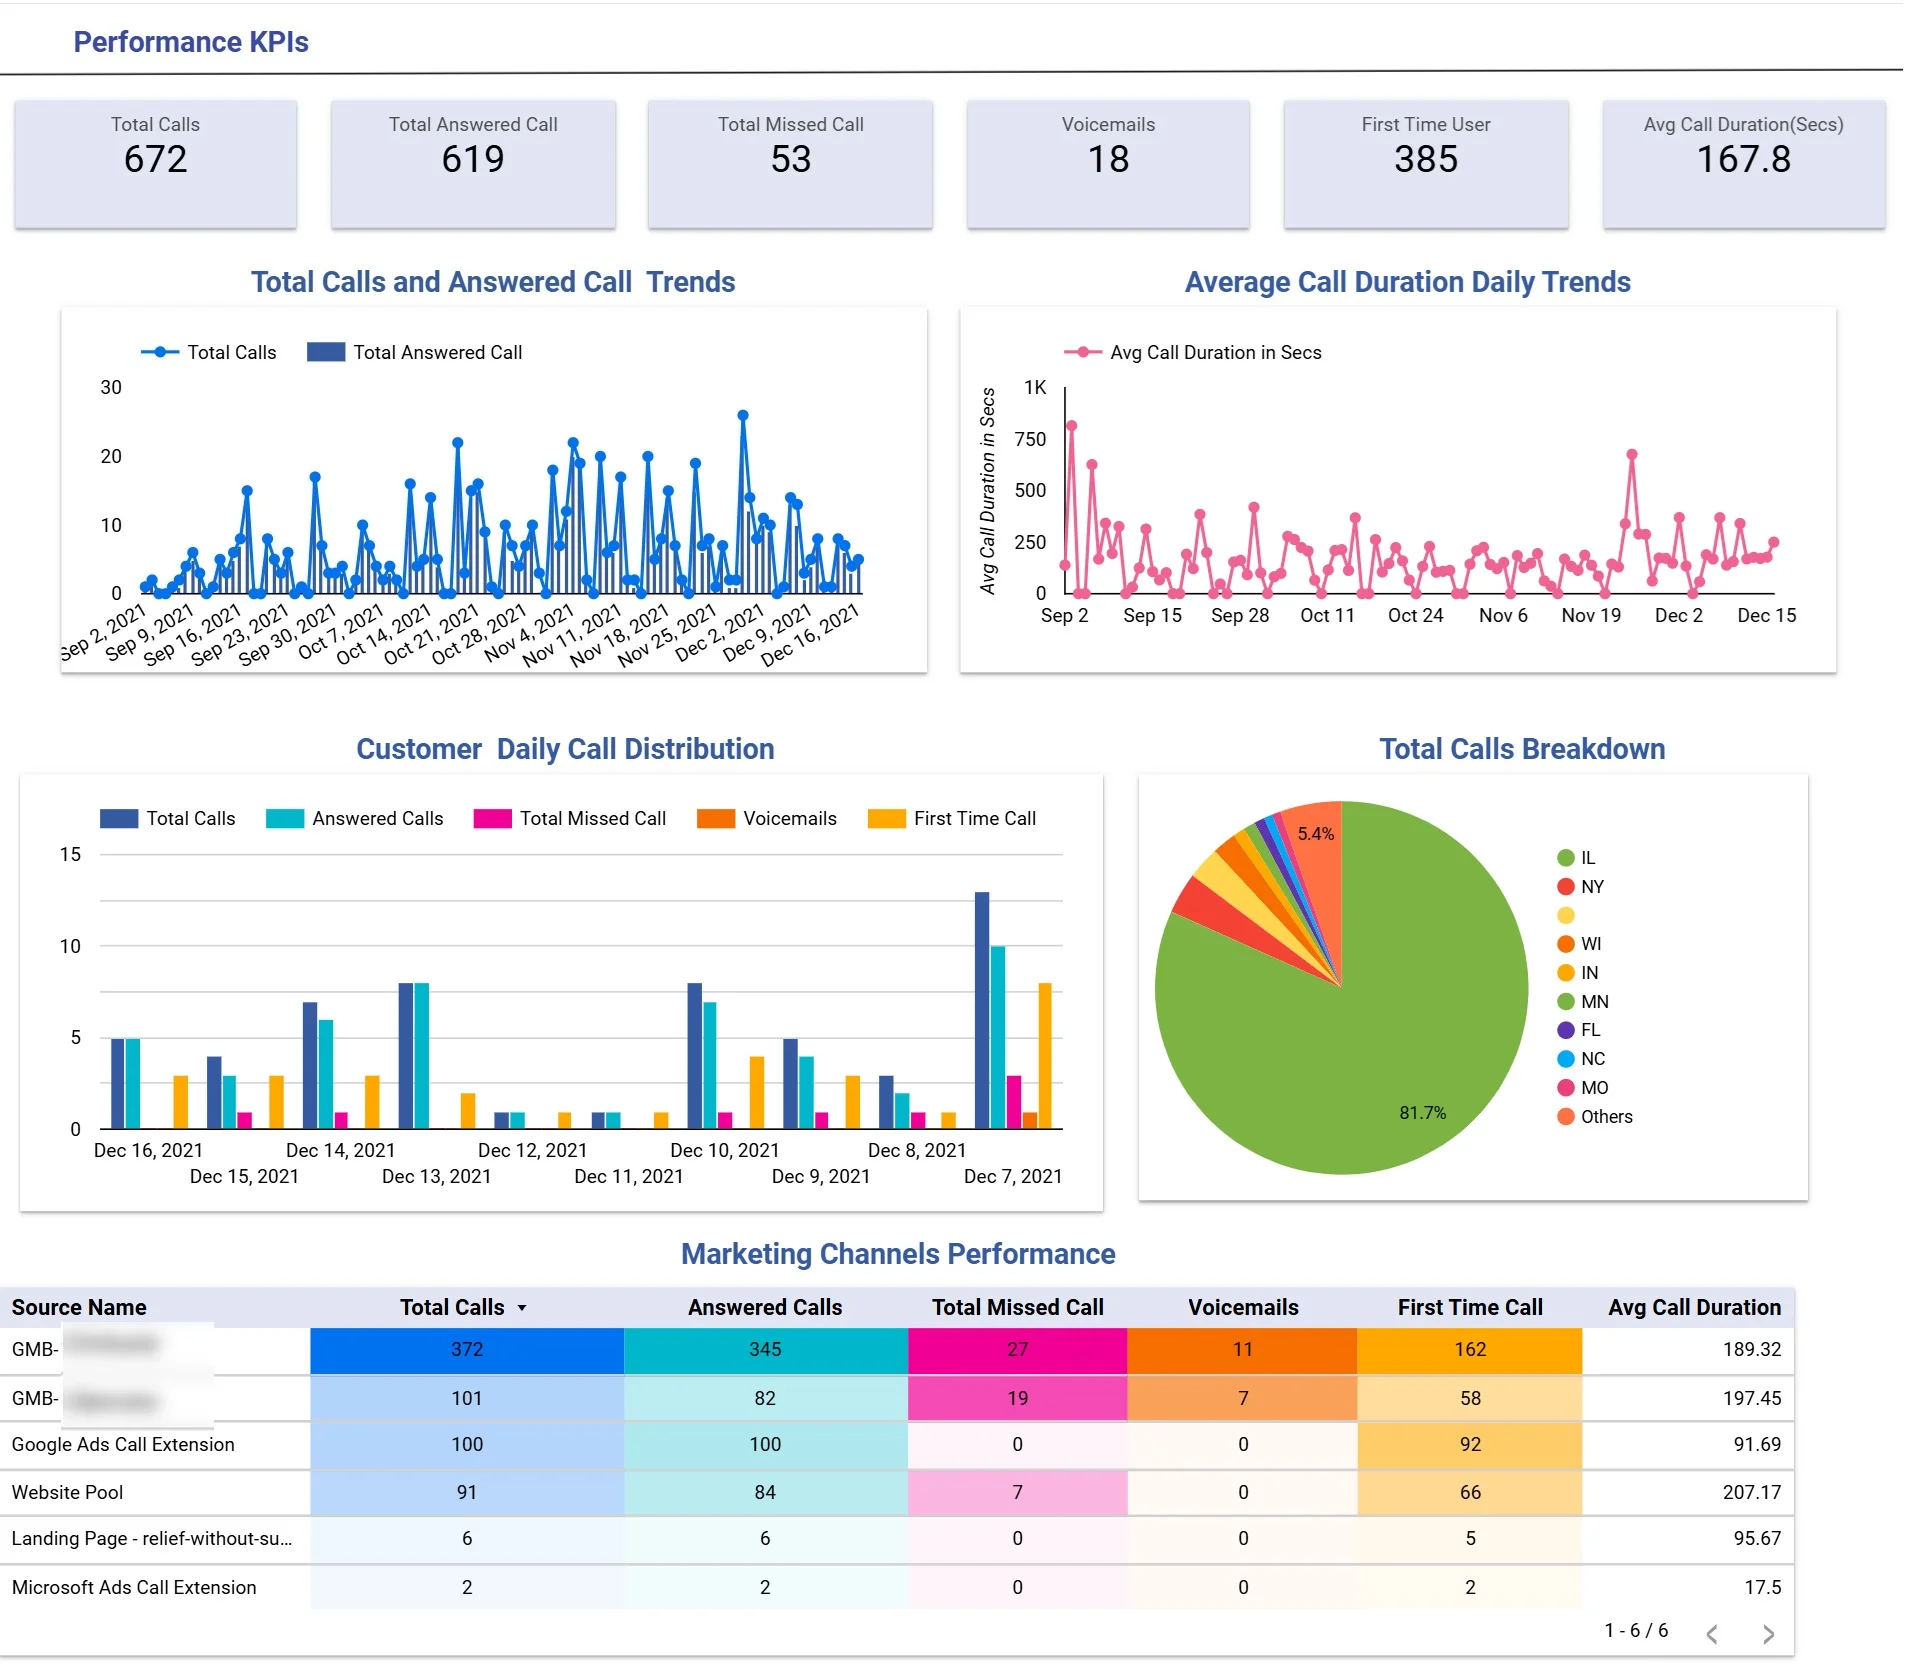
A marketing dashboard for many franchise businesses is all about tracking inbound enquiries and measuring campaign effectiveness across locations. Marketing teams in industries like healthcare, dental clinics, home services, and legal firms love this sort of tool, as phone calls are the main conversion point for them. The dashboard digs into daily call trends, call status breakdowns (answered, missed, voicemail, first-time callers), geographic distribution, and channel-level performance to evaluate both volume and lead quality.
In a project our Looker Studio consultants did for a healthcare franchise, we built a custom dashboard for a group of dental clinics that focused on patient acquisition in their local area. We used CallRail data to capture inbound call activity across locations, and the dashboard then visualises daily trends for total and answered calls, alongside average call duration. It also breaks calls down by status to highlight missed opportunities and new enquiries, plus geographically analyses calls by state, and does a detailed comparison of marketing channels based on call volume and engagement quality.
The dashboard is used by marketing managers and clinic operators to get a grip on lead generation processes. Marketing teams use the channel comparison to figure out where to allocate their budget so they get the best value from sources that give them the most quality leads – and that’s measured by how long the calls are and how often people answer. At the same time, operations teams are monitoring how many calls are being missed to make sure they can handle them & turn those enquiries into appointments. This basically gets marketing and operations teams working together in a more structured way, making sure they’re both doing a better job of things across the whole franchise.
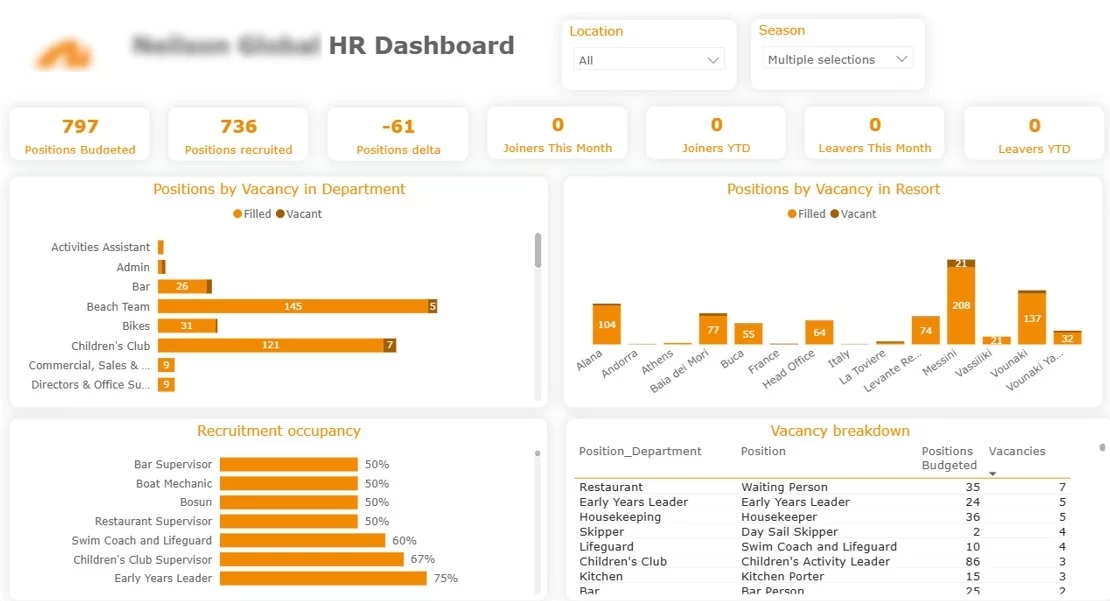
For a franchise HR recruitment dashboard, we use data from a CRM or recruitment system to track hiring progress across loads of different locations & make the candidate sourcing process better. The dashboard looks at things like how many open roles there are vs how many are filled, applications, interviews, job offers and cost per hire – with breakdowns by job type, location & recruitment channel.
When you look at this project, our dashboard consultants built a custom Power BI recruitment dashboard for a resort franchise in Greece that has to hire loads of seasonal workers each year. The dashboard gives a clear picture of which job roles are filled and which ones are still open, so the recruiters can focus on the most important ones. It also highlights which of the resort locations are really struggling to fill their staff gaps. Plus, we included a detailed breakdown of applications, costs & job offers by recruitment source – and some calculated metrics like how much it costs to get an application, how much to get an interview & how much to get a new hire.
The dashboard is used by HR teams and operations managers to get recruitment and workforce planning in sync. Recruiters use it to make sure they’re prioritising the right jobs, to track pipeline progress and to work out which recruitment channels are giving them the best value. At the same time, operations teams are using it to keep tabs on how many staff they need across the different locations to make sure they’ve got enough people coming up to the peak seasons. This makes the whole hiring process a lot more structured & makes sure recruitment and operational planning are both a lot more effective.
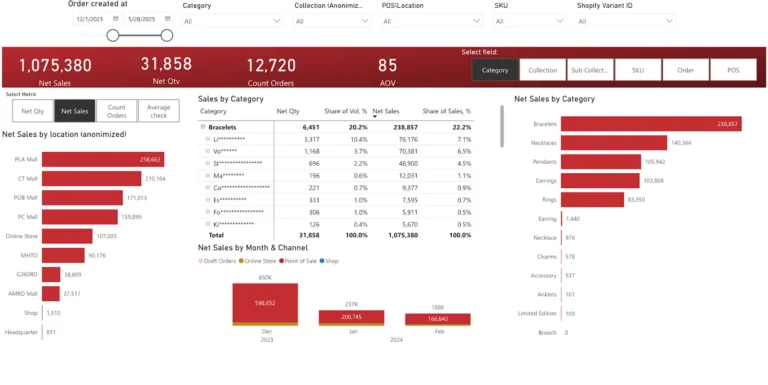
A franchise operations dashboard is used to keep an eye on the day-to-day retail performance across loads of different locations. It’s used by store managers, operations teams and leadership to track sales activity, product performance and demand patterns. The dashboard has metrics like revenue, average order value, and order volume – with breakdowns by store, product type, collection & sub-collection to help with really detailed operational analysis.
In this project, our retail analytics consultants built a custom Power BI dashboard for a jewellery franchise that runs loads of high street stores. We extracted the data from Shopify POS using a custom connector we developed ourselves. The dashboard was designed to be super flexible so users can switch between different key metrics and apply filters really easily. It lets users do both high-level analysis across loads of different stores, and detailed views at the individual store level – including product and collection performance.
The retail analytics dashboard is used by store managers and senior leadership to help make operational decisions. Store managers use it to see which products and categories are driving revenue in their store and adjust their merchandising accordingly. At the same time, central teams are looking at performance across the whole retail network to spot demand patterns, compare new collections to core products, and make informed decisions on inventory allocation and product strategy.
Implementing data analytics for franchise businesses isn’t just about getting some new technology up and running. While tools like data warehouses and dashboards are important, what really matters is the quality of your data, how well you’re aligned with your franchisees and whether you’ve got the internal skills to use the insights you get. If you don’t get those things right, even a great dashboard is going to be underused or misinterpreted.
A practical approach is to start small and build it up gradually. Begin with a focused set of core metrics such as sales, labour % & cost of goods sold – and some customer satisfaction metrics like NPS. Pilot the analytics solution with a small group of locations to make sure the data is right, refine the reporting logic & make sure it’s actually supporting real decisions. Once you’ve proved the model works, you can roll it out across the whole franchise network with confidence.
Getting your data sorted is critical at every stage. Your metrics have to be defined consistently across all your systems – so you can make meaningful comparisons between different locations. This means aligning your chart of accounts, product categories & operational definitions – otherwise benchmarking becomes a waste of time & you can end up with the wrong conclusions.
Getting buy-in from your franchisees is just as important as getting the technical setup right. You should introduce analytics with clear scorecards, some examples of how it can actually improve performance, & some training on how to use the dashboards. The goal is to make it clear that analytics is there to help with growth – not just to pick on you. That encourages adoption & makes sure the franchisees are actually using the data.
Finally, you need to get your data governance and security sorted. Role-based access controls make sure users only see the data that’s relevant to them, while data privacy standards protect sensitive information. You also need to establish clear rules on how performance data is used – whether it’s for operational reviews, support initiatives or incentive structures – so everyone’s on the same page.
FranConnect is a business intelligence platform with a difference – its specifically designed for franchise networks. It’s not just about reporting either – it’s also packed with operational tools to help you manage franchise development, compliance and performance. You get dashboards, plus features for onboarding new locations, managing royalty payments and delivering e-learning content to your franchisees and staff.
One of the big plus points of FranConnect is that it comes with out-of-the-box functionality. That means you get ready-made dashboards tailored to your franchise business, covering areas like sales, ops, finance, audits and quality control. This really helps if you want a system up and running quickly, without the hassle of building custom analytics from scratch. The platform is also designed around common franchise processes, which means you’ll need to do less configuration.
But there are downsides to consider – the cost is substantial, and can range from $1,000 to $2,000 per month – that’s a fair bit more than building a custom dashboard of your own for $5,000 to $10,000. Also, integration options are a bit limited – while it does play nicely with QuickBooks Online for example, if you’re using Xero, then you’re out of luck and will need to use workarounds like uploading files to Google Drive. Also, you’re pretty limited in how much you can customise the dashboards, which can be a problem if you want to create an analysis that really works for your business.
Power BI is a pretty popular business intelligence tool from Microsoft that’s well-suited to creating custom analytics dashboards. It plays nicely with a huge range of different data sources, including POS systems, CRMs, accounting platforms and data warehouses – which makes it great for businesses that use lots of different systems. It’s not just about using pre-built templates either – it’s all about building reporting solutions that are tailored to your specific business needs.
One of the big pluses of Power BI is that it’s really flexible – you can design dashboards that really reflect your franchise business model, and it connects up to loads of different systems – including Shopify, QuickBooks and a whole bunch of others. As for cost, Power BI is pretty low – we’re talking around $14 per user per month, which is a fair bit cheaper than lots of other dedicated franchise platforms.
The downside to Power BI is that there aren’t many pre-built templates specifically designed for franchise operations. That means you need to put in a bit more time and effort to develop your own data models, metrics and analysis. So it’s not the best choice if you want a system that just plugs in and works out of the box – but if you’re willing to put in the work, Power BI is a great choice.
Building a franchise analytics system is about more than just building a bunch of dashboards. It’s about creating a system that brings together data from all over your network and turns it into useful, actionable insights. When done right, it helps you make better decisions across the whole business – operations, finance, marketing and HR.
The key is to choose the right approach for your business. Some franchises do really well with pre-built systems, while others need something custom-built to reflect just how they work. And the best setups are the ones that combine the right tech with clear processes, standardised data, and a solid adoption rate among your franchisees.
If you’re looking to build or improve your franchise analytics, we’d love to help. Get in touch, and we can have a chat about what you’re doing now and explore how a custom solution can help you grow.
![]()
![]()
![]()