Running a small business means making decisions quickly, often with limited time and fragmented data. When key numbers live across spreadsheets, accounting tools, CRMs, and marketing platforms, it’s easy to miss issues that directly impact cash flow and growth. Small business dashboards solve this by turning scattered data into a single, real-time view of performance. The best dashboards for small business management are effective, customizable, and collaborative, helping teams make better decisions and share data easily.
Small business dashboards should feature real-time KPIs, intuitive visualizations, and actionable insights to facilitate decision-making.
At Vidi Corp, we’ve delivered dashboard development services for 1,000+ small and mid-sized businesses across business areas like finance, sales, marketing, and operations. Our team has worked with companies ranging from early-stage businesses to organisations with thousands of employees, helping them replace manual reporting with automated dashboards that save hours every week. Choosing the right small business dashboard can provide a competitive edge by delivering real-time insights and streamlining decision-making.
In this guide, we’ll explain what small business dashboard is, why it matters, how much it costs, and which metrics you should track. We’ll also share real-world dashboard examples, including dashboard templates that offer time-saving drag-and-drop features, along with the best software tools to build them. Using a small business dashboard today is crucial to gain immediate insights and stay ahead of competitors.
Customization and collaboration features are important for small business dashboards to ensure data is actionable and accessible to team members.
Small business dashboards are visual reporting tools that bring your most important data into one clear view. They replace scattered spreadsheets and manual reports with real-time charts that show how your business is actually performing.
Instead of digging through multiple tools, a dashboard pulls data from sales, marketing, finance, and operations into a single place. This makes it easier to spot trends, catch problems early, and act before small issues become expensive ones.
For small businesses with limited time and tight margins, dashboards aren’t about “advanced analytics.” They’re about saving hours each week, staying in control of cash flow, and making faster, more confident decisions based on what’s happening right now.
Cost is usually the first concern for small businesses, and for good reason. Budgets are tight, so any analytics investment needs to be practical and clearly justified.
For most of our small business dashboard projects, costs are predictable and transparent. Our dashboards typically start from $1,000+ for development, with ongoing software licensing of $14–$75 per month, depending on the platform and user access requirements.
The total cost is usually made up of two parts.
The first is software and infrastructure. This includes the dashboard tool itself (such as Power BI or Tableau) and sometimes data connectors that pull data automatically from platforms like Facebook Ads, Hubspot and others. Many small businesses don’t need a data warehouse at the start, which helps keep costs low.
The second part is development and setup. This is often the larger cost, covering data modelling, coding formulas for the KPIs, and dashboard design. Investing in the right tools can actually reduce this cost, because faster development means fewer consulting hours and a quicker return on value.
The key is to start small. Focus on the metrics that matter most today, keep the setup simple, and scale the dashboard later as your business and data needs grow.
The most practical option for small businesses is often to start with a ready-made dashboard instead of building everything from scratch. Using an existing solution reduces the amount of work involved, which means faster delivery and lower overall costs. We offer dashboard templates specifically designed for small businesses, making it easy to customize, save time, and benefit from drag-and-drop features.
Our pre-built small business dashboards examples are shown below. These dashboards are already designed and tested, and can be quickly connected to your data sources. This approach keeps projects affordable while still delivering meaningful insights. When getting started, focus on 5-7 critical metrics rather than tracking 50, to avoid dashboard paralysis and ensure you act on what matters most.
A simple dashboard that people check daily is more effective than a comprehensive dashboard that nobody uses.
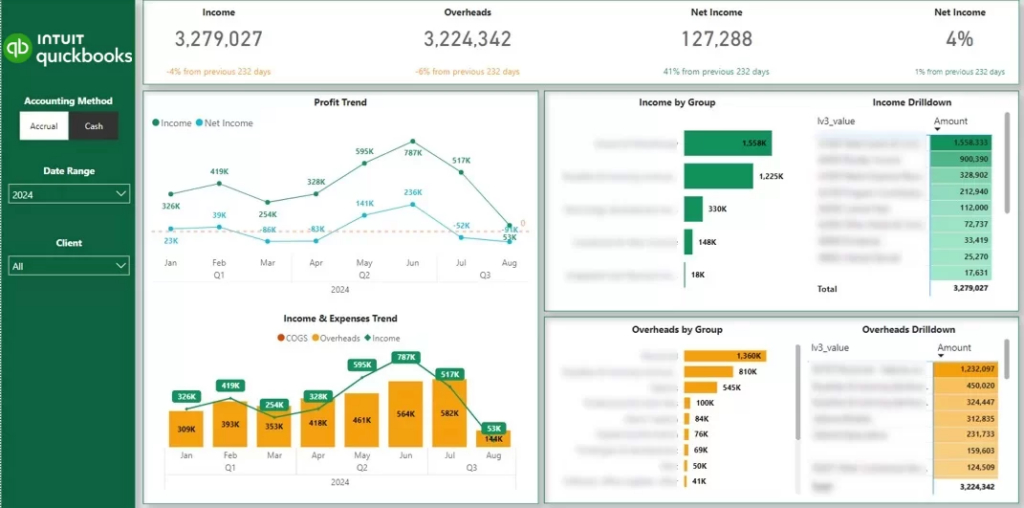
Data sources: QuickBooks Online, Xero, Zoho Books
Essential financial metrics to include: Income, overheads, and net income trends, cash vs accrual performance, profit margins by account or service, expense breakdown by category, outstanding and overdue balances
A financial dashboard gives small business owners a clear view of where money comes from, where it goes, and how sustainable the business is. It replaces static profit-and-loss reports with trends and drill-downs you can actually act on.
Our financial dashboard template shows monthly trends for Income, Overheads, and Net Income, giving business owners an instant view of financial performance over time. Income and overheads are broken down by account and individual transactions, making it easy to understand what drives each number.Users can switch between accrual and cash accounting, filter by client (for businesses managing multiple QuickBooks accounts), and analyse results by class.
For our clients, this dashboard replaced manual month-end reporting, improved cash flow visibility, and helped spot cost increases or margin issues before they impact the business.
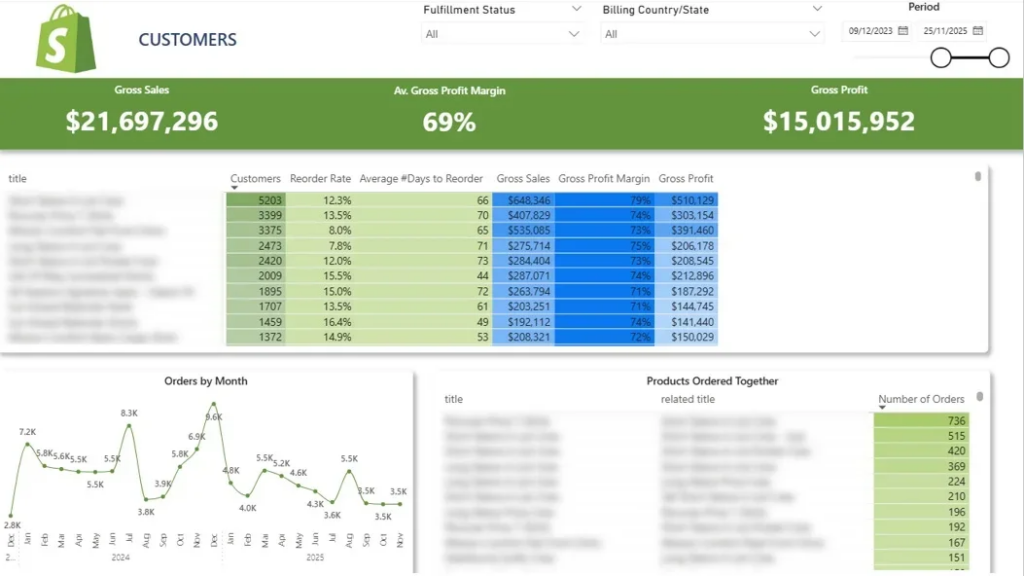
Data sources: Shopify, Magento
Essential ecommerce metrics to include: Customer LTV, Number of customers per product, reorder rate, average days between purchases, product-level revenue and profitability, monthly order volume by product, frequently purchased product pairs.
An ecommerce dashboard helps online retailers understand which products drive repeat revenue and where merchandising decisions can be improved. It goes beyond top-line sales to reveal buying patterns, reorder behaviour, and product relationships.
We built this Shopify ecommerce template for a merchant with a large product catalogue who struggled to decide which products to promote, bundle, or phase out. While revenue was stable, average order value and repeat purchases were below benchmarks.
The dashboard summarises product-level performance by showing how many customers purchased each item, how often they reordered, and the average time between purchases. Selecting a product dynamically filters monthly order trends, making it easy to spot growth patterns and seasonality.
The dashboard also highlights products frequently bought together, supporting smarter upsell, bundling, and merchandising decisions. Using these insights, our client automated upsell suggestions at checkout and launched reorder reminder email campaigns based on average repurchase timing. The result was higher revenue per customer and improved long-term retention.
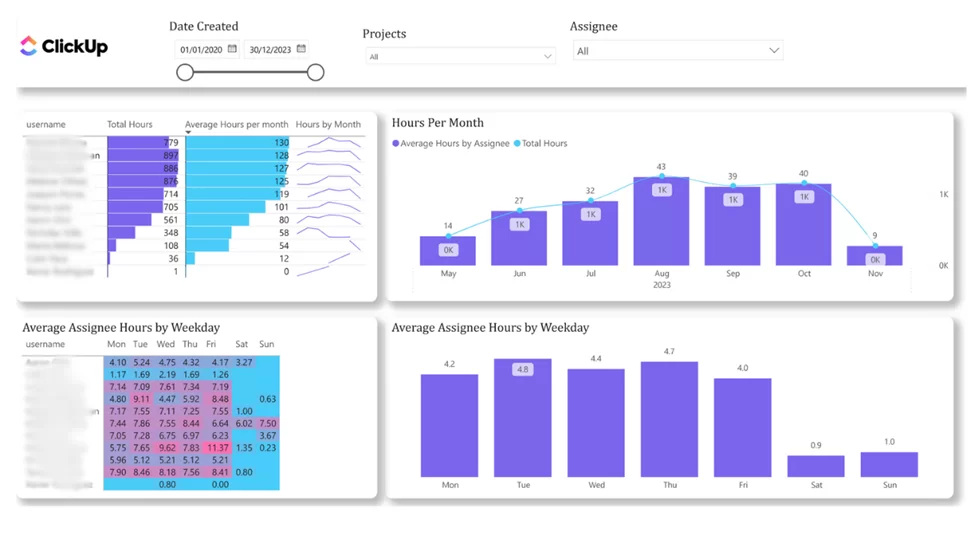
Data sources: ClickUp, Trello
Essential project management metrics to include: total hours worked by project and team member, average hours per day and per month, resource utilisation rates, workload distribution across projects, early signals of over- or under-utilisation
A project management dashboard helps service-based businesses stay profitable by showing how time and resources are actually being used. It connects project delivery directly to workload, capacity, and team performance.
Our team developed a free project management template that measures how effectively human resources are being used based on logged work hours. It shows total hours and average hours worked per assignee, with views by day and month, across all projects or a selected workspace.
By visualising workload trends over time, managers can quickly identify team members who are overworked or underutilised. For example, if someone’s hours drop after a busy period, it’s easy to investigate why and reassign work before capacity is wasted.
For our client, this dashboard improved workload balance, prevented burnout, and ensured projects are staffed efficiently without relying on guesswork.
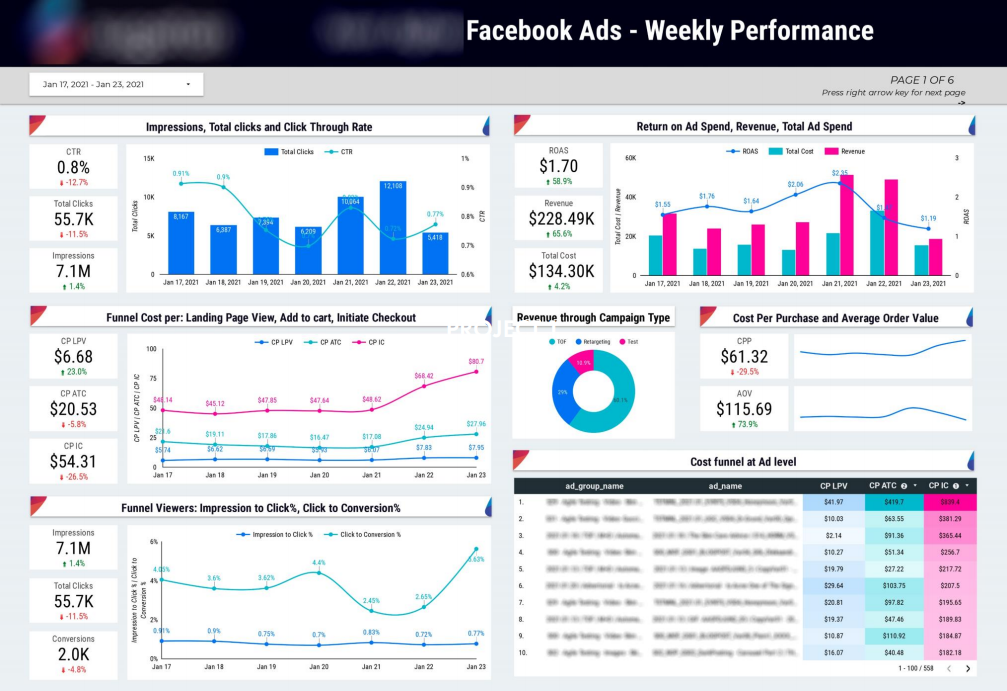
Data sources: Facebook Ads, Google Ads
Essential marketing metrics to include: ad spend, revenue, and ROAS, impressions, clicks, and CTR, conversion rates between funnel stages, cost per key action, average order value (AOV)
A marketing dashboard helps small businesses understand what they’re getting back from their ad spend and where performance breaks down in the funnel.
Our marketing analysts created a dashboard that shows how efficiently Facebook Ads move users through the funnel, from impression to purchase. It tracks ad spend, revenue, and ROAS alongside impressions, clicks, and conversion rates at each stage.
By visualising cost per landing page view, add to cart, checkout, and purchase, businesses can quickly see where budgets are being wasted and where optimisation will have the biggest impact. For our clients, this dashboard supports faster budget decisions, better ROAS, and more confident scaling of profitable campaigns.
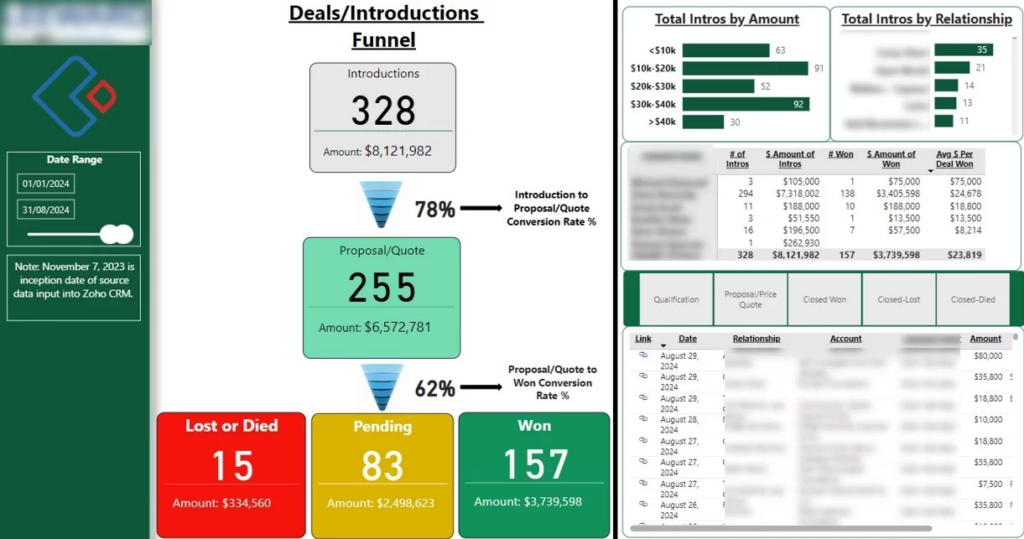
Data sources: Hubspot, Pipedrive, Zoho CRM
Essential sales metrics to include: pipeline value and stage distribution,conversion rates between stages, average deal size and sales cycle length, revenue vs target, performance by salesperson or account owner
A sales dashboard gives small businesses a clear view of how revenue is generated and where deals get stuck. It brings pipeline activity, deal quality, and sales performance into one place so teams can forecast more accurately and focus effort where it matters most.
We helped a financial services company visualise their Zoho CRM data in Power BI using an automated Power BI connector that delivers near real-time updates.
Our dashboard focused on deal sources, funnel conversion rates, average deal size, and performance by the account manager. This allowed the client to identify bottlenecks in their B2B sales process, prioritise high-quality lead sources, and improve forecasting by relying on live CRM data rather than static reports
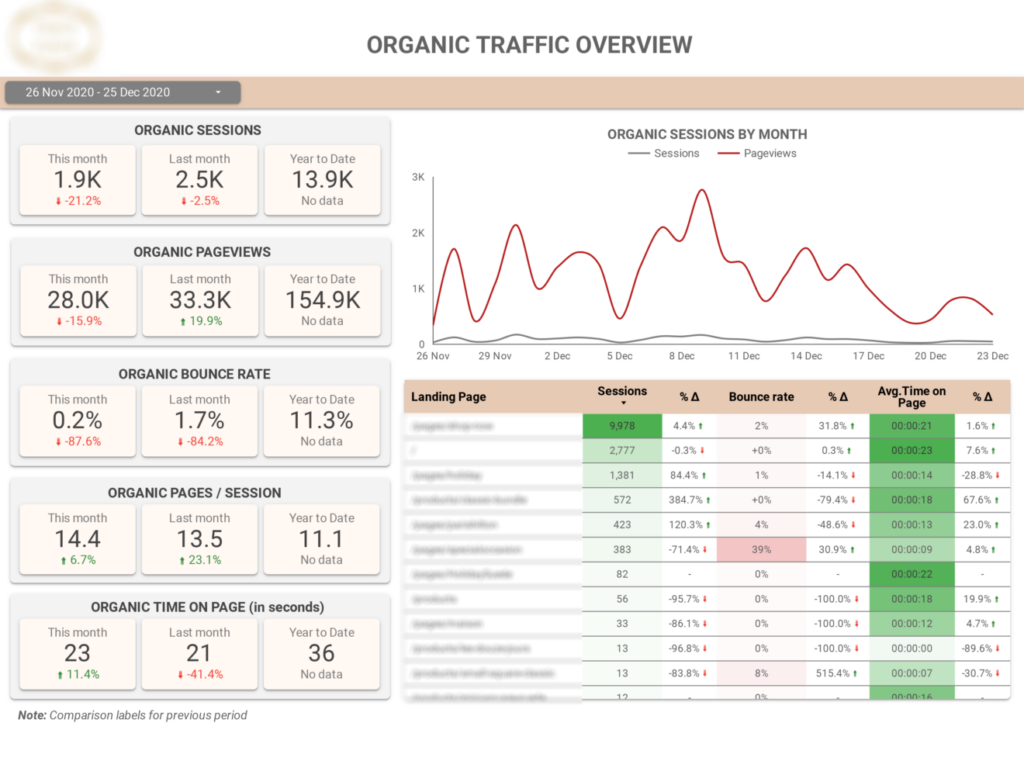
Data sources: Google Analytics
Essential SEO metrics to include: organic sessions and pageviews, bounce rate and time on page, trends in organic traffic, top landing pages by performance, engagement changes over time
An SEO dashboard helps small businesses understand how organic traffic behaves once users land on the site. It focuses on engagement and content performance, not just rankings, so teams can prioritise pages that actually drive results.
This SEO Looker Studio dashboard shows organic sessions, pageviews, bounce rate, and time on page for this month, last month, and last year, making performance changes easy to spot at a glance.
It includes page-level analysis for sessions, bounce rate, and average time on page, helping identify content that attracts traffic but fails to engage. Daily trend charts for sessions and pageviews highlight growth patterns and sudden drops, allowing our clients to quickly detect SEO issues and prioritise content improvements that increase organic conversions.
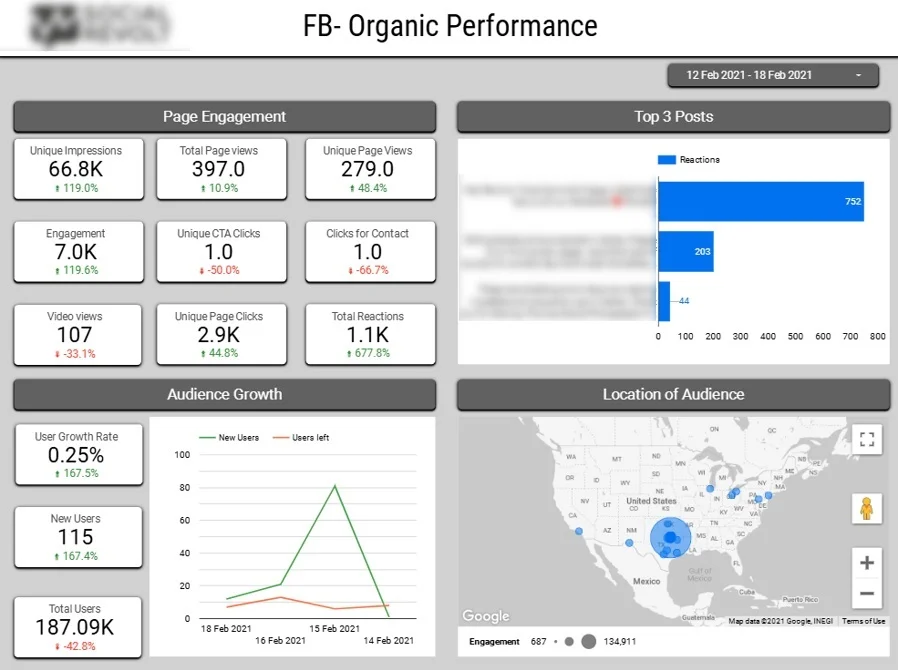
Data sources: Facebook, Instagram, Linkedin, Youtube
Essential social media metrics to include: total impressions, page clicks, reactions, engagements, top-performing posts, follower growth, unfollows, audience location by state
A social media dashboard helps marketing teams understand which content resonates with their audience and how social channels contribute to long-term growth. It focuses on engagement quality and audience trends rather than vanity metrics.
Our BI experts created a Looker Studio social media dashboard that tracks impressions, clicks, reactions, and total engagement, with a dedicated view highlighting the top three posts by reactions. This makes it easy to identify which content formats and topics generate the strongest audience response.
Audience growth is monitored through new followers and unfollows over time, helping teams evaluate the real impact of campaigns and posting strategies. A geographic breakdown by U.S. state shows where engaged audiences are located, supporting more targeted content planning and regional campaign optimization.
For our clients, this dashboard simplifies client reporting, improves content decisions, and provides a clear link between posting strategy, engagement, and audience growth.
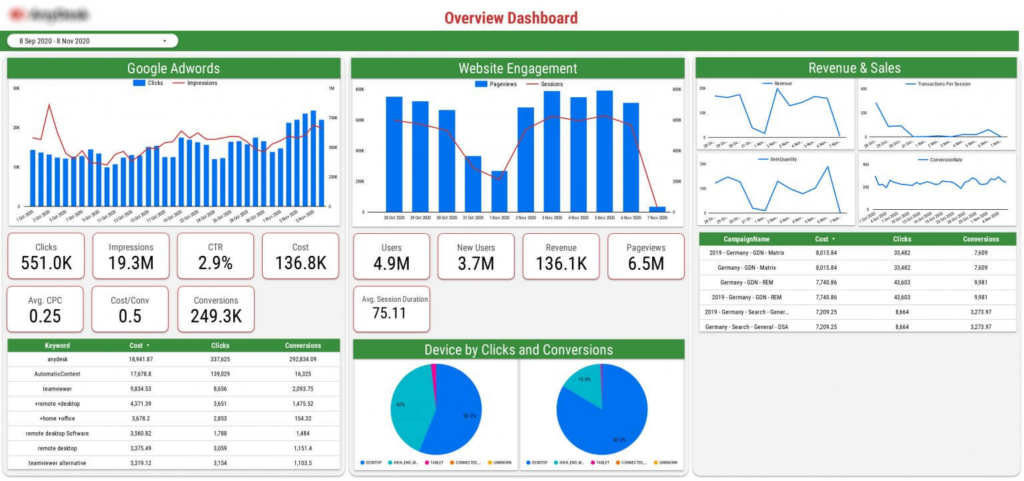
Data sources: Google Ads, Google Analytics
Essential Google Ads metrics to include: clicks, impressions, ad spend, conversions, cost per conversion, keyword performance, sessions, pageviews, revenue, conversion rate
A Google Ads dashboard helps businesses understand how paid search traffic turns into website engagement and revenue. By combining ad performance with website behaviour, it provides a complete view of campaign effectiveness.
We built this Google Ads dashboard for a SaaS company running Google Ads campaigns to drive product sign-ups and sales, while using Google Analytics to measure on-site behaviour. This dashboard shows how Google Ads spend translates into traffic, conversions, and revenue, combining ad performance with on-site behaviour from Google Analytics.
By linking keywords, campaigns, devices, and revenue in one view, it helps teams quickly identify which ads drive real business results and which waste budget. For our clients, this dashboard supports faster optimisation, clearer ROI tracking, and more confident budget decisions without switching between tools.
Best for: Small businesses using Microsoft tools and planning to scale reporting
Power BI is a powerful business intelligence platform that turns raw data into interactive dashboards. It’s widely used by small and mid-sized companies that want automated reporting across finance, sales, and operations.
Key features:
Pricing: Power BI Pro: ~$14 per user / month
Why it works for small businesses:
Power BI combines strong automation, flexible modelling, and affordable pricing. It’s well suited for small businesses that want accurate financial, sales, and operational reporting without rebuilding dashboards as they grow.
Best for: analysing data from Google products (Gads, GA4, Google Search Console) and sharing data outside of your organisation
Looker Studio is Google’s free dashboarding tool and a popular starting point for marketing and performance reporting.
Key features:
Pricing: Free (connectors may add small monthly costs)
Why it works for small businesses:
Looker Studio is ideal when budgets are tight and data already lives in Google tools. It delivers shareable dashboards with no license cost, making it a strong starting point for marketing and SEO reporting.
Best for: Businesses that prioritise advanced visualisation and exploration
Tableau is known for its high-quality visuals and powerful data exploration capabilities. It’s often used by teams that want to analyse data from multiple angles and present insights clearly.
Key features:
Pricing:
Tableau Creator: ~$70 per user / month
Tableau Viewer: ~$15 per user / month
Why it works for small businesses:
Tableau is a good fit when visual quality and exploratory analysis matter most. It’s powerful, but usually best suited to small businesses with dedicated analytics needs rather than simple operational reporting.
Small businesses can’t afford delayed insights when margins are tight, missing a trend for even a week can lead to cash flow stress, lost customers, or inventory issues that escalate quickly. Dashboards surface problems early, while there’s still time to act, and they eliminate hours of manual reporting by automatically consolidating data from multiple tools. Instead of spending valuable time pulling numbers just to understand performance, business owners gain instant visibility and can focus their energy on sales, operations, and growth.
Dashboards are especially powerful for early stage SaaS startups, where tracking cash flow, customer acquisition cost, and churn rate can make the difference between growth and stagnation. By consolidating these metrics, a financial dashboard helps you spot trends, manage costs, and make smarter decisions about where to invest your resources.
On the marketing side, a dedicated marketing dashboard lets you track marketing performance across various channels, compare strategies, and optimize campaigns for better results. Whether you’re running email marketing, paid ads, or organic campaigns, dashboards provide the insights you need to adjust your approach and maximize ROI.
Ultimately, dashboards reduce manual work, save time, and help you focus on the tasks that drive revenue and growth. With all this information at your fingertips, you can monitor performance, spot opportunities, and make informed decisions that move your business forward.
Creating an effective dashboard starts with simplicity and focus. Small business owners should prioritize key metrics that directly impact business performance, rather than trying to track every possible data point. Using pre-built templates can save time and ensure your dashboard is both user-friendly and customizable to your needs.
Integrating your dashboard with essential tools like Google Analytics and your CRM system provides a comprehensive, real-time view of your business. Avoid cluttering your dashboard with vanity metrics—focus instead on important data that drives decisions, such as revenue, conversion rates, and customer acquisition cost.
A great dashboard should deliver actionable insights at a glance, helping you and your team make informed decisions quickly. By following these best practices—keeping it simple, focusing on what matters, and leveraging real-time analytics—you’ll create a dashboard that supports growth and improves overall business performance.
One of the most common mistakes small businesses make is trying to track too many metrics at once. Overloaded dashboards quickly become confusing and rarely lead to action. It’s far more effective to focus on a small set of KPIs that directly impact revenue, cash flow, and growth.
Another issue is relying on manual data updates or poorly connected tools. Dashboards that aren’t fully automated quickly fall out of date, forcing teams back into spreadsheets and manual checks. This defeats the purpose of having a dashboard in the first place.
Small businesses should also avoid vanity metrics that look impressive but don’t support decisions. Metrics like followers or pageviews only matter if they connect to conversions, retention, or revenue.
Finally, using generic dashboards without adapting them to your business can limit their value. Dashboards should reflect how your business actually operates, not just what’s easy to report. When built around the right KPIs and automated data sources, dashboards provide clear, real-time insights that support faster and smarter decisions.
Small business dashboards aren’t about having more data. They’re about having the right data, in the right place, at the right time. When your key metrics are clear and up to date, decisions become faster, simpler, and far less stressful.
The most effective dashboards start small. Focus on the metrics that directly impact revenue, cash flow, and delivery today, then expand as your business grows. With the right setup, dashboards quickly pay for themselves by saving time, reducing risk, and improving performance. If you’re ready to stop relying on spreadsheets and manual reports, we can help. We design and build custom small business dashboards tailored to your goals. Get in touch to discuss your requirements or start with a proven template that delivers value fast!
![]()
![]()
![]()