Power BI as a tool is not industry-specific or department-specific. As a result, Power BI use cases include finance, sales, HR, operations, IT, and many other departments. There are also plenty of Power BI use cases by industry, including retail, healthcare, professional services, market research, etc.
Our Power BI developers have delivered 1,000+ projects for 600+ clients of different sizes. As a result, we have implemented Power BI for companies across a wide range of industries and departments.
In this article, we’ll walk you through 14 Power BI case studies for different use cases to help you see where and how businesses can benefit from Power BI.
Regardless of industry or department, broadly speaking, companies implement Power BI to either automate their reporting or find actionable insights.
Many companies have to provide reporting to investors, clients, or senior management. There are many examples of this:
Many companies have to provide reporting, no matter what; not providing it is simply not an option.
Power BI reporting automation helps to solve several problems:
Many companies need to find actionable insights to optimize their processes through data analysis. Power BI has advanced data visualization capabilities for descriptive analytics.
These actionable insights help to either reduce costs or increase revenue, which in turn provides a substantial return on investment.
We always recommend building Power BI reports that support an ongoing process in your organization. Ideally, this process generates revenue or incurs variable expenses. Power BI reports can help to manage this process more effectively and in a structured way, which therefore leads to a return on investment.
On the other hand, many companies can also benefit from using Power BI for ad-hoc one-off analysis. Power BI makes it easy to pivot data and quickly find answers to your questions.
For example, when we created Power BI reports for Neterra Telecommunications, they reported finding a one-off cost-saving opportunity worth 50k EUR and new sales opportunities worth 10k EUR per month.
Power BI use cases vary by department. Every department has its own data sources, KPIs, and scope for analysis. In the next section, we will demonstrate common use cases that we see in each department.
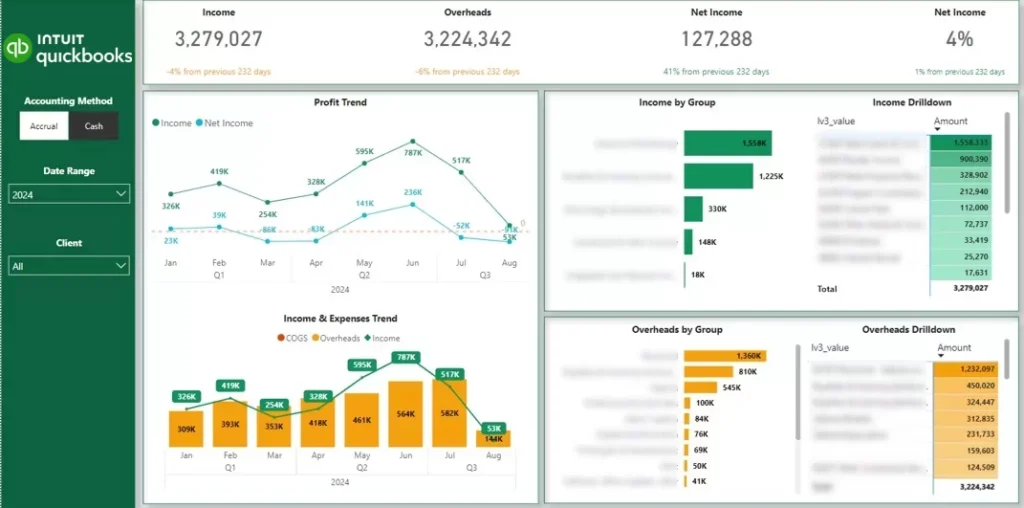
With Power BI, finance teams can track financial KPIs, forecast financial performance, and support sales teams with customer-level analytics.
The Power BI finance dashboards that we build connect automatically to accounting tools like QuickBooks Online, Xero, and Dynamics – pulling the data in for you automatically so you don’t have to rely on endless, confusing spreadsheets.
In one of our recent projects, a fractional CFO consultancy wanted to automate their client reports. Their main challenge was having to extract the data manually from dozens of QuickBooks Online accounts. This often led to manual errors, which reduced the client’s trust in the data.
To address this issue, we created the automated P&L Power BI dashboard, which integrated directly with QuickBooks Online. As a result, this CFO consultancy saved 4 hours per month in report maintenance and improved customer service through better reporting.
This Power BI case study shows that finance teams can save valuable time by automating their accounting reports.
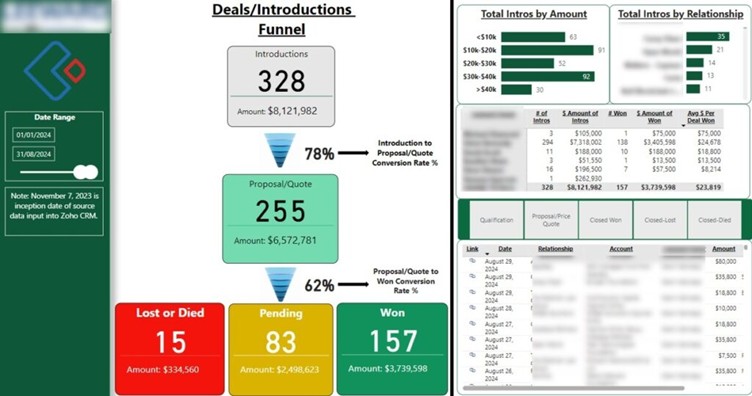
Sales departments can use Power BI to analyze their sales pipeline, compare the actual performance to the target, and find areas of sales growth.
The Power BI sales dashboards that we build usually extract the data from different CRMs (Salesforce, Hubspot) in the B2B context and ERPs/POS systems (Shopify, Lightspeed, Brightpearl) in B2C context.
For example, Teleperformance has engaged us before to build a B2B sales dashboard from their Salesforce CRM. The goal of this dashboard was to analyze the number of leads and opportunities per source, country, and service line. They also needed a way to measure which lead sources generate leads, deals, and revenue.
Before Power BI, they were relying on Excel reports, which were difficult to maintain and took 6 hours of work to refresh with new data. Another challenge was producing a good-looking data visualization, which was important since these reports went to the Global Head of Marketing.
Our Power BI consultants created a fully automated process to extract the data from Salesforce and LinkedIn Ads. We then automated data transformation in Power Query and designed professional-looking Power BI reports. You can read more about this Power BI case study here.
As a result of this project, Teleperformance was able to provide professional reporting to its marketing leadership and refreshed it automatically every day, which saved 30 working hours per week.
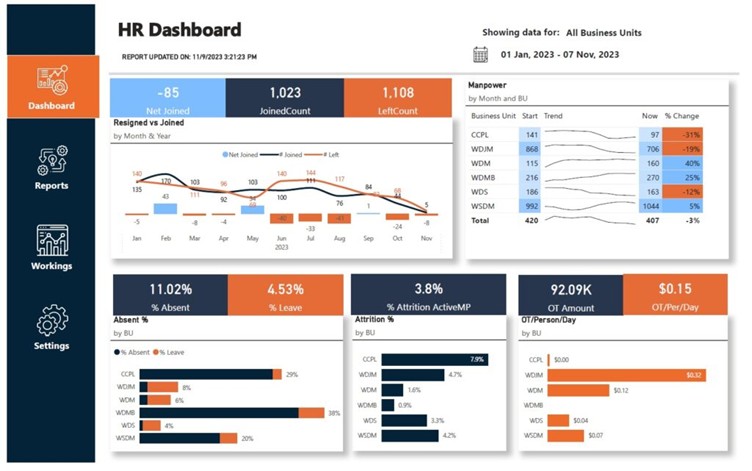
HR departments can use Power BI for analyzing their current workforce composition, recruitment pipelines, absenteeism, attrition, and overtime. Monitoring HR KPIs on a Power BI report helps HR teams to ensure compliance with DEI, keep overtime payments under budget, and bring more structure to processes like recruitment and performance reviews.
The data for HR Power BI dashboards usually comes from learning management systems (LMSs), HR management systems like Workday, and sometimes Finance systems for payroll analytics.
One Power BI case study that comes to mind is how Vidi Corp built an HR dashboard for a diamond polishing company. The company experienced a sharp increase in overtime work and required management reporting to keep it under control.
Our business intelligence consultants have built the Power BI dashboards you see above for tracking the number of overtime hours by department and how it changed over time.
The main factor for driving overtime work was attrition (when employees resigned and the role remained vacant for more than 3 months). The dashboard that we built analyzed the number of new joiners and resignations by month and how they affect the attrition rate.
As a result of using this Power BI dashboard, the client reduced their overtime hours from 15k per month in January to 1k per month in September.
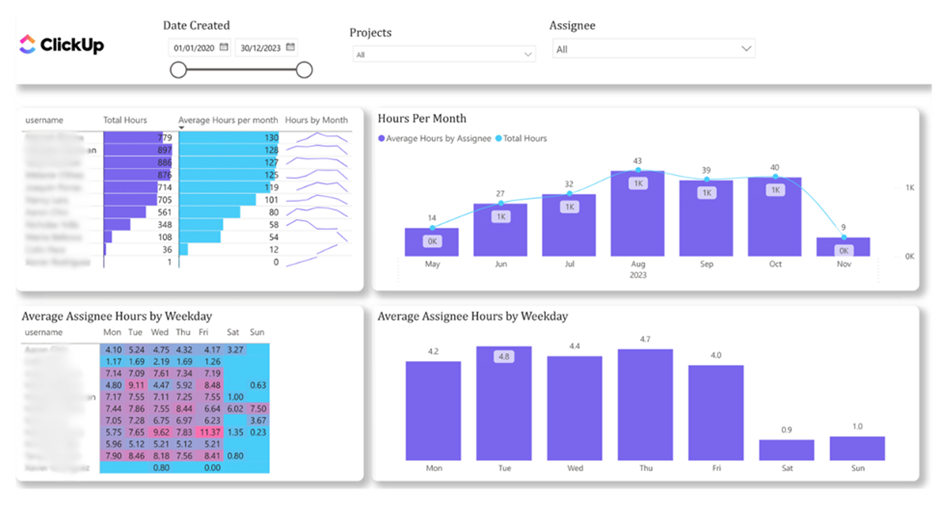
Operations departments can benefit from Power BI by analyzing the number of completed tasks and working hours by employee. Operations analysis in Power BI helps to track the productivity of every team member and is instrumental for performance reviews.
For operations departments juggling multiple projects and looming deadlines, it’s never truer than it is today. This Power BI dashboard integrates with ClickUp and gives you an end-to-end view of how much time is being spent across projects and team members.
You can track how projects are progressing, be alerted when workloads are starting to get out of whack, and pick up on those early warning signs of burnout and underutilisation before they become a real problem. This lets you plan more effectively, assign tasks in a way that makes sense, and keep all of your projects ticking along at the right speed.
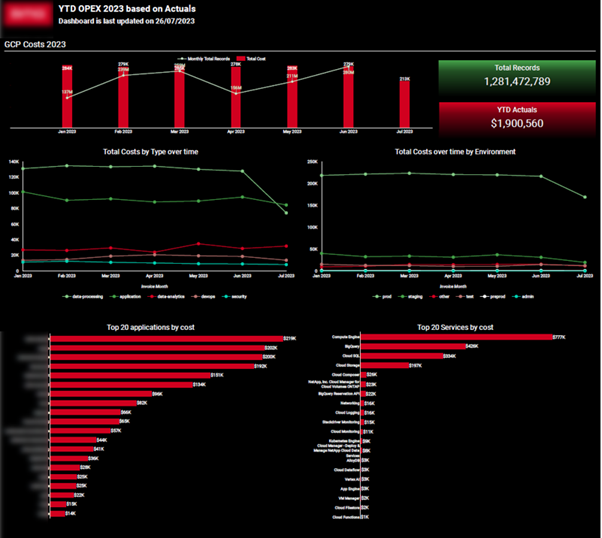
IT departments use Power BI to report on how effectively they keep the IT licensing costs under control and the number of security risks they have addressed.
The data for addressing security risks is extracted from data governance systems like Microsoft Purview, whereas data on IT costs comes from cloud platforms like Azure or GCP.
A Sony subsidiary that we worked with wanted to implement Power BI to report on Google Cloud Platform costs to management. This reporting was essential to prove the value of the IT department to management and highlight the effectiveness of their optimization initiatives.
The Power BI report that we created showed that the number of rows in the database has increased by 200% but the costs have only increased slightly. This analysis helped their finance team to budget for IT expenditure in the future and have predictable costs every month.
This Power BI use case demonstrates how Power BI reporting can be used to encourage management to keep investing in IT optimization initiatives.
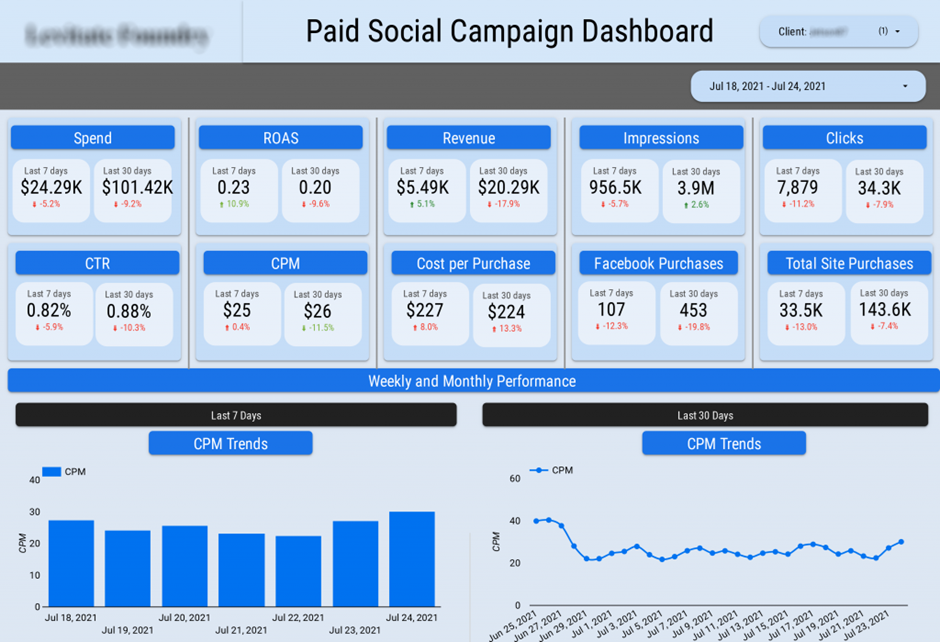
Marketing departments use Power BI to report on what they spend the marketing budget on and highlight the return on the marketing investment. Power BI marketing analytics reports can also be used to highlight optimization opportunities to marketers and increase the marketing ROI through data-driven decision-making.
The marketing data is usually extracted from PPC sources (Facebook Ads, Google Ads), email marketing tools (Mailchimp, Klaviyo), SEO systems (GA4, Ahrefs, SEMrush), etc.
For example, one of our Power BI case studies is producing reports for the marketing department of an FTSE 100 company. The key challenge that they wanted to solve through Power BI is reducing the amount of work needed to pull the data together.
Our Power BI report automated data extraction from their CRM, 6 Facebook ads, 7 Google ads, and 14 LinkedIn ads accounts. As a result, they reported saving 30 working hours per month and eliminating manual errors.
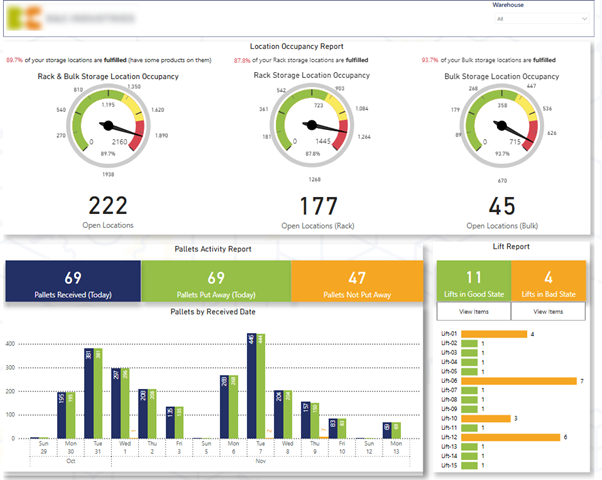
Power BI is used in supply chain departments to analyze inventory levels and the warehouse’s capacity.
Supply chain departments usually have their own custom data warehouses that contain this information. However, sometimes you can see inventory levels in Shopify and ERPs like SAP Hana.
In one Power BI case study, we worked with an FMCG company that had 3 proprietary warehouses. They requested a Power BI warehouse dashboard to help them manage occupancy levels, detect bad inventory management practices, and track which orders are shipped out late.
Power BI implementation helped this company reduce idle resources by receiving automated alerts when specific issues were detected.
Power BI use cases are also different per industry since different processes generate revenue and drive costs. In the next section, we will review different Power BI case studies from every industry.
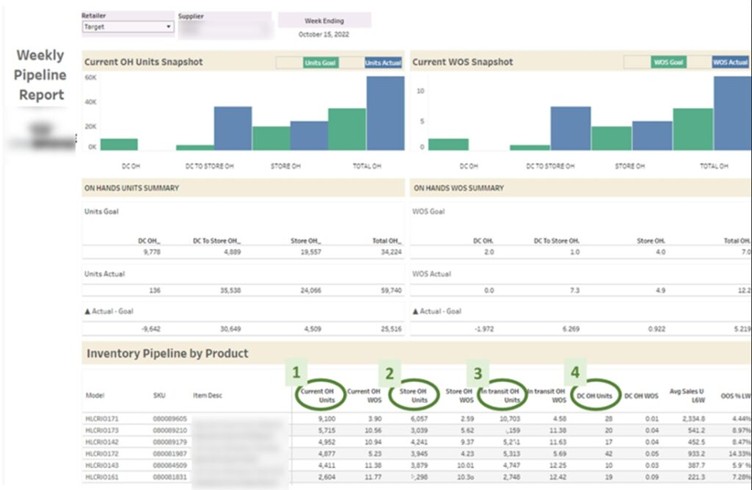
Power BI is used in retail to track sales across brick-and-mortar stores, Amazon, and online stores. It is also used to manage inventory levels and relationships with wholesale partners like Walmart, Target, and Best Buy.
The data for retail analytics comes from the POS systems, Amazon Seller Central, and Online Store systems (e.g., WooCommerce, Shopify).
In a recent Power BI case study, we helped a beverage company manage its sales through Walmart. They needed a dashboard that gives them the data they can use to drive more sales through Walmart.
The dashboard that we produced analyzed the current stock levels in Walmart to determine if they are enough to cover the demand for the next 8 weeks. When Walmart stock levels fell under a certain threshold, our client would contact Walmart to sell them another batch of products.
If you’d like to build a similar dashboard, get in touch with our retail analytics consultants!
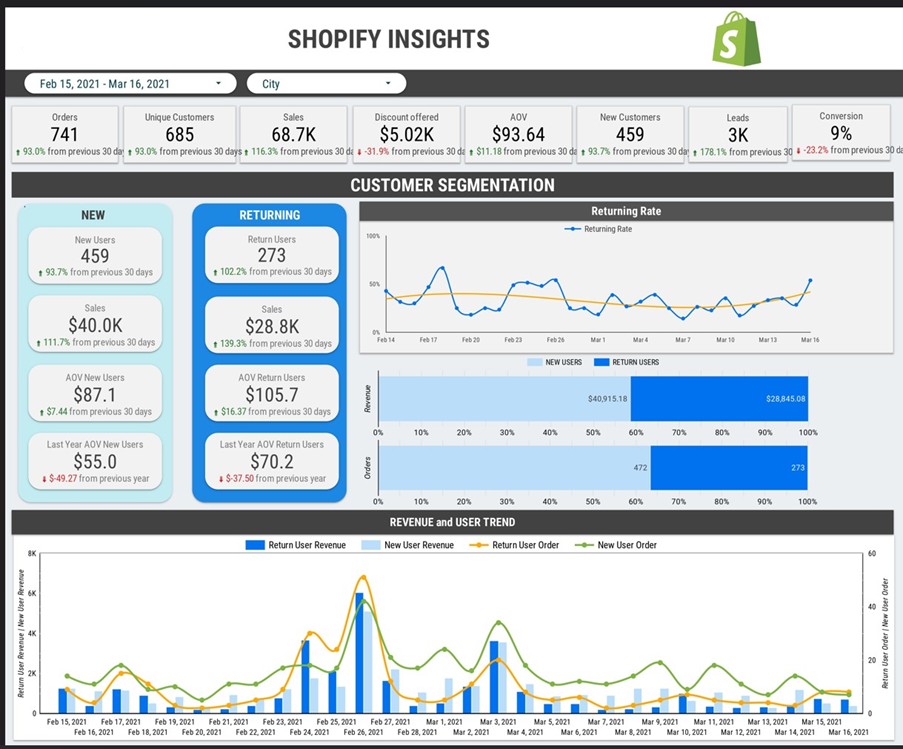
Power BI use cases in e-commerce include customer segmentation and cohort analysis, loyalty analytics, and finding the best customer acquisition channels.
The data sources for Power BI ecommerce reports are CMS systems like Shopify and Magento, and various online marketing platforms that are used to drive customers to the website.
In a recent Power BI case study, we worked with a Shopify store that used Facebook Ads, Google Ads, and Amazon to sell its products. They needed reporting to combine Shopify sales with Amazon and understand the blended return on marketing investment.
The Power BI dashboard that our ecommerce analytics consultants created automated this calculation and made it easy to compare the profitability of marketing investment through every channel.
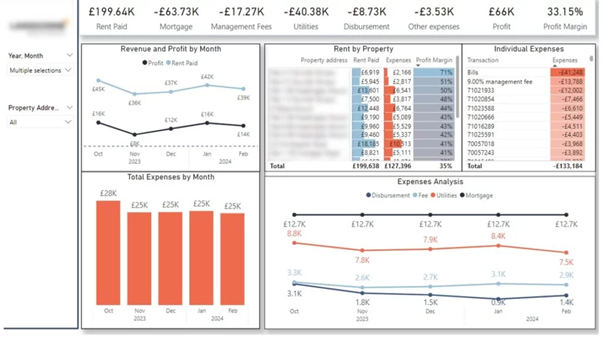
Real estate companies use Power BI to create consolidated financial reporting on all of their properties, which helps to bring costs under control and make their investments more profitable.
When you’re in charge of multiple properties, you know how, all too easily, financial numbers can end up scattered across countless rent sheets, invoices, and emails. This Power BI real estate dashboard is designed to bring everything together, giving you a self-explanatory and complete view of your financial situation at a glance.
In a recent Power BI case study, we created a Power BI real estate dashboard for a UK-based property investor. The dashboard helps to track rent payments, keep an eye on those monthly expenses, and get a sense of which properties are really raking it in – as well as spotting the ones that need a bit of attention.
It also highlights areas where costs are starting to creep up and margins are starting to take a hit – all of which helps you nip things in the bud before they turn into real problems down the line.
For property managers and real estate investors, having access to this kind of dashboard can turn what would otherwise be endless tracking into genuine insight. It helps you understand how your properties are actually performing, where you can cut back waste, and make more informed decisions about where to put your money next.
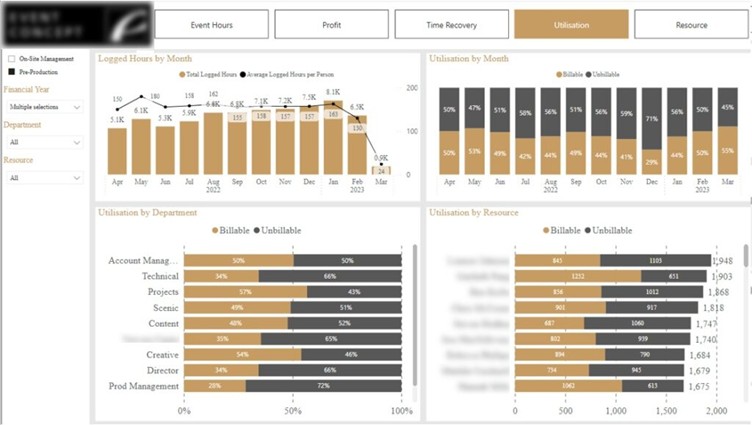
Professional services companies use Power BI to manage their consultants and ensure that they are making the money back on the salaries they pay.
Power BI analysis in the consulting industry is usually created from project management tools like Jira and ClickUp. However, in some industries like manufacturing, the operational analysis is created from ERPs.
We often create Power BI project management dashboards for operations departments. For example, we created one for an event company in London to help them analyze how their time was spent.
As a result of this Power BI implementation, they can see how much of their time is being spent on billable work vs internal work. Managers can quickly glance over and see that
one team member has too much on their plate while another is twiddling their thumbs. Ultimately, this Power BI case study demonstrates how operations reporting helps to allocate time per task better and keep projects on track from start to finish without breaking a sweat.
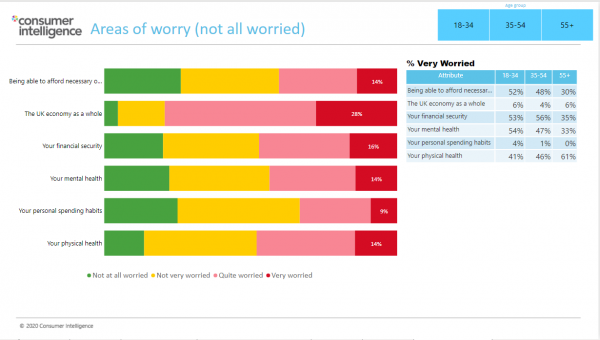
Power BI is used in the market research industry to visualize survey data and present the results of the research. Market research companies usually integrate Power BI with services like Survey Monkey to extract the data automatically.
Collecting survey data is one thing; turning it into insight is really where the rubber meets the road.
For example, Consumer Intelligence approached us to visualize survey data about how people felt towards insurance during COVID-19. Consumer Intelligence then sold the insights to their clients in the insurance industry, providing a faster way to analyse their weekly COVID-19 impact surveys. They used to manually compile the results into PowerPoint slides (a long and repetitive process that took hours every week).
With the new Power BI setup, all the data gets pulled in and turned into visuals that show what matters. You can see what’s worrying people, compare sentiment across age groups, and watch how opinions change over time. There, raw survey data turned into insights, minus the hours of manual work and reporting every week.
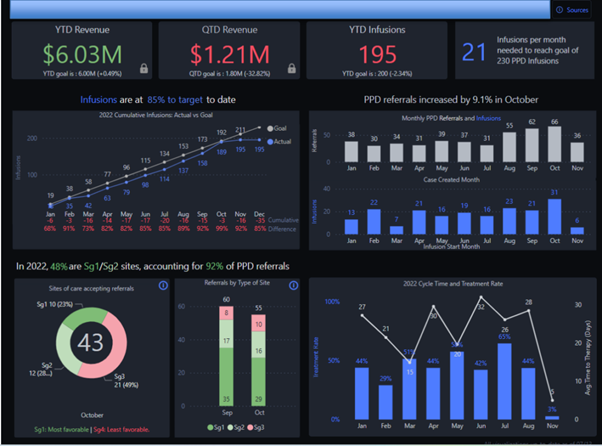
Pharma companies use Power BI to track the sales performance of their products and analyze their clinical trial data.
For example, a pharma company approached us in 2022 to analyze the sales of the new drug that they launched. They wanted to increase the visibility on how many doctors were referring patients to their products, how many infusions were made every month, etc.
The Power BI pharma dashboard that we created provided a summary of the number of infusions completed to date, the status of referrals, and the time it takes for patients to begin treatment, so the pharmacy can know if they’re meeting their target and figure out what needs improvement.
This Power BI case study demonstrates how big pharma companies can manage the rollout of new drugs in a structured way with proper management reporting.

Schools and universities use Power BI to analyze which marketing sources bring them new students, track how they are progressing to their academic goals, and much more.
We have worked on several data analytics projects for schools and universities, which demonstrate the value of Power BI.
For example, Buffalo Public Schools implemented Power BI with us to analyze their progress towards their 5-year objectives. Those were ranging from increasing the average student exam scores to providing more support for kids from minority communities.
The set of Power BI reports that we built helps Buffalo Public Schools show how students are participating in summer learning, afterschool programs, and post-secondary enrollment, and also shows trends in family and parent engagement.
Educators can see how each school is performing, compare results across years, and identify areas that need more attention.

Power BI is used in the hospitality industry to measure occupancy rates, anticipate demand to plan staff schedules, measure performance on Uber Eats, and much more.
We have had many Power BI case studies demonstrating applications of data analytics in hospitality.
For example, we have worked with an Australian hotel chain to create a dashboard that brings together bookings and occupancy rates, room prices, and revenue so managers can see exactly how their business is doing at any point in time.
The client can see trends in bookings, compare performance across years, and see which room categories are making the most money. The dashboard also allows them to track cancellations, adjust pricing when demand changes, and plan for peak seasons. For hospitality businesses, it’s a way to stay on top of operations and improve revenue and guest experience.
Power BI isn’t just about dashboards. It’s about helping you understand your business better, make quicker decisions, and uncover insights you would otherwise miss. Whether you’re running a school, a retail chain or a marketing team, there’s a Power BI use case that fits your goals. If you’re ready to see what’s possible for your business, contact Vidi Corp to start building dashboards that translate into value.