
Modern businesses don’t win on data they have — they win on data they can act on right now. That’s where Operational Business Intelligence comes in: turning real-time and historical insights into smarter, faster day-to-day decisions.
As the #1 rated Business Intelligence Consultancy on G2, we’ve helped 600+ clients design and deploy operational BI solutions that improve visibility, speed up execution, and tighten performance.
In this article, we’ll unpack what operational business intelligence is, how it differs from traditional BI, which industries benefit most, and the tools that help teams boost operational efficiency.
Operational Business Intelligence (OBI) turns day-to-day operational data into clear dashboards and management reports teams can actually use — every single day. The goal is simple: spot issues early, respond fast, and stay focused on the work that moves performance forward.
Unlike traditional BI, which often looks back to guide long-term strategy, operational BI is built for speed. It helps teams make quick, confident decisions that improve efficiency, responsiveness, and results.
It does this by combining continuous data collection, real-time analytics, and easy-to-read data visualizations. When current performance is visible at a glance, teams and managers can react faster, fix bottlenecks, and keep operations running smoothly — even in fast-changing environments.
The main difference between operational business intelligence and traditional business intelligence lies in their focus and purpose.
Traditional BI is used for historical data analysis, providing insights that support long-term strategic and tactical decisions. In contrast, operational BI is designed to support day-to-day operational decisions by analyzing live or near-real-time data.
Setting up alerts based on data is especially important in operationa BI. When a metric reaches a certain threshold, the system would usually send an automated email alerting the relevant people.
Traditional BI is good for detailed reports, making forecasts, and reviewing performance. Operational BI, however, is about quick responses, ongoing KPI tracking, and immediate action.
In the real-world traditional BI solutions are usually built for C-level executives and used to inform strategic decisions whereas operational BI solutions are built for process managers to make them more efficient. For example, companies use traditional BI to analyse trends over a quarter or a year to plan future strategies. With operational BI, managers can monitor the execution and effectiveness of those strategies, spot problems right away, and make quick changes.
Operational Business Intelligence allows organizations to analyze and act on data in real-time, helping businesses respond immediately to changing conditions. The following examples highlight how Operational BI is applied across key industries and business functions to drive operational efficiency.
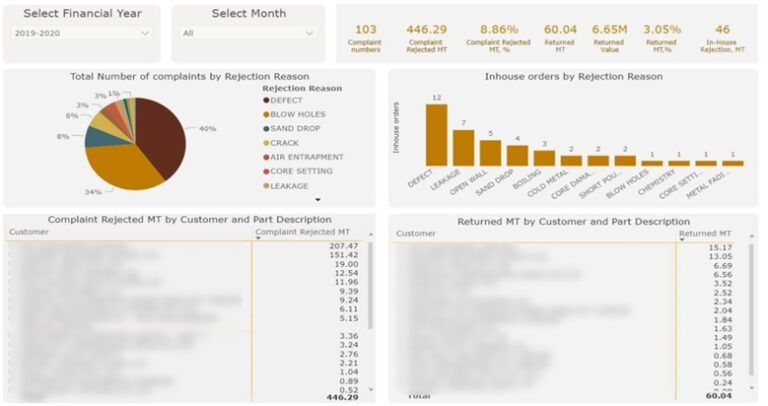
This operational BI dashboard developed by our Power BI consultants makes quality problems impossible to ignore — and tells teams exactly where to focus next.
Every day, supervisors and quality teams use it to see why products are being rejected and which customer is being affected the hardest. At a glance, they can identify the top rejection drivers (defects, blow holes, sand drops, cracks, etc.) and track the financial impact of returns by month and across the financial year.
They can also drill into rejections and complaints by customer and part, so it’s clear whether a spike is tied to a specific production run, component, or supplier.
Most importantly, the dashboard turns data into action: it highlights where problems occur most often and which issues cost the most, helping teams prioritise investigations, target corrective actions, reduce scrap and returns, and protect customer satisfaction — giving the factory tighter, day-to-day control over product quality.
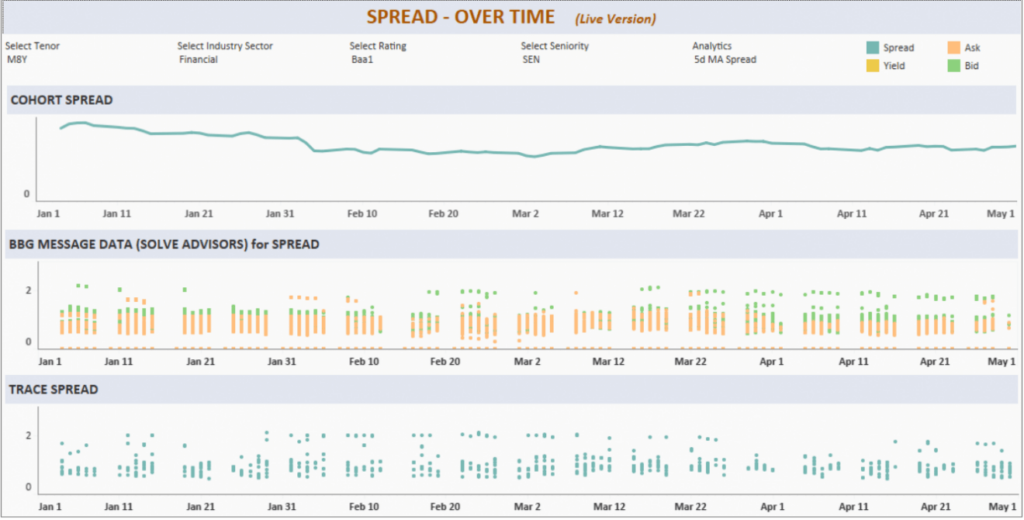
Our Tableau consultants created the following Tableau dashboard for the investment team a live, decision-ready view of the bond market — so they know what to act on today, not after the fact.
Bond investors use this Tableau dashboard throughout the day to track near-real-time movements in bond yield, spread, and bid/ask prices, with clear daily trend visuals that surface changes as they happen. Instead of pulling data from multiple sources and reacting late, the team can quickly spot widening spreads, yield shifts, or liquidity changes, then immediately focus their analysis on the specific bonds or sectors driving the move.
The result is a workflow where the dashboard guides priorities: it highlights where transaction price is increasing, where pricing is attractive, and where execution conditions are improving — helping the firm make faster, more confident allocation and trading decisions based on the metrics that matter most.
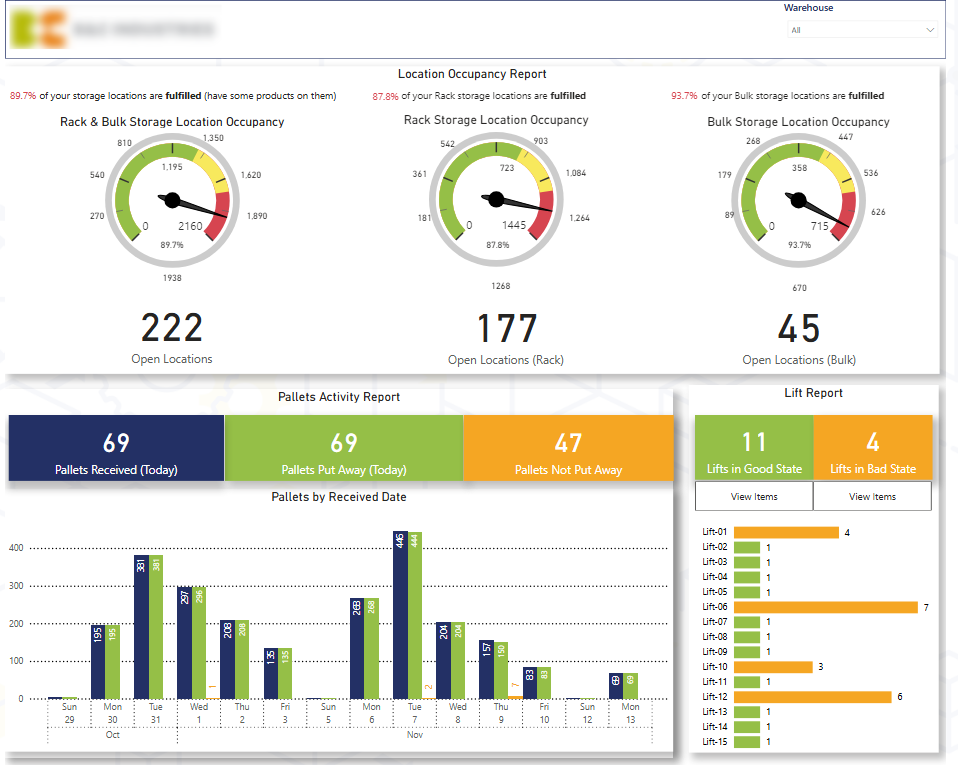
Developed by our BI consultants for a logistics client, this operational BI dashboard is designed as a practical — not generic — daily “health check” for inbound and putaway performance, so warehouse managers can quickly see what’s on track and what needs action.
The client monitors how effectively warehouses are accepting deliveries and using capacity across two storage methods (rack and bulk). By comparing locations that are still open versus occupied/fulfilled, managers can spot space constraints early and direct teams to the areas that are becoming bottlenecks.
The dashboard also tracks daily inbound pallet volumes and shows how many pallets have been put away into storage locations versus those still pending. This makes the backlog visible instantly, helping managers prioritise the pallets that haven’t been stored yet and keep the floor flowing.
Finally, it analyses items per forklift, allowing managers to identify which forklifts still have items on them. With a simple drill-down (e.g., “view items”), they can see the exact items and assign the team to put them away — reducing dwell time, improving throughput, and keeping operations running smoothly.
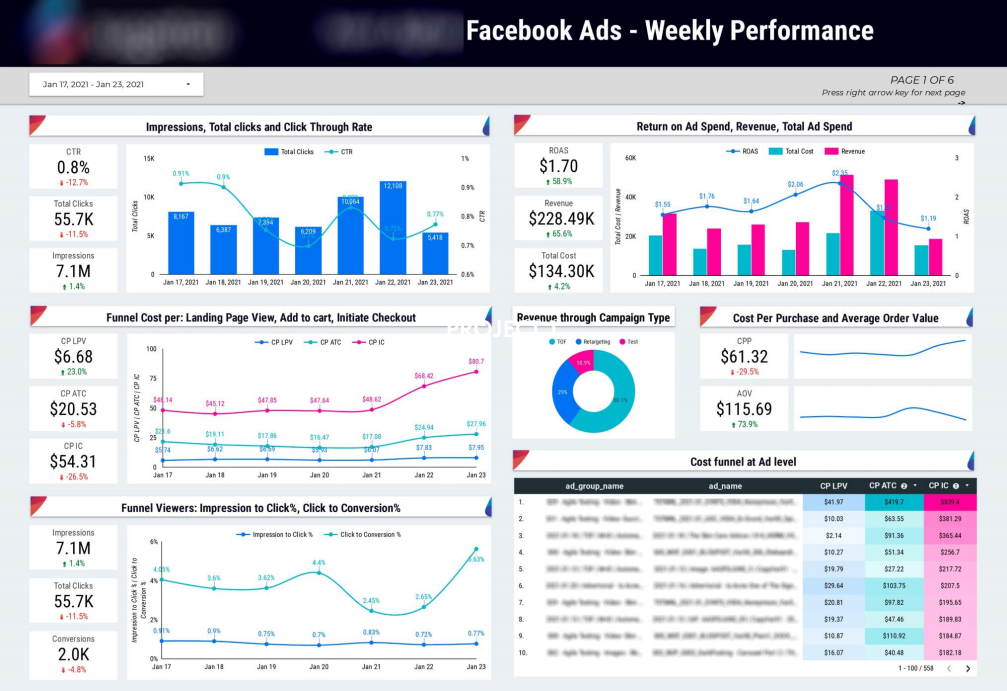
Our marketing analytics consultants developed this operational BI dashboard for a Facebook marketing agency to help them effectively manage client budgets.
The agency monitors Facebook Ads cost to ensure even budget pacing across the month. If spend is running ahead of plan and a client’s budget is being burned too quickly, the dashboard flags it early — giving the team time to dial spend down for the next few days and bring pacing back under control.
The dashboard also tracks cost per conversion across key dimensions like ad and location. When certain segments creep above the target CPA, the team can quickly pinpoint the cause and take action — pausing inefficient ads/locations or adjusting bids to improve efficiency.
Finally, it supports ongoing A/B testing by making winning ads clear over time. When one creative consistently outperforms an alternative, the agency can confidently pause the underperformer and reallocate more budget to the stronger ad – improving results.
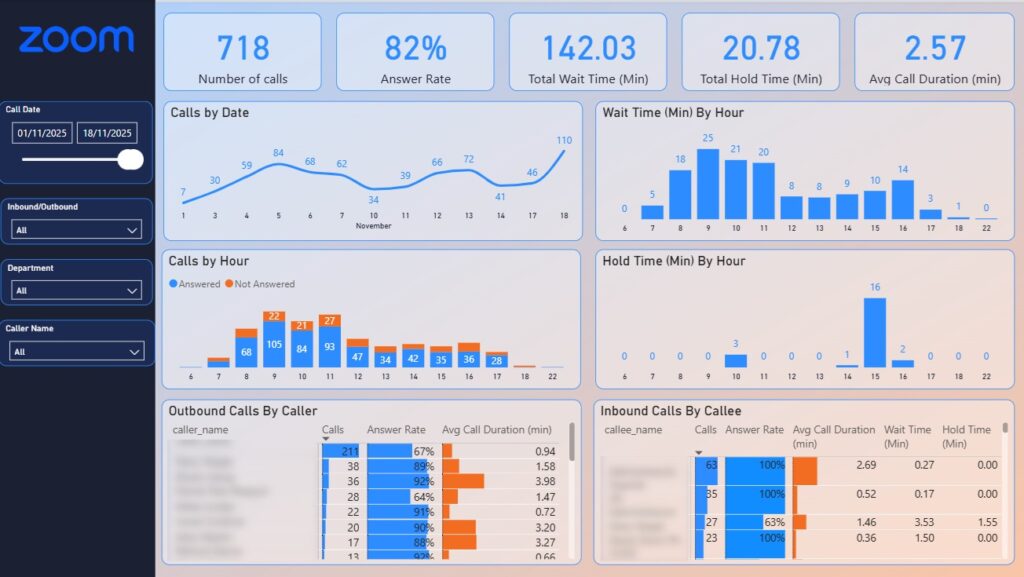
We developed the following operational BI dashboard for a customer support call center so managers can instantly see where service levels are slipping and what needs attention.
On the landing page, the Zoom Phone Analytics view quickly shows when fewer than 100% of incoming calls were answered. A simple hourly breakdown of unanswered calls highlights exactly when missed calls spike, helping call centre managers schedule additional staff during peak periods and prevent avoidable drop-offs.
The dashboard also breaks down answer rate by agent, making it easy to spot individuals or shifts where more calls are being missed. When certain agents consistently miss a higher volume, managers can take immediate action – for example, rerouting some calls to other agents to protect overall coverage.
Finally, it surfaces the operational drivers behind customer experience by showing caller wait time before answer and average hold time by hour. Managers can drill in (via hover tooltips and call-level detail) to understand what’s causing delays, coach agents to reduce wait and hold times, and improve answer rates and service levels in real time.
Operational Business Intelligence delivers immediate insights that directly impact day-to-day business operations. By focusing on real-time data and continuous monitoring, OBI enables organizations to operate more efficiently, respond faster to change, and make better-informed decisions at the operational level.
Operational BI provides access to real-time data and alerts, allowing businesses to make decisions based on the most current information available. This enables teams to react immediately to changing conditions, emerging risks, or new opportunities.
Continuous key performance indicators monitoring helps organizations identify bottlenecks, inefficiencies, and anomalies as they occur. Automated responses and timely interventions streamline operations and reduce manual effort. For organizations that require structured reporting and advanced analytics, Bay Forward Microsoft Power BI consulting delivers enterprise-grade dashboards, data modeling, and automated reporting solutions that transform raw data into actionable business intelligence.
Operational BI provides an up-to-date view of operational performance through dashboards and live metrics. This visibility helps managers and teams quickly identify issues, track progress, and optimize processes in real time.
Unlike traditional BI, which often supports retrospective analysis, OBI is designed to drive immediate action. Insights are used to adjust inventory levels, optimize staffing, reroute shipments, or respond to customer behavior as events unfold.
Operational Business Intelligence tools are tightly integrated with core systems such as ERP, CRM, and management tools. This ensures data is always current, reliable, and directly connected to operational processes.
User-friendly dashboards and self-service analytics empower business users to explore data and act independently, reducing reliance on IT teams. Shared insights also improve collaboration across departments.
Operational Business Intelligence can be highly valuable, but implementing and maintaining it can be challenging. Since OBI is all about real-time data and quick action, organizations need to overcome technical, organizational, and strategic hurdles to make it work.
OBI uses data from many systems, like ERP, CRM, and supply chain platforms. Bringing all this data together in real time can be difficult, especially if the data is kept separate or organized in different ways. To handle large amounts of data and keep things running smoothly, organizations need strong data pipelines and well-designed systems.
A main challenge in OBI is balancing data accuracy with processing speed. Cleaning data too much can slow down insights, but not checking enough can make results unreliable. Organizations need to set clear quality standards that let them make quick decisions while still trusting the data.
Even the most advanced OBI tools deliver little value if users do not adopt them. Resistance to change, lack of analytical skills, or overly complex dashboards can limit usage. Ongoing training, intuitive design, and strong change management are essential to ensure teams can interpret insights and act on them confidently.
Operational BI often handles sensitive, real-time data. Implementing access controls, data governance, and regulatory compliance adds complexity. Security measures should protect data without reducing performance or accessibility.
Below are some of the most widely used OBI tools and their core capabilities.
Microsoft Power BI is a business intelligence tool that turns raw data into actionable insights through dashboards and reports. It is widely used for data visualization, reporting, and analytics, especially in organizations that rely heavily on Microsoft products. While the interface is easy to use, getting the most out of it often requires some analytical expertise.
Core features
Tableau is a top BI tool known for its excellent data visualization features and its ability to handle complex datasets. It allows teams to explore data in real time and create interactive dashboards that support operational decision-making. Tableau is especially useful for users who need visual analytics and data exploration with minimal coding.
Core features
Looker Studio is a cloud-based BI tool designed for operational and marketing intelligence. It works seamlessly with Google Ads, Analytics, and other cloud platforms, enabling teams to monitor campaign and website performance in real time. Its user-friendly interface makes it easy for non-technical users to create and share dashboards.
Core features
Domo is a cloud-first business intelligence platform designed for real-time operational insights. It excels at connecting multiple data sources, offering mobile-friendly dashboards, and enabling collaboration across teams. Domo is perfect for organizations that need to make fast, data-driven decisions at scale.
Core features
Operational Business Intelligence has become a critical tool for organizations that need to act quickly. OBI enables businesses to improve efficiency and respond proactively to changing conditions. With the right tools and dashboards in place, organizations can turn real-time data into a competitive advantage.
At Vidi Corp, we have delivered 1,000+ analytics solutions to 600+ clients around the world. We would love to bring our experience to your project. Contact us today to discuss your operational BI needs!
![]()
![]()
![]()