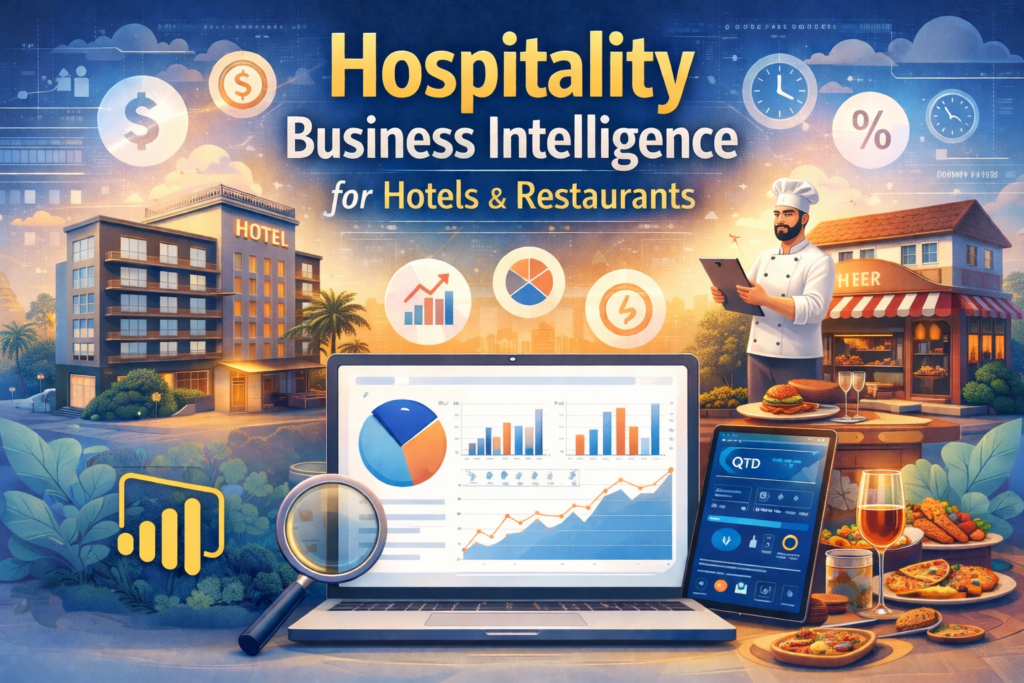
Hospitality Business Intelligence connects operational and financial data into one structured reporting environment, giving leadership clear visibility over revenue, margins, labour cost, and demand trends in real time.
As a Business Intelligence consultancy, we have delivered 1000+ custom BI solutions for hotels and restaurant groups across single-site operators and multi-property portfolios. Our team has built dashboards covering revenue management, labour cost control, discount tracking, delivery profitability, and marketing performance.
In this article, we explain what Hospitality Business Intelligence is, outline its core features, and share practical hotel and restaurant case studies. We also cover the benefits, implementation approach, pricing considerations, and the tools most commonly used to build scalable BI solutions in the hospitality sector.
Hospitality Business Intelligence (BI) is a structured approach to collecting, consolidating, and analysing data across hotels and restaurants to improve performance. It brings together operational, financial, sales, marketing, and labour data into one structured view so leadership can manage performance in real time.
In most hospitality businesses, data sits in multiple systems such as accounting tools, delivery platforms, and marketing channels. Without BI, teams spend hours exporting spreadsheets, manually combining reports, and reacting to issues after they’ve already impacted revenue or margins.
A strong BI solution in hospitality typically covers three core areas:
When these insights are combined into a single system, management moves from reactive reporting to proactive control. Revenue strategies become more efficient, staffing becomes aligned with demand, and marketing spend becomes measurable.
A strong Hospitality BI solution is not just a dashboard. It is a structured system that connects data, automates reporting, and supports operational and commercial decisions across the business. The most effective solutions share several core capabilities.
1. Centralised Data
The foundation of any BI system is data consolidation. A BI platform pulls data from all data sources and standardises definitions across the organisation. This creates a single source of truth where revenue, labour cost, covers, and margins mean the same thing across every site, brand, and report. A unified data source also fosters trust and cohesion across commercial and operations teams, enhancing the guest experience.
2. Real-Time Dashboards
Instead of waiting for weekly or monthly reports, managers can access live performance dashboards. General managers can instantly see revenue, occupancy, labour cost percentage, discount impact, and margin performance in one place.
For multi-site operators, this also enables portfolio-level visibility. Leadership can compare performance across regions, brands, or restaurant segments and identify outliers quickly.
3. Automated Reporting
Manual report preparation consumes significant management time in hospitality. A core feature of BI is automated report generation and distribution. Custom reporting enables deep segmentation analysis and helps uncover hidden revenue opportunities by allowing users to create bespoke dashboards and tailored reports.
Daily summaries, P&L reports, pacing reports, and site-level performance updates can be refreshed automatically and delivered to stakeholders without manual intervention. This reduces administrative workload and ensures consistent reporting standards.
4. Operational Drill-Down
Effective BI tools allow users to move beyond top-line numbers. If revenue declines, managers can drill down to see whether the issue is driven by a specific outlet, channel, menu category, or time period.
This depth of analysis connects high-level KPIs with operational detail, making it easier to identify the root cause of performance changes.
5. Forecasting and Budget Monitoring
Hospitality BI is not limited to historical reporting. It supports forecasting and budget tracking by comparing actual performance against targets in real time. The use of machine learning and AI enables predictive analytics, demand forecasting, and transforms raw data into actionable summaries for better decision-making.
Managers can monitor variances throughout the month rather than discovering issues at month-end. This enables faster corrective action in pricing, staffing, or marketing spend.
6. Labour and Cost Intelligence
Labour is one of the largest controllable costs in hospitality. A robust BI system integrates staffing data with revenue performance to monitor labour cost percentage, productivity, and shift efficiency. BI tools also help streamline operations by optimizing staffing levels and improving overall operational efficiency.
Additionally, analyzing available room inventory is crucial for calculating performance metrics such as RevPAR, TRevPAR, and for effective total revenue management. BI tools support the analysis of total guest spend across all revenue streams, including F&B, spas, and meetings, to maximize profitability.
In summary, hospitality business intelligence empowers organizations with real-time insights, custom reporting, and advanced analytics. Key strategies in hospitality BI include using AI for predictive analytics, benchmarking against competitors, optimizing marketing, and streamlining operations.
An Australian hotel chain was storing operational data in RMS Cloud but relied on manual exports and fragmented reports. Leadership lacked a single view of financial performance across rooms, food, beverage, and commissions.
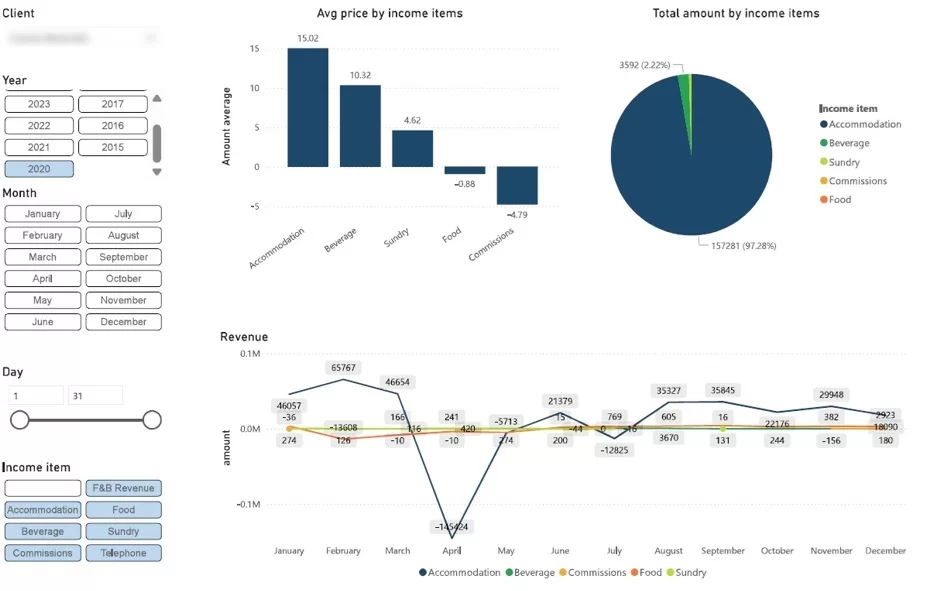
Our BI experts built a dashboard that provides a high-level view of revenue, average price by item, and occupancy levels. Revenue is broken down by income stream, including accommodation, food, beverage, and commissions.
It also visualises monthly performance trends and average income by category, allowing executives to see which revenue streams drive profitability. Interactive filters allow analysis by year, month, and income type.
Executives can instantly see which parts of the business are performing well and which require attention. The hotel chain moved from reactive reporting to proactive revenue management. Leadership now makes faster pricing, staffing, and investment decisions based on real-time performance data.
The hotel management team struggled to get a clear view of booking performance and pricing trends across the year. It was difficult to track booking status changes, compare year-over-year performance, or evaluate whether pricing decisions were aligned with demand patterns.
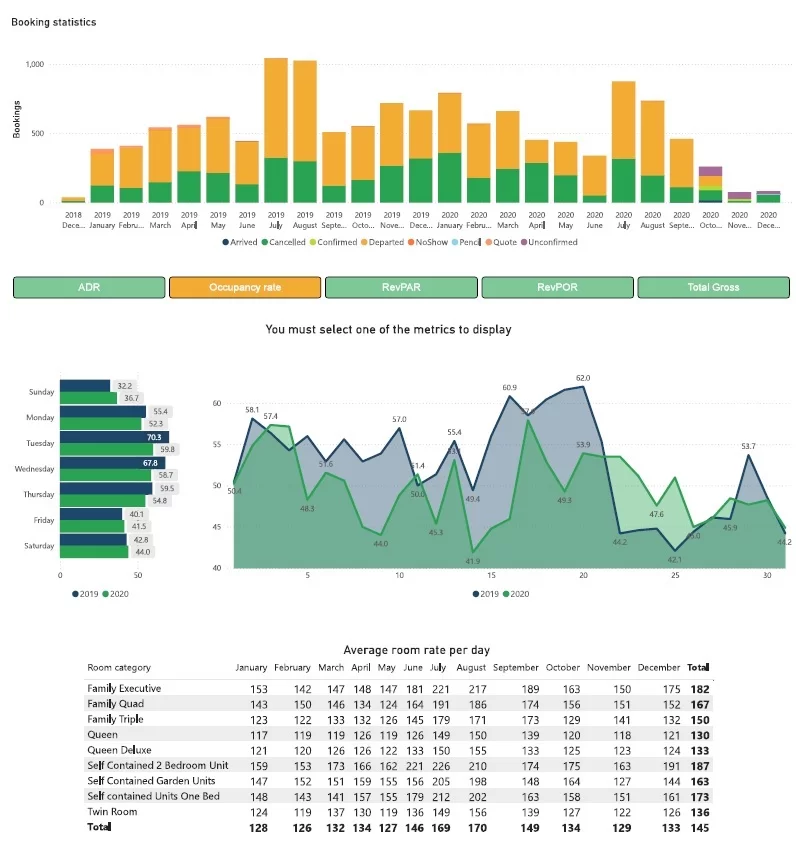
Our data visualisation specialists built a Booking Performance Dashboard that centralised booking activity and revenue metrics into one structured view. The solution allows users to select core KPIs such as Average Daily Rate (ADR), Occupancy Rate, RevPAR, RevPOR, and Total Gross, and instantly update all visuals across the page.
The dashboard shows total monthly bookings broken down by status, including arrived, cancelled, confirmed, no-show, and unconfirmed. It also enables analysis of selected metrics by day of the week with year-over-year comparison, highlighting behavioural trends and seasonal shifts. Finally, it gives full visibility into pricing fluctuations throughout the year.
This helps management identify demand patterns, cancellation risks, and performance gaps early. By comparing metrics across weekdays and years, the team can optimise pricing strategies and promotional timing. The room category analysis supports smarter revenue management decisions, ensuring rate adjustments are aligned with occupancy trends and market demand.
Restaurant managers were waiting several days to receive weekly sales reports. By the time numbers were reviewed, underperformance had already impacted margins, and reacting midweek was nearly impossible.
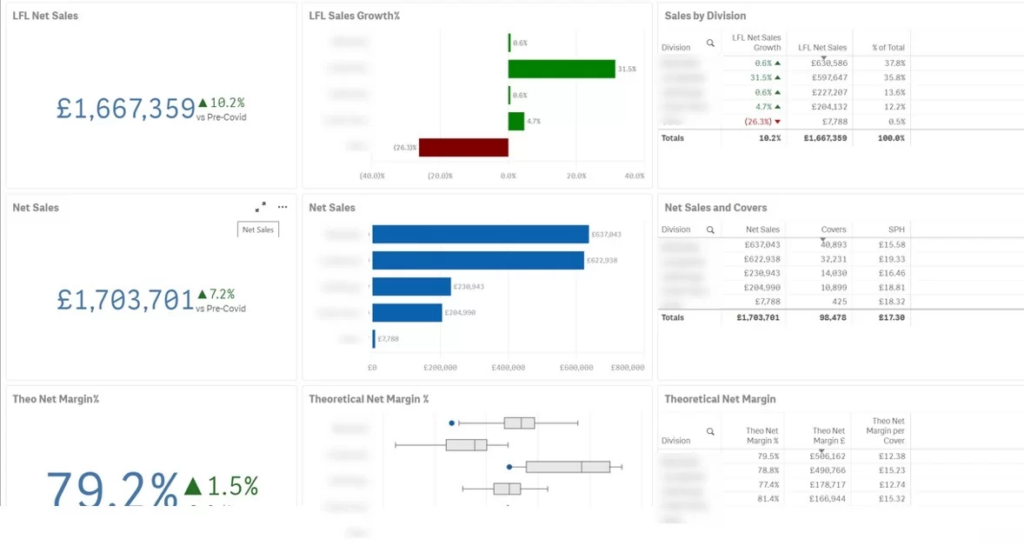
Our data analysts built a Sales Overview Dashboard that centralised sales, margin, covers, and spend-per-head metrics into one executive snapshot. The dashboard consolidates data across restaurant brands and refreshes automatically, giving managers near real-time visibility.
The dashboard shows total sales, gross margin, number of covers, and spend per head, broken down by brand and time period. Managers can quickly compare performance across locations and identify trends that may not be visible in isolated reports.
This enables faster operational decisions during the week instead of after it ends. Managers can spot declining margins, lower footfall, or reduced spend per guest early and take corrective action before issues escalate. The result is tighter cost control, stronger performance consistency, and improved profitability across brands.
The hotel’s restaurant management team wanted to analyse whether they booked the right number of staff for their shifts to remain profitable. They suspected inefficiencies in shift planning but lacked a clear view of staff cost as a percentage of revenue for breakfast, coffee, lunch, and dinner.
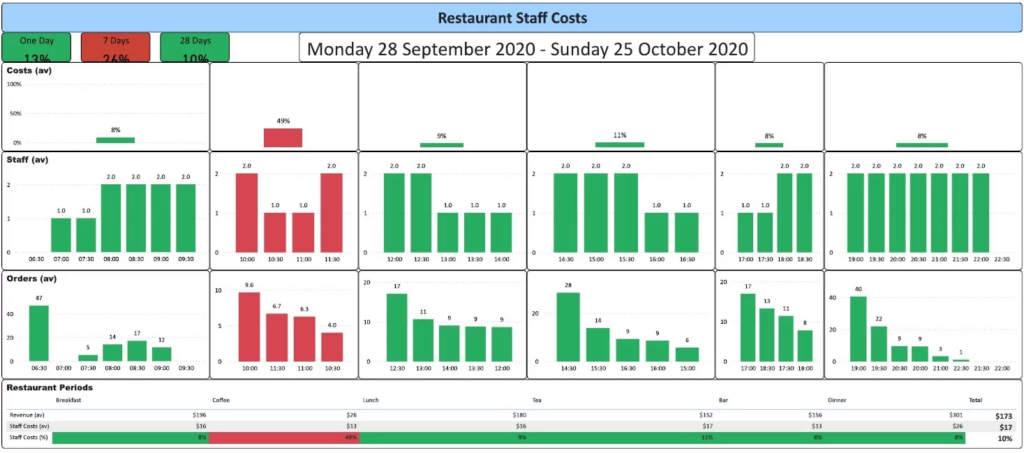
Our Power BI specialists built a Staff Cost Analysis Dashboard that combined revenue, staff allocation, and order volume into one structured view. The dashboard analyses staff cost as a percentage of revenue by service period and breaks performance down by hour to assess workforce efficiency.
The dashboard shows revenue, staff costs, and staff cost percentage across breakfast, coffee, lunch, tea, bar, and dinner. It also compares the average number of staff working each hour against the average number of orders processed during the same period.
This analysis revealed that coffee service had the highest staff cost percentage due to low ticket size and overstaffing during certain hours. By identifying periods where two employees were assigned unnecessarily, management was able to optimise shift planning. The result was better alignment between staffing levels and demand, improved labour cost control, and stronger overall profitability.
The restaurant group needed better control over discounting across locations. While discounts were used to drive traffic, management lacked visibility into how much each site was giving away and whether promotions were eroding margins.
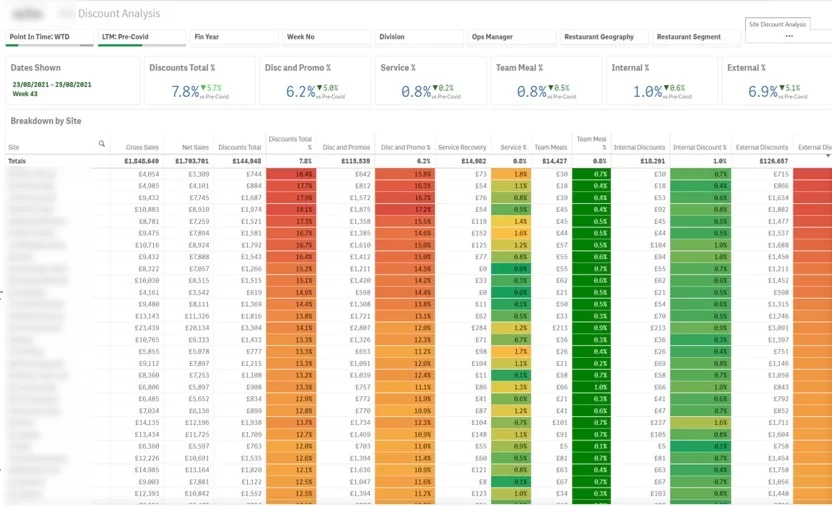
Our team built a Site Discount Analysis Dashboard that tracks total discount value by restaurant and breaks it down by discount type. The dashboard centralises discount data across the chain and highlights variations between sites.
Managers can quickly see which sites rely heavily on discounting and what proportion of discounts come from staff benefits versus customer incentives.
This helps leadership identify locations where discounting may be masking weak performance. By analysing discount composition at site level, the group can protect margins, standardise promotional strategies, and ensure discounts are used strategically rather than as a reactive sales tool.
The restaurant group wanted to understand which sales channels were truly driving profitable growth. While total revenue was tracked centrally, there was limited visibility into which channels relied heavily on discounts and which generated full-margin sales.
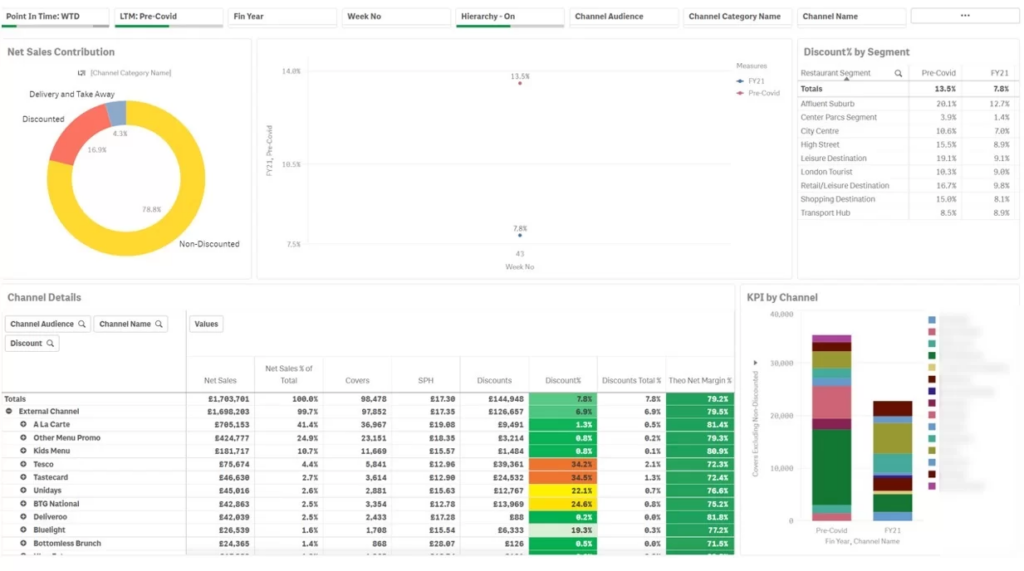
Our business intelligence consultants built a Channel Overview Dashboard that breaks down net sales contribution, covers, spend per head, discounts, and margin by channel. The dashboard compares discounted versus non-discounted sales and highlights performance differences across delivery platforms, promotions, and in-restaurant menu categories.
This analysis revealed that channels such as à la carte, kids menu, and Deliveroo generated sales without requiring heavy discounting, while channels like Unidays and Testcard were largely discount-driven. By identifying discount dependency at channel and site level, the group can protect margins, optimise promotional partnerships, and make smarter decisions about expansion and channel strategy.
The restaurant group wanted to understand how the delivery side of the business was truly performing. While delivery revenue was increasing, there was limited visibility into which brands, regions, and sites were generating profitable growth versus low-margin volume.
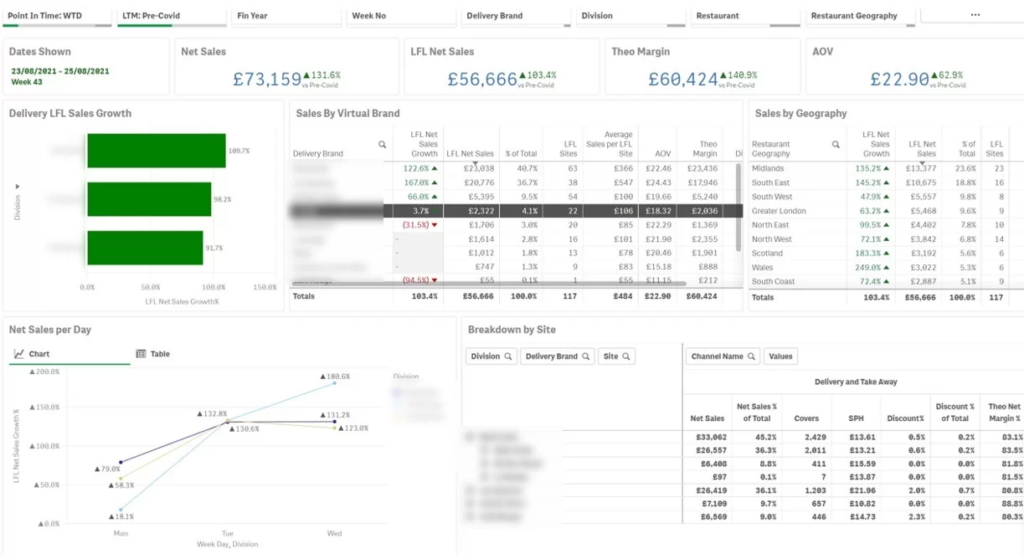
Our team built a Delivery Performance Dashboard that centralised net sales, like-for-like growth, margin, and average order value into one structured view. The dashboard breaks performance down by virtual brand, geography, division, and individual site, allowing leadership to compare growth, margin, and sales contribution across the delivery network.
This analysis revealed which delivery brands were driving strong margins alongside growth and which locations required attention. By identifying profitability patterns at brand and site level, the group can refine pricing, optimise platform partnerships, and make data-driven expansion decisions across their delivery operations.
The leadership team needed better visibility into how marketing investment was translating into platform sales. While gross sales were tracked monthly, there was limited clarity on spend volatility, return on ad spend, and whether promotional activity was driving sustainable growth or margin erosion.
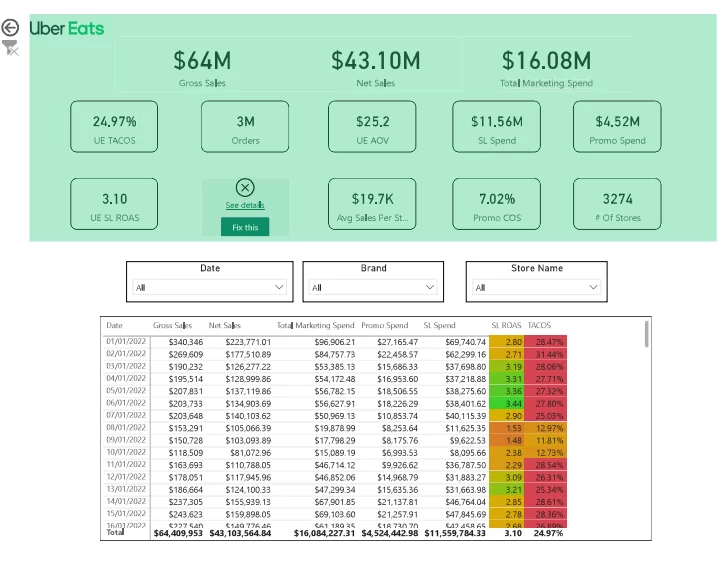
Our consultants built a Sales and Marketing Performance Dashboard that visualises revenue, net sales, marketing spend, promotional spend, and advertising efficiency metrics over a 13-month period. The dashboard centralises KPIs such as ROAS, TACOS, average order value, orders, and store count into one structured view.
It highlights monthly fluctuations in marketing spend, tracks changes in sales performance, and shows how efficiency metrics evolve over time. By comparing spend against sales trends, leadership can quickly identify periods of declining performance or inefficient investment.
This analysis helps the team control marketing costs, improve return on advertising, and react quickly to declining sales trends. Instead of reviewing isolated reports, management can assess platform health, optimise budget allocation, and protect margins with a clear, data-driven view of marketing performance.
The key benefits of hospitality business intelligence include increasing revenue, optimizing revenue, streamlining operations, and enabling data driven decisions that empower hotels to stay competitive and efficient.
Implementing Hospitality Business Intelligence delivers clear, measurable benefits across revenue, cost control, and operational management.
BI tools help hotels respond quickly to market shifts, optimize rates across channels, and adjust promotions to remain competitive. They also enhance operational efficiency by allowing staff to focus on meaningful guest interactions while automated workflows manage routine tasks.
Choosing the right Business Intelligence tool depends on the size of your hotel or restaurant group, your data complexity, and your internal technical capabilities. When evaluating BI software for hotel BI, it is crucial to prioritize strong integration capabilities to ensure seamless data consolidation from all hotel systems. Below are the most commonly used BI platforms in hospitality, along with where they work best.
1. Power BI
Power BI is one of the most widely used BI tools in hospitality. It integrates easily with PMS systems, POS platforms, accounting software, and SQL databases, making it ideal for consolidating multi-source data. When native integrations are missing, custom Power BI connectors automate data extraction and create a single source of truth across all properties.
It is particularly strong for multi-site operators who need portfolio-level dashboards, automated reporting, and deep financial drill-down. Power BI offers high flexibility and customisation, which makes it suitable for both hotels and restaurant chains.
Best for: Multi-site hospitality groups, customised dashboards, advanced financial and operational reporting.
2. Tableau
Tableau is known for its strong visualisation capabilities and flexibility. It allows users to build interactive dashboards and explore data visually, which is helpful for revenue management and performance benchmarking.
However, it often requires more technical expertise and structured data preparation compared to Power BI.
Best for: Organisations with in-house analytics teams and complex visual analysis requirements.
3. Looker Studio
Looker is commonly used by hospitality businesses operating within the Google Cloud ecosystem. It is strong in data modelling and centralised governance, making it suitable for larger enterprises.
It works well when companies need scalable data infrastructure with strict control over metrics definitions.
Best for: Enterprise hospitality groups with strong cloud infrastructure and technical teams.
The cost of a hospitality BI solution depends on the size of the business, the number of properties, and the complexity of integrations. Most pricing structures include two components: software licensing and development. When dealing with complex data and implementing custom reporting features, development costs can increase due to the need for advanced data transformation, tailored dashboards, and granular analytics.
Software costs typically cover the BI tool itself (such as Power BI or Tableau) and any required data connectors. For small operators, licensing can range from $14 to $75 per user per month.
Development and setup costs usually represent the larger investment. This includes data integration, KPI modelling, automation setup, and dashboard design. For small to mid-sized projects, custom dashboards and custom reporting often start from $1,000+, while multi-property or complex integrations can require a larger one-time implementation budget.
Choosing the right business intelligence tool starts with knowing what you want to achieve and understanding your business objectives. The key is to start with the metrics that matter most such as revenue, labour cost percentage, occupancy, margins, and scale the solution as the business grows. A well-designed BI setup reduces manual reporting time, improves pricing and staffing decisions, and typically pays for itself through better margin control and operational efficiency.
Implementing Hospitality BI requires more than installing a dashboard tool. A structured process connects the solution to business goals, integrates it with existing systems, and drives measurable ROI.
1. Define Objectives
Start by identifying clear business priorities. The focus may include revenue optimisation, labour cost control, margin protection, or improving guest experience, but every dashboard must support real operational decisions.
Leadership teams clarify success metrics, review current reporting gaps, and map the decisions managers need to make. This approach ensures the BI system drives action rather than producing attractive but unused reports.
2. Data Assessment
Review the full data landscape, including PMS, POS, RMS, accounting systems, workforce management tools, CRM platforms, and delivery apps.
Evaluate data quality, integration complexity, refresh frequency, and access requirements. Design a clean data architecture that consolidates information into a single, reliable source of truth with automated refresh schedules.
3. Solution Development & Integration
Build dashboards around clearly defined KPIs and decision workflows, not generic templates. Develop secure data connections, configure automated refreshes, and validate every metric against financial and operational reports. Transform raw data from various systems into actionable insights that drive better hotel operations and profitability.
Apply a step-by-step development process so stakeholders can review early versions and refine the solution before full rollout. Effective business intelligence relies on unifying data from fragmented systems to drive dynamic pricing and operational efficiency. Choose BI tools with intuitive navigation, clear visualizations, and interactive reports so users across departments can easily explore and act on insights.
4. Training & Optimisation
Introduce the solution without disrupting daily operations. Equip managers with the knowledge to interpret KPIs and apply insights to pricing, staffing, and marketing decisions.
Monitor refresh performance, data accuracy, and usage levels continuously. Expand the system over time to include forecasting, budget tracking, and deeper performance analysis as business needs evolve.
Hospitality businesses are placing greater emphasis on connected data and faster decision-making. Leaders expect clear visibility across revenue, labour, costs, and marketing without waiting for end-of-week reports or manual reconciliations. AI and machine learning are increasingly used to analyze complex data, identify emerging trends, and automate reporting, enabling hospitality businesses to quickly adapt to market changes.
Integrated systems are becoming the norm. Operators increasingly combine PMS, POS, accounting, workforce, and delivery data into one reporting layer to eliminate inconsistencies and reduce reliance on spreadsheets. A unified data environment makes it easier to compare properties, standardise KPIs, and maintain control across multi-site portfolios.
Automation is also reshaping internal processes. Scheduled reports, automated validations, and digital reconciliations reduce administrative workload and improve accuracy. Dynamic pricing and event impact analytics leverage forward-looking data to proactively adjust rates months before traditional booking patterns emerge, helping businesses stay ahead of demand shifts. This shift allows managers to focus on pricing strategy, cost management, and guest experience rather than report preparation.
At the same time, decision-making is moving closer to the property level. General managers and restaurant leaders expect direct access to dashboards that show margins, labour efficiency, occupancy trends, and discount impact. Analyzing feedback and social media trends helps identify operational pain points and respond to emerging trends in guest expectations. Businesses that provide structured, real-time insight across all sites gain stronger operational control and a clear competitive advantage.
Hospitality Business Intelligence gives hotels and restaurants the structure they need to manage revenue, labour, marketing, and margins with confidence. Instead of relying on fragmented reports and manual spreadsheets, leadership gains a clear, real-time view of performance across every site.
Whether you operate a single property or manage a multi-brand portfolio, a well-designed BI system improves pricing decisions, strengthens cost control, and supports scalable growth. The right dashboards do not just display data, they support daily operational and commercial decisions.
If you are looking to centralise your hospitality data and build a reporting system tailored to your business, contact us. Our BI consultants will assess your current setup and design a solution that delivers measurable impact across your organisation.
![]()
![]()
![]()