MIS reporting sits at the core of how organisations monitor performance and make decisions. It turns raw data from across the business into structured reports that managers and executives rely on to track progress, identify issues, and take action.
As business intelligence consultants, we’ve built 1,000+ custom MIS reports and dashboards across finance, sales, operations, and HR. This experience has shown us that the value of MIS reporting comes not just from the data itself, but from how clearly it is structured, automated, and aligned with decision-making.
In this article, we’ll explain what MIS reporting is, how it works in practice, the different types of MIS reports, and how to build and improve them using modern BI tools.
MIS reporting is the process of converting business data into structured reports that support decision-making. It brings together data from multiple departments into a single, clear view so managers can quickly understand performance and take action.
An MIS report (Management Information System report) is the output of this process. It typically includes KPIs, comparisons against previous periods or budgets, variance analysis, and visual summaries, along with brief commentary explaining key changes and recommended actions.
These management reports are produced on a regular schedule – daily, weekly, or monthly – and are built using tools like Excel, Power BI, or ERP systems. The goal is consistent: deliver accurate, consolidated insights that help teams make faster, more informed decisions.
Management information reporting provides a consistent view of business performance, which is critical for both operational control and strategic planning. It ensures that decisions are based on actual data rather than assumptions, helping organisations stay aligned with their targets and respond quickly to issues.
For middle managers, MIS reports are a day-to-day management tool. They use them to track team performance, monitor KPIs, identify bottlenecks, and take corrective actions such as reallocating resources, adjusting targets, or addressing underperformance. The reports support structured decision-making as operational business intelligence tools.
For top management, MIS reporting delivers a high-level view of the entire business on a weekly or monthly basis. Executives rely on these reports to assess overall performance, compare results against budgets or forecasts, and decide on strategic priorities such as investments, cost control, or growth initiatives. This creates a clear link between daily operations and long-term business direction.
In a traditional setup, MIS reporting is largely manual and time-consuming. Data is extracted from systems like ERP, CRM, and accounting tools, then consolidated in Excel where analysts clean, structure, and calculate key metrics. Pivot tables and charts are built manually, exported into PowerPoint, and supplemented with written commentary to explain performance and recommend actions.
This process follows a clear flow: data capture in source systems, manual consolidation into spreadsheets, data cleaning and metric calculations, and finally report creation and distribution. Managers review these reports, make decisions, and the cycle repeats. While effective, this approach relies heavily on manual effort, making it slower, harder to scale, and more prone to errors.
Modern MIS reporting replaces much of this manual work with automated data pipelines and dashboards. Data is integrated directly from source systems into a central database, processed automatically, and visualised in tools like Power BI or Tableau. Reports refresh on schedule or in real time, and commentary is often replaced or supported by interactive analysis, allowing managers to explore data and act faster.
There is no universal list of MIS report types, as each organisation tailors reporting to its industry, structure, and priorities. For example, SaaS companies focus on metrics like MRR and churn, while manufacturing businesses track production output, downtime, and yield.
However, most MIS reporting falls into two broad categories. Strategic MIS supports senior leadership with high-level reports such as monthly management packs or quarterly board reports, focusing on long-term trends and performance. Operational MIS is used by middle and front-line managers for daily or weekly tracking, helping them monitor KPIs and manage ongoing activities.
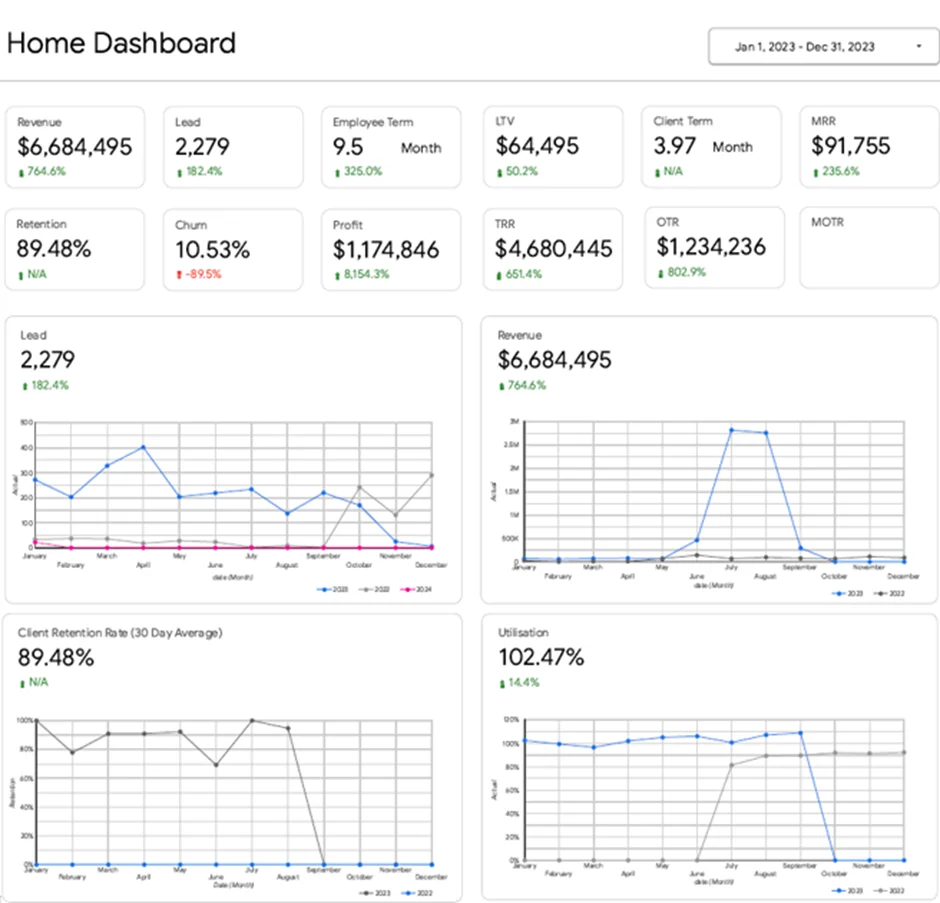
Executive MIS reports provide a high-level view of business performance for the CEO and senior leadership team. They bring together key metrics from all departments into a single report or dashboard, helping the CEO quickly assess overall performance and guide discussions with functional managers.
For example our Looker Studio consultants created executive MIS reports above for a marketing agency. These reports consolidate KPIs across finance, sales, marketing, operations, and HR into one executive summary. This includes metrics such as revenue and profit, lead generation and customer value, sales performance, client retention, and workforce utilisation. The structure is designed to highlight where attention is needed rather than present detailed analysis.
The main value comes from how the CEO uses the report in management meetings. It helps set priorities, identify underperformance early, and direct conversations with department heads. When a metric changes, the CEO can drill into the relevant area, understand the cause, and align teams on the next actions.
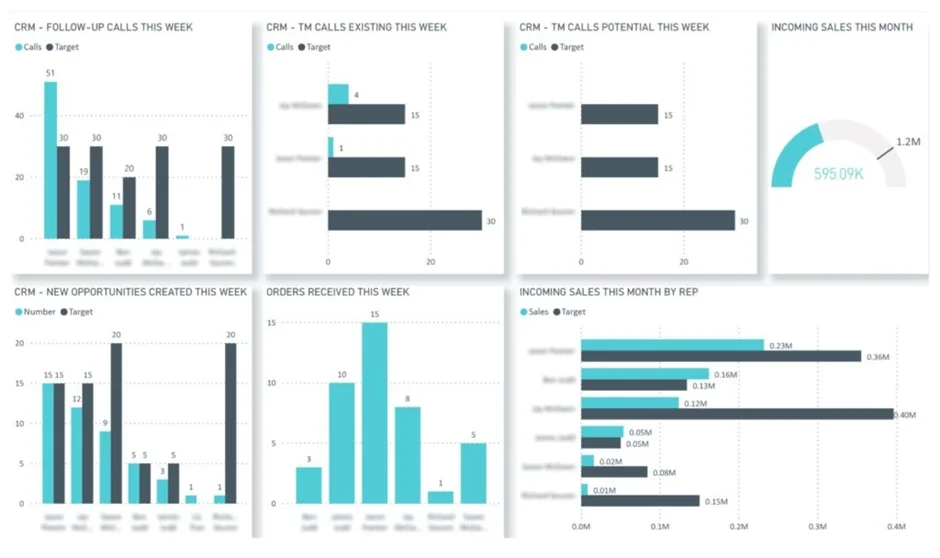
Sales MIS reports provide a structured view of sales performance against targets. They focus on pipeline activity, conversion rates, and closed deals, helping leadership understand whether revenue goals are on track and what to expect in upcoming periods.
For example, our Power BI consultants have created the report above that combines key sales KPIs such as calls made, opportunities created, win rates, and revenue performance. This report is refreshed 8 times per day to provide near-real-time visibility, allowing both executives and sales managers to monitor progress and identify gaps early.
In practice, sales MIS reports are used to support planning and decision-making across the business. Leaders use them to forecast revenue, assess pipeline health, and align sales activity with operational capacity. When performance drops below target, the report highlights the issue immediately, enabling teams to take corrective action before it impacts revenue.
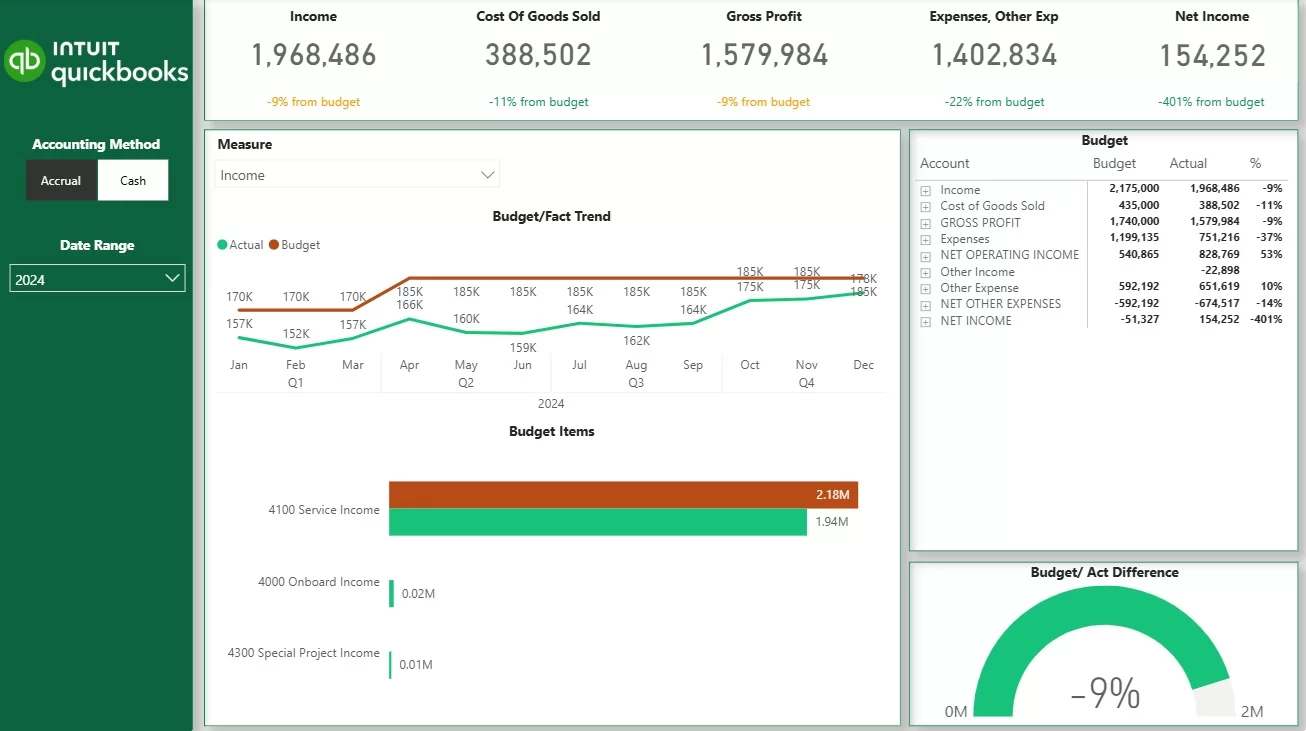
Finance MIS reports provide a structured view of a company’s financial performance and position. They help management track whether the business is meeting its financial targets and identify gaps between planned and actual results.
A common use case for our financial analytics consultants is a budget vs actual report, which compares real performance against targets set at the start of the year or quarter. These reports highlight variances in revenue and expenses, using simple visuals such as charts or tables to show where performance is above or below expectations.
Finance MIS reports are primarily used by finance teams, CFOs, and senior leadership. Finance managers use them to monitor budgets and control costs, while executives rely on them to assess profitability, manage cash flow, and guide investment decisions. This ensures financial decisions are based on clear, accurate, and up-to-date data.
In addition to budget tracking, finance MIS reporting typically includes core financial statements such as Profit & Loss (P&L), Balance Sheet, Cash Flow, and accounts receivable analysis. Together, these reports give leadership a complete view of profitability, financial stability, and cash position, supporting both operational control and strategic planning.
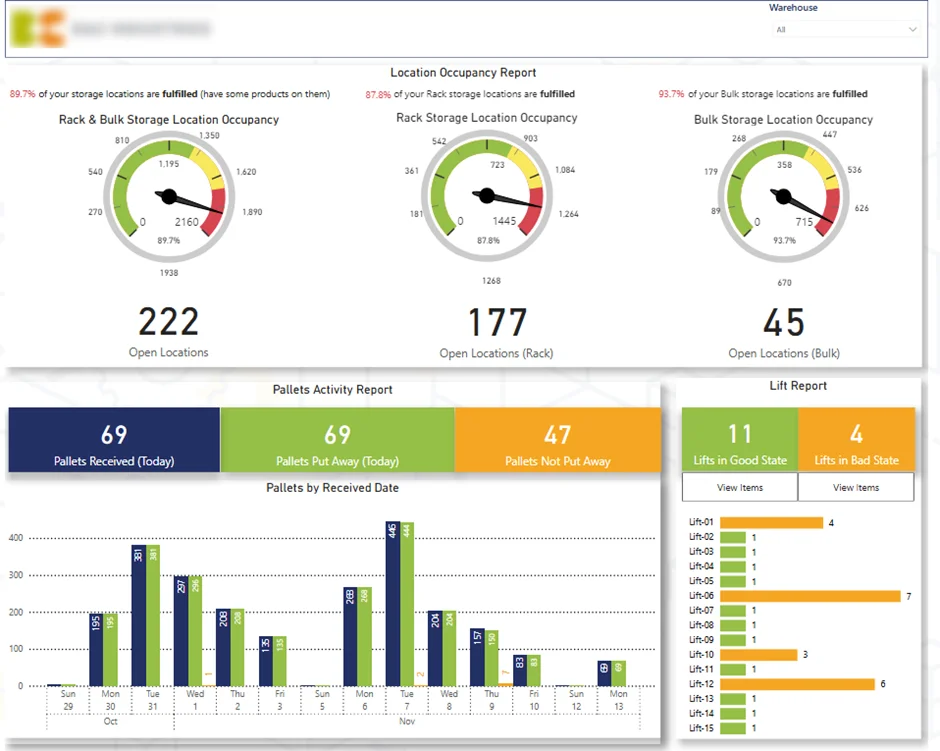
Supply chain MIS reports provide a structured view of operational performance across logistics, warehousing, and inventory management. They help organisations monitor how efficiently goods move through the supply chain and identify bottlenecks that impact delivery speed and cost.
For example our data visualization consultants created a warehouse operations report above, which tracks inbound deliveries, storage capacity, and order fulfilment activity. These reports include metrics such as available vs occupied storage locations, pallets received and put away, and items awaiting processing. Visualisations highlight where delays occur, helping the warehouse teams prioritise tasks and maintain smooth warehouse operations.
In addition to warehouse reporting, supply chain MIS reports often cover inventory levels, order fulfilment rates, delivery performance, and supplier reliability. Together, these reports provide end-to-end visibility of the supply chain, supporting better planning, capacity management, and operational efficiency.
Supply chain MIS reports are primarily used by operations managers, logistics teams, and senior leadership. Operations teams use them to manage daily workflows, allocate resources, and resolve delays, while executives rely on them to monitor efficiency, control costs, and ensure service levels are met. This enables faster decisions that keep the supply chain running reliably and at scale.
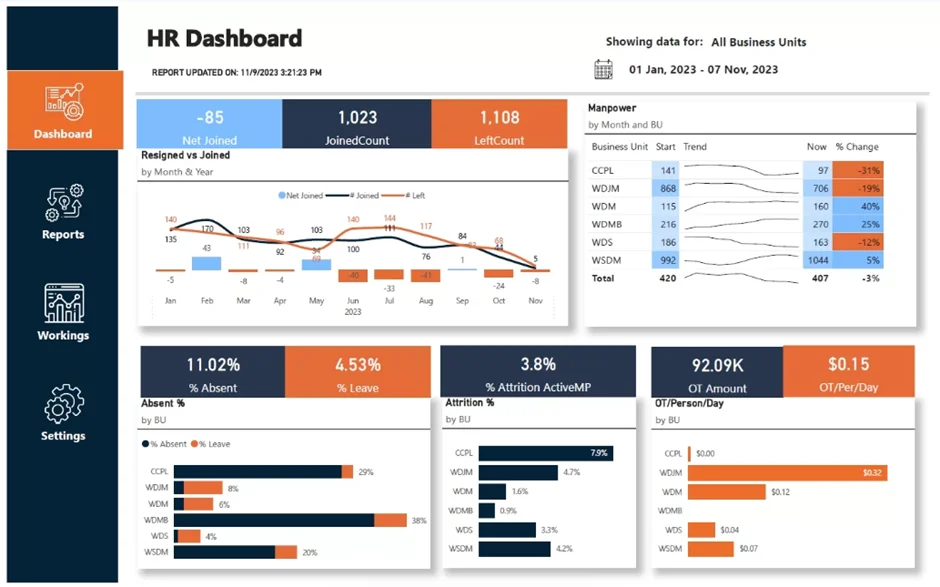
HR MIS reports provide a structured view of workforce performance, helping organisations manage hiring, retention, and employee productivity. They focus on key metrics that reflect workforce stability and capacity, ensuring the business has the right people in the right roles.
For example, our dashboard consultants created the HR report above, which tracks new joiners, resignations, and the overall attrition rate. These reports often break down headcount changes by department or business unit and highlight areas where employees are leaving without being replaced. Additional analysis may include overtime levels, helping identify where attrition is increasing workload pressure on existing teams.
In addition to attrition tracking, HR MIS reports often cover recruitment performance, headcount trends, payroll costs, and employee engagement metrics. Together, these reports provide a complete view of workforce dynamics, supporting better hiring plans and resource allocation.
HR MIS reports are primarily used by HR teams, operations managers, and senior leadership. HR teams use them to monitor workforce trends and address retention issues, while executives rely on them to ensure the organisation has enough capacity to meet business demand. This helps prevent understaffing, reduce turnover risks, and maintain stable operations. Top of FormBottom of Form
Based on our experience delivering 1,000+ MIS reports and dashboards for clients, the difference between a report that gets ignored and one that drives decisions comes down to structure, automation, and clarity. Our data analytics implementation approach focuses on building MIS reports in BI tools like Power BI, ensuring they are scalable, accurate, and easy to use.
Every MIS report starts with a clear purpose. We define the exact decision the report should support and who will use it, whether it’s a CEO reviewing performance or a manager tracking daily KPIs.
This step determines the level of detail, the objectives and key results included, and how frequently the report should be refreshed. In Power BI, this directly influences how dashboards are structured and what views are prioritised.
Next, we map and connect all relevant data sources into Power BI. These typically include ERP systems, CRMs, accounting tools, HR platforms, and marketing data sources.
We validate definitions, align metrics across systems, and build a consistent data model. This ensures that all reporting is based on a single source of truth rather than disconnected spreadsheets.
Data preparation is where most of the work happens. In Power BI, this is handled through Power Query and data modelling.
We remove duplicates, standardise formats, map categories, and create calculated fields such as margins or conversion rates. The goal is to create a clean, reliable dataset that can support automated reporting without manual fixes.
Once the data is ready, we define the core KPIs and analytical logic using DAX. This includes calculations for actual vs budget, trends over time, and performance breakdowns by region, product, or team.
The focus is always on actionable insights. Every metric is tied back to a business question, ensuring the report helps users understand what is happening and why.
Design determines whether the report gets used. We build clear, structured dashboards in Power BI with a strong focus on usability.
Each report starts with an executive summary, followed by detailed views with filters and drill-downs. Visuals are kept simple and consistent, and every chart is designed to highlight key insights rather than overwhelm the user.
The final step is automation and deployment. We set up scheduled data refreshes, automate report updates, and publish dashboards with role-based access.
Before release, we validate all numbers against source systems to ensure accuracy. Once deployed, stakeholders can access real-time or regularly updated MIS reports without manual intervention, turning reporting into a continuous and reliable process.
Automation transforms MIS reporting from a static, monthly process into a continuous, real-time decision tool. Instead of manually preparing reports in Excel once a month, automated business intelligence systems refresh data multiple times per day, allowing organisations to react faster and operate with up-to-date insights.
The first step is connecting data sources directly to BI tools like Power BI. Using the native and custom data integrations, data is automatically pulled from systems such as ERP, CRM, and accounting platforms like QuickBooks or Xero.
This removes the need for manual exports and ensures that reports always reflect the latest available data. Multiple systems can be combined into a single dataset, creating a unified and consistent view of the business.
Once data is extracted, it is transformed automatically using tools like Power Query. This includes cleaning, structuring, and enriching the data – such as standardising formats, mapping categories, and calculating key metrics.
These transformation steps are defined once and then applied automatically every time the data refreshes. This eliminates repetitive manual work and ensures consistency across reporting cycles.
With clean data in place, it’s now time to build custom business intelligence dashboards. These dashboards will be used to calculate your KPIs and visualise the results in an easy-to-digest format.
Because the underlying data updates automatically, all visuals and calculations update instantly without manual intervention. This ensures that every stakeholder is always working with the same, up-to-date information.
The final step is scheduling an automatic data refresh. Power BI allows datasets to refresh up to 8 times per day under the standard Power BI license, and more often depending on the technical setup.
This means MIS reports are no longer static documents but live dashboards that reflect current performance. As a result, organisations can monitor changes as they happen, respond faster to issues, and make decisions based on real-time data rather than outdated reports.
Many organisations already have MIS reporting in place, but the reports are often too complex, duplicated, or rarely used in decision-making. Improving MIS reporting starts with simplifying structure, standardising logic, and introducing automation.
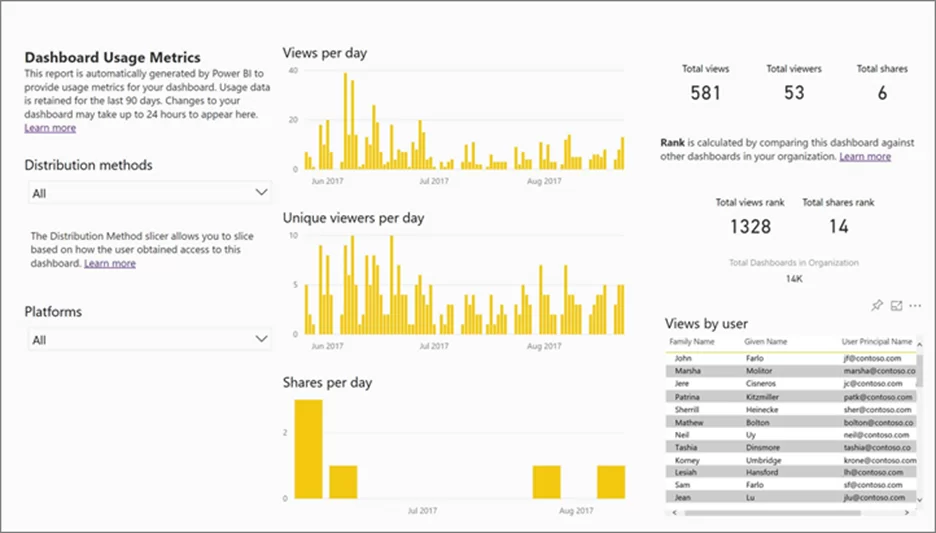
The first step is to audit existing reports. Review all recurring MIS reports, identify which ones are rarely used, and consolidate overlapping reports into a smaller set of high-impact dashboards. For example, Power BI automatically produces usage reports that can be used to identify when every user last accessed the report.
Next, standardise metric definitions across the business. Terms like “revenue,” “active customer,” or “closed case” must be consistent across departments to avoid confusion and conflicting numbers. In BI tools like Power BI, this is achieved through a centralised data model and shared calculations.
Automation also plays a key role in improving usability. Instead of sending Excel files via email, organisations can deploy role-based dashboards that provide a single source of truth. This removes version control issues and ensures everyone works from the same data.
Finally, MIS reporting should evolve. Regular reviews help remove low-value metrics and introduce new ones that reflect changing business priorities, such as new channels, operational KPIs, or ESG indicators. This keeps reporting relevant and aligned with decision-making needs.
MIS reporting is no longer just about producing reports – it’s about delivering clear, reliable insights that drive decisions across every level of the business. When built correctly, it connects data from multiple systems, highlights what matters, and enables teams to act faster with confidence.
From our experience delivering 1,000+ MIS reports, the biggest impact comes from combining strong structure with automation. This turns reporting from a manual, time-consuming task into a scalable system that supports real-time decision-making.
If you want to improve your existing MIS reports or build a fully automated reporting system in Power BI, contact us. We’ll help you design reports that are clear, actionable, and tailored to how your business actually operates.
MIS reporting is a subset of business intelligence (BI). While MIS focuses on scheduled, routine management reports with predefined structures, BI encompasses broader capabilities including self-service data exploration, advanced analytics, predictive modelling, and ad hoc querying. Think of MIS as the regular “heartbeat” reports, while BI includes the entire ecosystem of data analysis tools and practices.
Frequency depends on decision cycles and data volatility. Cash position and sales MIS often require daily updates during volatile periods. Operations and business performance metrics typically work on weekly cycles. Financial performance and profitability suit monthly reporting. Strategic KPIs and market share analysis usually follow quarterly or annual schedules. Match frequency to how quickly decisions need to be made.
Absolutely. Small firms can start with structured Excel or Google Sheets reports pulling data from basic accounting software and POS systems. Focus on 5-10 core KPIs that directly inform decisions. Free tools like Google Looker Studio (formerly Data Studio) can create visual dashboards. Only invest in paid BI tools once data volume and complexity justify the expense—typically when manual processes exceed a few hours weekly.
Effective MIS professionals need comfort with spreadsheets (Excel, Google Sheets) or BI tools (Power BI, Tableau). Understanding basic accounting principles and business function operations helps contextualize the numbers. Data cleaning, validation, and visual representation skills ensure accuracy and clarity. Perhaps most importantly, clear written communication transforms MIS data into actionable insights and recommendations that drive informed decision-making.
During shocks like the 2020-2021 pandemic, timely MIS on cash flow, receivables, orders, and supply chain health allowed management to model scenarios rapidly. Companies used weekly liquidity MIS to decide whether to cut non-essential costs by 15%, extend payment terms, or delay capital expenditures. Tracking key metrics week-by-week provided the visibility needed to protect financial health and adjust strategy as conditions evolved.
![]()
![]()
![]()