
Managerial Reporting connects financial, operational, sales, and workforce data into one structured reporting framework, giving managers clear visibility over performance, risks, and growth drivers in real time. Managerial reporting is crucial for a successful business by providing the data needed for informed business decisions. Instead of relying on fragmented spreadsheets or isolated reports, organisations use managerial reporting to align departments around measurable KPIs and data-driven decisions. Managerial reports should take a wide variety of data and come in an easily understandable format. Keeping the report scannable is important for managers who need to quickly reference key information.
As a data visualisation consultancy, we have delivered 1,000+ custom reporting and dashboard solutions across finance, HR, sales, marketing, and operations functions. Our team has built executive dashboards, P&L reports, workforce analytics tools, sales pipeline trackers, and operational performance dashboards that help organisations strengthen control, improve forecasting, and scale sustainably.
In this article, we explain what managerial reporting is, why it is important for business performance, and the key components every effective report should include. We also cover different types of managerial reports by function, outline how to create them properly, and highlight common mistakes to avoid when building reporting frameworks.
Managerial reporting refers to the process of collecting, analyzing, and presenting organizational performance data to facilitate strategic decision-making. It focuses on translating operational and financial information into structured reports that help managers understand how different parts of the organisation are performing.
The management team is the primary audience for these reports, as they rely on them for oversight and decision-making. These reports show not only what has happened, but also why it happened and what actions may be required.
Managerial reporting is usually delivered on a regular basis such as monthly, quarterly, or weekly, depending on the function and business needs.
It is important to distinguish management reports from financial reports. Financial reports, such as the balance sheet, income statement, and cash flow statements, are standardized, external documents that provide a backward-looking view of the company’s financial position and are essential for compliance and stakeholder analysis. In contrast, management reports are tailored for internal use and focus on actionable insights.
The purpose of managerial reporting is not to list activities, but to highlight performance drivers, risks, and opportunities. Effective reports separate signal from noise. They focus on trends, variances against targets, and areas that require intervention. A thoughtful, organized, and methodical approach is the best way to handle writing a management report.
Managerial reporting is essential for maintaining visibility, control, and direction across a business. It provides structured insights into financial, operational, sales, and workforce performance, allowing managers to understand what drives results. Instead of relying on assumptions, leaders make decisions based on measurable data.
Managerial reporting is important for:
By highlighting variances, trends, and performance drivers, managerial reporting supports faster and more confident decision-making. It helps managers adjust strategies, reallocate resources, and address risks before they escalate.
Managerial reporting strengthens business performance by aligning teams around clear metrics, improving accountability, and enabling structured growth. It turns data into a practical management tool that supports efficiency, profitability, and long-term sustainability.
Strong managerial reporting is not about presenting large volumes of data. It is about structuring the right information so managers can assess performance quickly and decide what action to take. Effective reports present data in a clear and meaningful way, integrating both financial and operational metrics to enhance decision-making and overall business performance. Reports focus on clarity, relevance, and forward-looking insight.
An effective managerial reporting structure should include:
When these components are combined, managerial reporting becomes more than a performance summary. It becomes a structured decision-support system that improves accountability, transparency, and strategic alignment across the organisation.
Managerial reporting is not one-size-fits-all. Different departments require different perspectives, metrics, and levels of detail to support decision-making. Executive teams focus on strategic performance, finance monitors profitability and cost control, HR oversees workforce stability, sales tracks revenue generation, and operations manage efficiency and capacity.
Below are the main types of managerial reports used across organisations, with examples of how structured dashboards support performance monitoring, transparency, and data-driven management in each function.
Executive reports give C-level leaders a single, high-level view of overall business performance. They are designed for CEOs and senior executives who need to monitor the health of every department without reviewing multiple reports. The goal is to highlight where attention is required and enable strategic decisions.
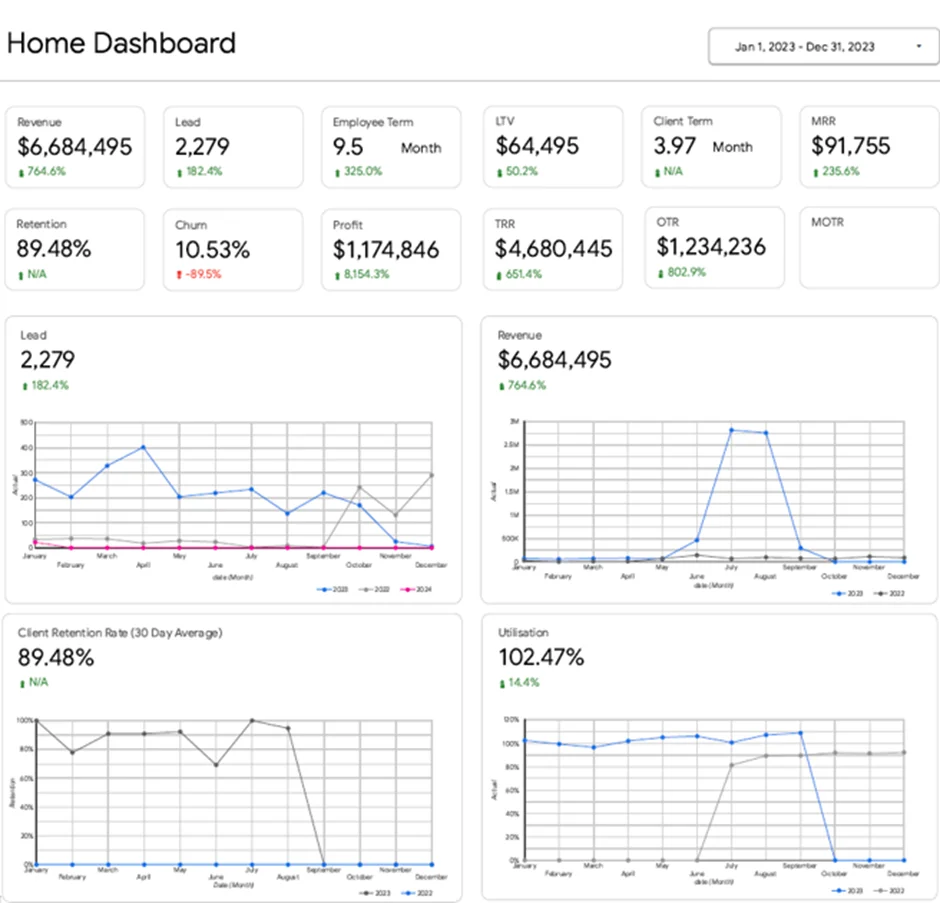
Metrics: Revenue, Profit, Number of Leads, Monthly Recurring Revenue (MRR), One-Time Revenue (OTR), Client Retention Rate, Churn Rate, Employee Utilisation, Employee Retention Term.
Our Power BI expert developed an executive dashboard that analyses overall business performance across all core functions. It highlights revenue growth, sales predictability, marketing effectiveness, client stability, and workforce capacity. Each metric is interactive and linked to a supporting departmental dashboard, enabling the CEO to drill into campaign results, client performance, or team-level analysis whenever deeper insight is required.
This structure supports a clear executive workflow. If leads decline month over month, the CEO can immediately review marketing channels and adjust budget allocation. If client retention drops, leadership can identify affected accounts and intervene early. If utilisation exceeds 100%, it signals capacity pressure and supports hiring or subcontractor decisions. The dashboard supports executive prioritisation, resource allocation, and early identification of operational risks.
Financial management reports are designed to monitor profitability, cost control, cash flow, and overall financial stability of the business. They are used by finance managers and department heads to track performance against budgets, protect margins, and ensure sustainable growth. These reports provide structured visibility into how revenue, expenses, and capital are managed across the organisation.
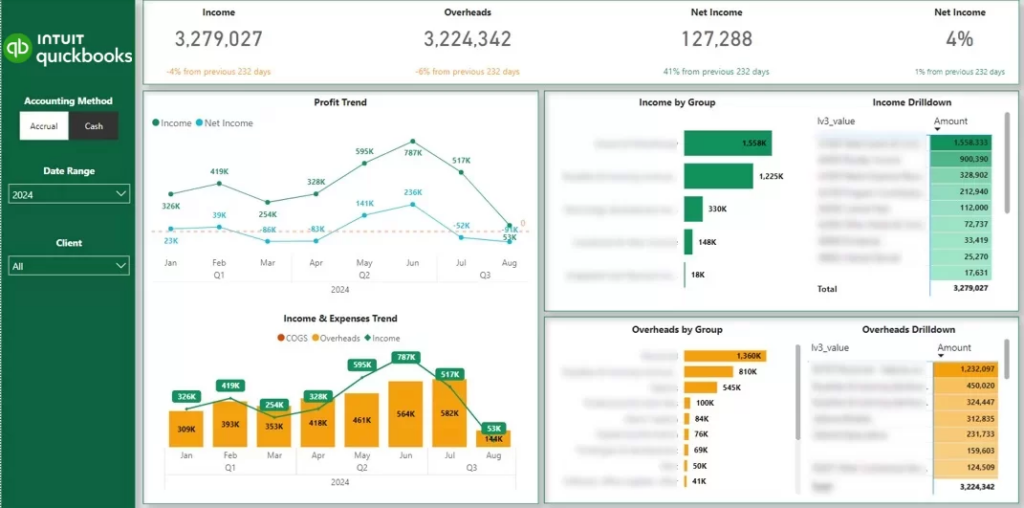
Metrics: Income, Overheads, Net Income, Profit Trend, Income Trend, Expense Trend.
Our data visualisation experts developed a financial management dashboard that analyses monthly trends in income and expenses and breaks them down by account and underlying transactions. Users can switch between accrual and cash accounting methods, filter by client, and apply class filters to review departmental performance. It clearly shows what drives revenue, where overheads are increasing, and how net income evolves over time.
The dashboard benefits the finance department by improving cost control and financial transparency. It helps managers identify unusual expense spikes, track profitability by department, and monitor whether income growth offsets rising overheads. With structured monthly analysis and transaction-level visibility, finance teams can manage budgets more accurately and support more informed financial planning.
HR management reports are designed to monitor workforce structure, staffing trends, employee performance, and retention across the organisation. They are used by HR managers and operational leaders to ensure the business has the right people, with the right skills, in the right roles. These reports provide structured visibility into workforce capacity, stability, and cost.
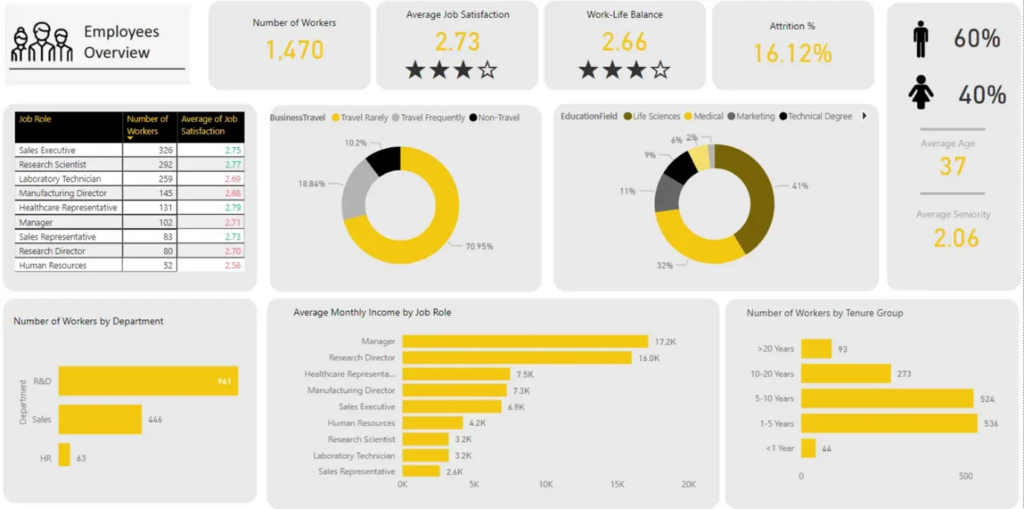
Metrics: Total Headcount, Headcount by Department, Headcount by Job Role, Gender Distribution, Average Age, Education Level, Average Monthly Income by Role, Headcount by Tenure.
Our business intelligence specialists created a dashboard that analyses workforce composition and its evolution over time. It breaks down headcount by department and job role to show how teams are structured and where staffing levels are increasing or declining. Demographic insights such as gender distribution, age, and education provide visibility into workforce diversity and profile. Salary analysis by job role highlights cost concentration areas, while tenure distribution shows how long employees remain in the organisation.
The dashboard benefits the HR department by improving workforce transparency and planning accuracy. It helps identify departments with rapid growth, roles with high cost impact, and areas where retention may require attention. By combining structural, demographic, and cost insights, it supports data-driven hiring, budgeting, and talent management decisions.
Sales and marketing managerial reports are designed to monitor revenue generation, lead performance, and campaign effectiveness. They are used by sales managers, marketing managers, and revenue leaders to track how marketing activity translates into pipeline growth and closed deals. These reports connect lead generation, funnel progression, and revenue outcomes in one structured view.
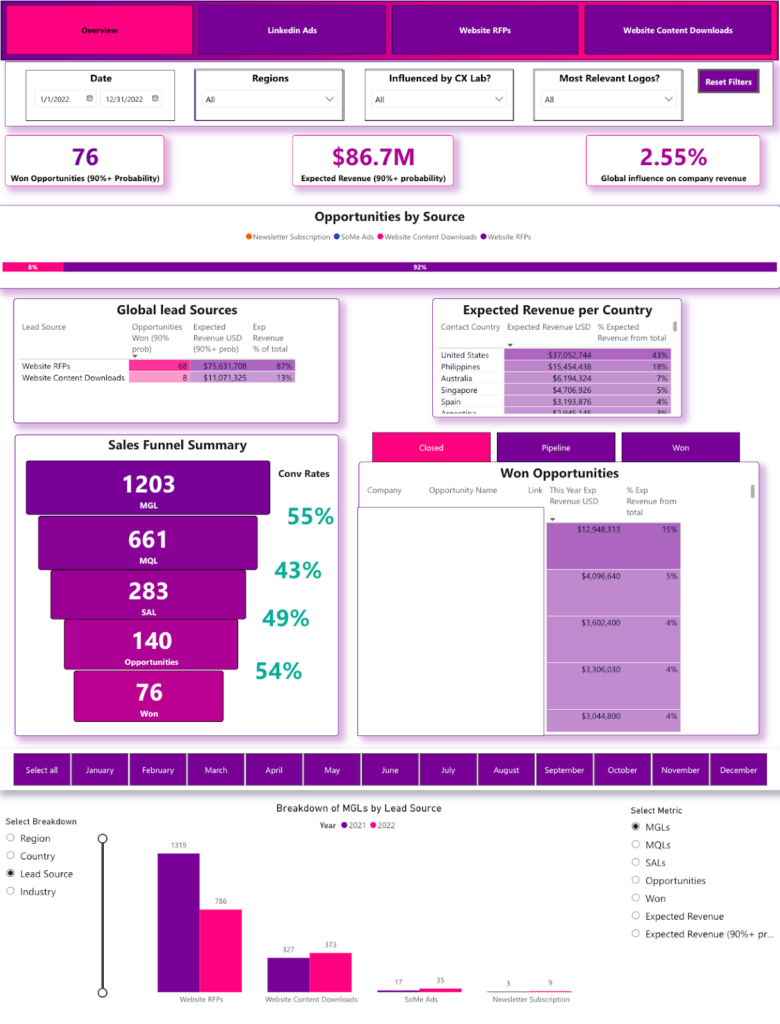
Metrics: Won Opportunities, Expected Revenue, % of Expected Revenue from Marketing, Opportunities by Lead Source, Expected Revenue by Lead Source, Leads by Funnel Stage, Conversion Rate by Stage.
Our marketing analysts built a dashboard that analyses revenue contribution at the top level and breaks it down by lead source and customer country. It shows which marketing channels generate the highest-value opportunities and how revenue is distributed geographically. The funnel section summarises the number of leads at each stage and calculates conversion rates between stages, highlighting bottlenecks in the sales process. A detailed opportunity table shows open, lost, and won deals.
The dashboard benefits sales and marketing teams by improving pipeline transparency and conversion tracking. It helps identify underperforming lead sources, prioritise high-value opportunities, and focus on stages where deals stall. By combining revenue forecasting and funnel analysis in one structured view, it strengthens pipeline management and supports more predictable revenue growth.
Operations management reports are designed to monitor process efficiency, resource utilisation, and operational stability across the business. They provide structured visibility into how day-to-day activities align with demand, capacity, and performance targets. These reports help operations teams maintain control, anticipate issues early, and ensure that workflows run smoothly without unnecessary bottlenecks or resource imbalances.
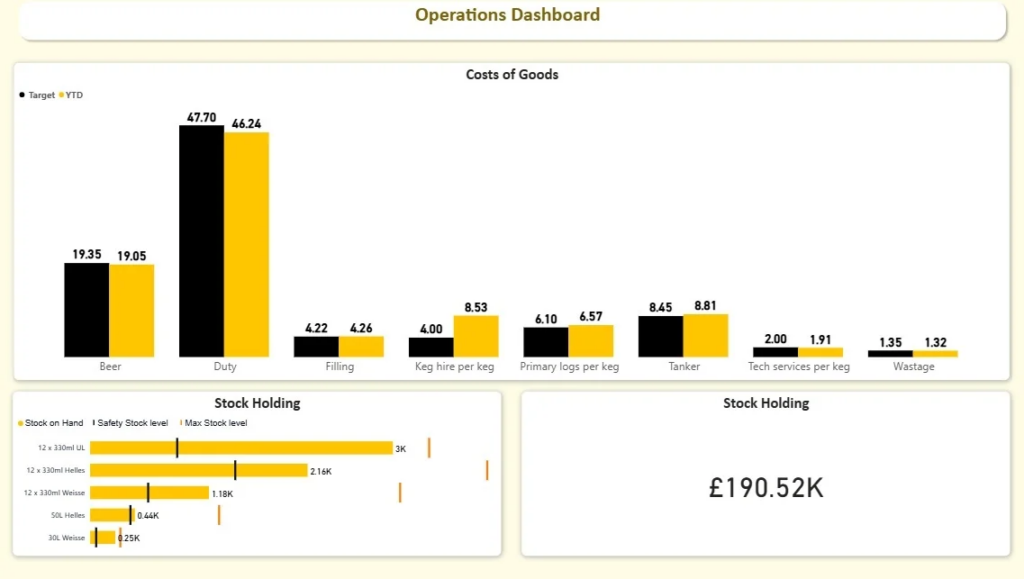
Metrics: Stock on Hand, Safety Stock Level, Max Stock Level, Replenishment Requirement by Product.
Our BI specialists built an operations management dashboard that analyses current inventory levels by product and compares them against calculated safety and maximum stock thresholds. Safety stock is determined based on historical demand patterns and supplier lead times, while maximum stock levels prevent over-ordering. The dashboard highlights products that are approaching minimum thresholds or exceeding optimal levels, enabling proactive inventory management.
The dashboard benefits operations teams by reducing stockouts and preventing excess inventory. It supports timely replenishment decisions, improves service levels, and protects cash flow by avoiding unnecessary stock accumulation. With structured, product-level visibility, operations managers can maintain stable inventory levels and improve overall supply chain efficiency.
Modern managerial reporting tools and software have revolutionized the reporting process, making it faster, more accurate, and far less reliant on manual effort. With just a few clicks, managers can create management reports that draw from a wide range of data sources, including financial systems, operational data, and customer feedback. These tools automate data collection and analysis, ensuring that reports are both timely and reliable.
Popular solutions include dashboard software, data visualization platforms, and comprehensive business intelligence systems. These platforms offer real-time data updates, customizable reports, and collaborative features that support strategic decision making across departments. By integrating operational data and financial information, managers can analyze performance trends, track KPIs, and respond to business challenges more effectively.
The use of advanced reporting tools not only improves data accuracy but also frees up valuable time for managers to focus on analysis and strategic planning, rather than manual data collection. As a result, businesses can make better decisions, faster—driving growth and maintaining a competitive edge.
The future of managerial reporting is being shaped by rapid advancements in technology, data analytics, and business intelligence. As organizations increasingly embrace data-driven decision making, managerial reporting will become even more integral to business success and growth. Artificial intelligence, machine learning, and predictive analytics are set to play a larger role, enabling managers to forecast trends, identify new opportunities, and proactively manage risks.
Cloud-based reporting tools will further enhance collaboration, automation, and real-time access to critical information, making it easier for managers to analyze data and share insights across departments. As the business landscape evolves, managerial reporting will continue to support strategic decision making, helping organizations stay ahead of the competition and achieve their long-term goals.
By staying at the forefront of these technological advancements, managers can ensure that their reporting frameworks remain agile, insightful, and essential to driving business growth and success in an increasingly data-driven world.
Creating an effective managerial report requires a structured and practical approach. The goal is not to present large amounts of data, but to provide clear insights that support performance improvement.
1. Define the Objective: Start by clarifying the purpose of the report. What business question should it answer? Which decision will it support? Align the report with specific departmental or organisational goals.
2. Select the Right KPIs: Choose a focused set of relevant performance indicators. Each department requires different metrics, so select KPIs that directly reflect the objectives being measured. Avoid overloading the report with unnecessary data.
3. Collect and Validate Data: Gather data from reliable systems such as ERP, CRM, accounting, or HR platforms. Ensure consistency and accuracy by cross-checking sources. Automated data integration improves reliability and reduces manual errors.
4. Structure the Report Clearly: Organise the report into logical sections: objectives, KPI performance, trend analysis, and key insights. Keep it concise and scannable.
5. Use Visualisation: Charts, dashboards, and summary tables make trends and anomalies easier to understand. Visual clarity improves speed of interpretation and supports faster decision-making.
6. Automate and Continuously Improve: Where possible, automate data refresh and report generation using BI tools. Regularly review the report’s structure and KPIs to ensure it remains aligned with business priorities.
Even well-intentioned managerial reporting can lose impact if it is poorly structured or overly complex. Avoiding common mistakes ensures reports remain actionable, relevant, and aligned with business objectives.
Avoiding these mistakes ensures managerial reporting remains focused, reliable, and aligned with decision-making needs. Effective reports simplify complexity, highlight what matters most, and drive meaningful action.
Managerial reporting is not just about tracking numbers. It is about creating clarity across the organisation. When structured correctly, it connects strategy with execution, aligns departments around measurable KPIs, and enables faster, more confident decision-making.
Whether you need executive dashboards, financial performance reports, HR analytics, sales pipeline visibility, or operational control, the right reporting framework turns data into a competitive advantage. It improves accountability, strengthens forecasting, and helps leaders act before small issues become major risks.
If you are ready to strengthen your managerial reporting framework, our BI consultants can help. We design and implement custom Power BI dashboards and reporting systems tailored to your business structure and decision-making needs.
Contact us to discuss how we can build a scalable managerial reporting solution for your organisation!
![]()
![]()
![]()