
Nowadays, companies of all sizes need accurate, real-time insights to make confident decisions about revenue, costs, customers, and operations. Analytics As A Service makes this possible by delivering analytics tools, infrastructure, dashboards, and ongoing support through a single, structured subscription model.
As an Analytics-as-a-Service provider, we have delivered 1,000+ dashboards to 600+ clients across finance, ecommerce, marketing, operations, and executive teams. Our experience spans everything from financial consolidation and project management reporting to big data optimization and predictive analytics. We combine automated data pipelines, cloud data warehouses, and advanced BI tools into scalable, decision-ready solutions.
In this article, we explain what Analytics As A Service is, how the business model works, its core components, and the most common use cases. We also explore the advantages companies achieve when analytics becomes a managed, scalable service rather than a one-off project.
Analytics As A Service is a model that gives businesses ongoing access to analytics tools, ready-made reporting solutions, and custom analysis delivered as a managed service. Instead of hiring a data analyst and waiting for them to build analytics solutions, companies use Analytics As A Service to access ready-made analytics solutions, infrastructure, and insights on demand.
As we’ve seen in structured analytics implementation projects, successful analytics requires more than just access to software. It involves defining objectives, preparing data, building accurate models, visualizing insights, and maintaining solutions iteratively. Analytics As A Service brings all of these elements together into one scalable, outsourced solution.
Unlike a one-off dashboard project, Analytics As A Service provides continuous support. The service typically includes data integration, maintenance, KPI development, reporting automation, and ongoing analytical input that helps leadership make better decisions over time.
For companies that lack internal data teams or want to move faster without long hiring cycles, Analytics As A Service turns analytics into a predictable, flexible capability rather than a complex internal project.
The Analytics As A Service business model is typically subscription-based. Instead of investing in an in-house data team and infrastructure, companies pay a recurring fee to access analytics tools, ready-made reporting solutions, and ongoing analytical support.
At its core, Analytics As A Service combines software access, managed infrastructure, and continuous expert input into one predictable monthly or annual cost.
Under an Analytics As A Service model, companies subscribe to pre-built analytics solutions developed in tools like Power BI or Tableau. In some cases, the subscription also includes licensing for those tools, giving clients everything they need to access dashboards and reports.
This approach reduces upfront investment and accelerates implementation. Instead of starting from scratch, businesses get immediate access to structured, validated reporting frameworks with proven KPI formulas and data models.
A key component of Analytics As A Service is flexibility.
Most subscription plans include a monthly allocation of consulting hours. These hours can be used for:
This ensures that analytics evolves with the business, without requiring a new project every time a small change is needed.
When companies require more advanced analytics, such as:
These are usually delivered as one-off custom projects.
This structure keeps the core Analytics As A Service subscription affordable while allowing scalability when deeper analytical work is required.
Our Analytics As A Service model combines proprietary technology, cloud infrastructure, and custom analytics development.
We have developed our own certified software for extracting data from platforms such as:
Our software is certified by Intuit and Zoom, meaning it has been tested for technical performance and data security.
The extracted data feeds into free, ready-made Power BI templates that already contain validated KPI formulas and reporting structures. These templates ensure accurate reporting without requiring clients to design models from scratch.
Access to this ecosystem is provided through an annual subscription ranging from $1,000 to $1,600 per year.
This forms the foundation of our Analytics As A Service offering.
As part of our Analytics As A Service model, data extracted by our software is stored in Azure SQL Server.
We:
This removes the need for clients to manage databases, cloud hosting, or backend infrastructure. The result is a fully managed analytics environment.
While our templates provide structured, ready-to-use analytics, businesses often require adjustments.
Our Power BI consultants customize dashboards, KPIs, and analysis upon request. Light customizations are often covered within subscription hours, while more complex analytical builds are charged as one-off fees.
This hybrid model allows companies to:
A well-structured Analytics As A Service model is built on four core components. Together, these elements turn raw data into reliable insights that leadership teams can use for decision-making.
Our Analytics As A Service offer includes all four components as part of a fully managed solution.
Data sources are the systems where your business data is originally stored in a structured way.
These typically include platforms such as:
Each of these systems contains valuable operational, financial, or customer data. However, they usually operate in isolation, making cross-functional analysis difficult without integration.
In an Analytics As A Service model, these structured systems become the foundation for reporting.
Data pipelines are the automated code that extracts data from your source systems.
They:
Without data pipelines, teams rely on manual exports into Excel, which creates delays and inconsistencies.
In our Analytics As A Service offering, we use proprietary, certified extraction software to automate this process. Data is pulled reliably and securely, ensuring that reporting stays accurate and up to date without manual effort.
Once extracted, the data needs a centralized location.
This is where the business intelligence data warehouse comes in.
The data warehouse:
Instead of building reports directly on live operational systems, data pipelines insert the data into a dedicated BI database. This improves performance, reliability, and scalability.
As part of our Analytics As A Service model, data is stored in Azure SQL Server. We manage the infrastructure, maintain the databases, and ensure secure and stable performance. The warehouse becomes the central reporting layer for the entire organization.
BI tools are where data is visualized and analyzed.
Common examples include:
These tools connect to the data warehouse and transform structured data into dashboards, KPI reports, and interactive analysis.
BI tools allow:
In our Analytics As A Service offer, we provide pre-built Power BI templates with validated KPI formulas and structured reporting logic. We also customize dashboards when needed, ensuring that the visual layer reflects how the business operates.
Below are the most common advantages, supported by real client outcomes.
One of the core advantages of Analytics As A Service is the automation of manual data consolidation, reporting, and dashboard refreshes. This is achieved by implementing automated data pipelines, SQL databases, and BI dashboards that eliminate repetitive manual exports and spreadsheet work.
Instead of teams spending hours stitching together reports, data flows automatically from source systems into centralized dashboards that refresh daily or in near real time.
For example, a marketing agency saved 50 hours per week through automated reporting.
Another client replaced three legacy reports and saved 30+ hours per month in consolidation and maintenance.
Analytics As A Service centralizes data into a single source of truth and delivers dashboards that update automatically. This gives leadership teams immediate visibility into performance metrics without waiting for end-of-week or month-end reports.
Real-time dashboards reduce decision cycles because executives no longer need to validate numbers across multiple systems.
One CEO reported a 40% faster turnaround on strategic decisions and reduced executive review cycles by two business days per week after implementing real-time dashboards.
Another major advantage of Analytics As A Service is improved data integrity. Automated API integrations and structured data warehouses eliminate manual entry and reduce spreadsheet-driven errors.
Data validation, centralization, and automated refresh logic ensure that every KPI is calculated consistently and reliably.
A multi-entity QuickBooks client reduced financial reporting time by 75%, eliminated manual errors, and shortened their month-end close process by several days.
Beyond operational efficiency, Analytics As A Service directly impacts revenue and profitability. By connecting financial, operational, and marketing data, companies gain visibility into margins, customer behaviour, and cost drivers.
This enables proactive optimization rather than reactive reporting.
A medical device company increased service revenue by 20% after using Power BI reports to monitor equipment utilization trends and engage customers proactively.
Hiring an internal BI developer, data engineer, and analyst is expensive. Analytics As A Service provides access to all three capabilities under one subscription without fixed salary overhead.
Infrastructure, automation, reporting logic, and ongoing support are managed externally, reducing both recruitment risk and ongoing maintenance costs.
One CFO reported saving the cost of a full-time business analyst position after implementing automated Power BI reports.
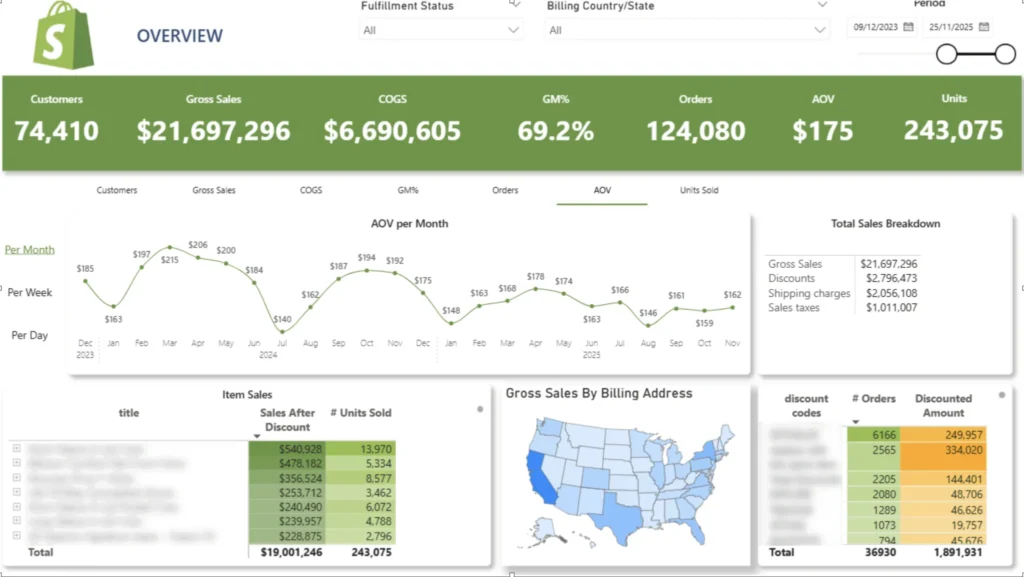
E-commerce Analytics As A Service gives online retailers a fully managed analytics setup that connects platforms like Shopify with BI tools such as Power BI. Instead of relying only on Shopify’s default reports, businesses get automated data extraction, structured KPI dashboards, and ongoing analytical support. The result is a clear, centralized view of revenue, customers, products, and profitability.
The analysis typically covers sales performance, AOV, discounts, COGS, and units sold over time. It also breaks down customer behaviour, including new vs. returning customers, reorder rates, customer lifetime value growth, average time between purchases, and product pairs frequently bought together. Order time analysis shows which hours and weekdays drive the most revenue, helping teams optimise promotions and ad scheduling.
For example, we built a custom Shopify analytics dashboard in Power BI with four dashboards: Sales, Order Time, Customer, and Product analytics. One ecommerce client used LTV and reorder analysis to shift marketing spend toward higher-value regions and design targeted reactivation campaigns. Another used product pair insights to create bundles that increased average order value and improved stock planning.
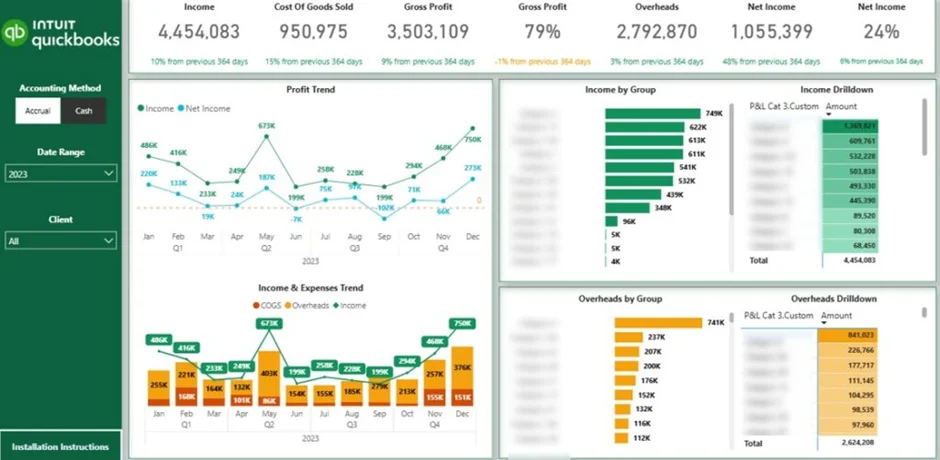
Financial Analytics As A Service provides finance teams with a fully managed reporting environment that connects their accounting systems to a central data warehouse and BI dashboards. Instead of relying on spreadsheets and manual consolidation, financial data flows automatically into structured reports. This gives leadership real-time visibility into performance across entities, departments, and time periods.
The analysis typically covers profit and loss, balance sheet, cash flow, receivables, revenue trends, and entity-level comparisons. It also includes automated consolidation, KPI tracking, drill-down capability, and workflow automation such as invoice follow-ups or financial close monitoring. Dashboards refresh daily and serve as a single source of truth for executives and operational leaders.
For example, one multi-entity company we worked with reduced financial reporting time by 75%, eliminated manual consolidation errors, and shortened its month-end close process by several days after implementing automated dashboards.
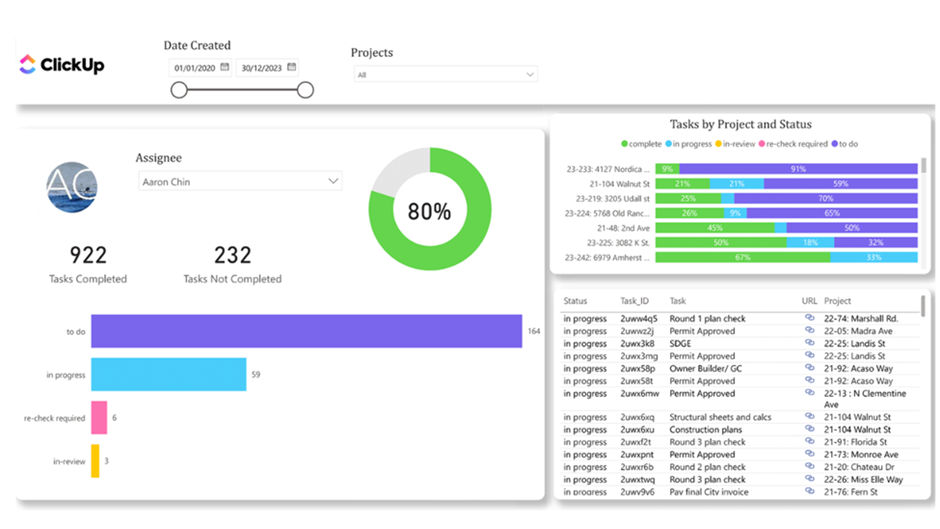
Project Management Analytics As A Service provides project managers and operations leaders with a structured reporting layer on top of tools like ClickUp and other task management systems. Instead of reviewing individual task boards manually, data is extracted automatically into a central database and visualized in Power BI dashboards. This gives teams real-time visibility into task status, workload distribution, and overall project progress.
The analysis typically includes tasks created each month, completed vs. outstanding tasks, and time spent by employee and by project. Dashboards break down tasks by status, highlight blocked items, and show completion trends over time. Managers can filter by team member to evaluate individual performance, compare output across the team, and identify projects that require immediate attention.
For example, we built a Task Status Dashboard that allows project managers to monitor completion rates month by month and drill down into individual tasks directly from the report. Teams use it to identify bottlenecks, ensure activity is logged correctly, and balance workload across employees.
Big Data Analytics As A Service enables organizations to analyze extremely large and complex datasets without building an internal data engineering team. This typically includes tens of millions of records from ERP systems, financial platforms, operational tools, or customer databases. Instead of relying on slow reports or fragmented systems, companies get scalable cloud infrastructure, automated data pipelines, and optimized BI dashboards delivered as a managed service.
The setup includes automated API extractions, structured data warehousing in platforms such as Azure SQL or BigQuery, and carefully designed data models built for performance. Queries are optimised, aggregations are pre-structured, and refresh logic is engineered to handle high volumes efficiently. Dashboards then provide real-time visibility into revenue, cash flow, operational KPIs, utilisation metrics, and cross-department performance without performance bottlenecks.
For example, in our project with Neterra, the client’s database contained dozens of millions of rows, and reports had to be significantly optimized for loading speed. We redesigned the data model and reporting layer to ensure high performance across finance, sales, procurement, and operations dashboards. The result was fast, automated Power BI reporting that helped to discover a 50,000 EUR cost-saving opportunity and helped unlock 10-20k EUR in monthly recurring revenue, all within a scalable Big Data Analytics As A Service environment
Predictive Analytics As A Service helps organizations move beyond historical reporting and start forecasting future outcomes. Instead of only analyzing what has already happened, businesses use statistical models and machine learning techniques to predict revenue trends, cash flow, customer churn, demand patterns, and operational risks. Delivered as a managed service, it removes the need to hire in-house data scientists or build complex modelling infrastructure.
The solution typically combines historical data stored in a central warehouse with forecasting models built in Python, SQL, or integrated BI tools. These models can project sales growth, estimate future cash positions, predict customer lifetime value, identify churn risk, or forecast inventory demand. Dashboards then visualize projected scenarios, confidence ranges, and trend lines so leadership teams can plan proactively rather than reactively.
For example, predictive revenue models can help finance teams forecast monthly performance based on historical seasonality and pipeline trends. Demand forecasting models can support inventory planning by identifying products likely to face stockouts or overstocking. As part of our Analytics As A Service model, we build, maintain, and refine these predictive models over time, ensuring they adapt as new data becomes available and business conditions change.
Analytics As A Service turns data into a structured, scalable capability rather than a one-off dashboard project. It combines automated data pipelines, cloud infrastructure, BI tools, and ongoing analytical support into one managed solution. The result is faster decisions, improved accuracy, and reporting that evolves with your business.
If you’re looking to centralize your data, automate reporting, and build dashboards that truly support decision-making, contact us. We’ll help you design an Analytics As A Service setup tailored to your systems, goals, and growth plans.
![]()
![]()
![]()