
Automated financial reporting allows businesses to generate accurate, real-time financial insights without manual spreadsheet work. Instead of exporting data, updating formulas, and reconciling multiple files every month, companies can rely on structured systems that refresh automatically and deliver consistent reports.
Over the past decade, cloud accounting systems, ERPs, and business intelligence tools have enabled the full automation of financial reporting processes. When implemented correctly, automation transforms finance from a reporting function into a strategic decision-support engine.
In this article, we will break down the types of automated financial reporting software, compare the 7 most common tools, outline a practical 5-step implementation approach, and share real results from companies that successfully transformed their finance function through automation.
Before founding Vidi Corp, I worked as a Financial Analyst at Autodesk, where I built Power BI dashboards for Financial Directors and the CFO. That experience shaped our practical approach to financial reporting: reports must be accurate, fast, and designed for decision-making, not just presentation.
Since launching Vidi Corp, our Power BI consultants have delivered automated financial dashboards for more than 200 companies, supporting over 100 CFOs and finance leaders. Our clients include global brands such as Dermalogica and Tikkurila, as well as fast-growing mid-sized organizations across multiple industries.
Across these projects, we have consistently seen how powerful well-designed CFO dashboards can be in transforming the finance function. A strong example is our work with the CFO of Neterra Telecom. The automated Power BI dashboards we built delivered measurable business impact:
These outcomes demonstrate that financial business intelligence is not just about saving time. When implemented correctly, it directly improves profitability, decision speed, and the strategic positioning of the finance team.
Month-end reporting is one of the first financial processes that should be automated. It ensures leadership has timely, consistent visibility into business performance without delays or manual consolidation.
The core month-end reports that typically require automation are:
These reports are usually compiled automatically in table format within cloud accounting software or ERP systems. Once configured correctly, data flows directly from transactions into structured financial statements, reducing reconciliation errors and improving reporting speed.
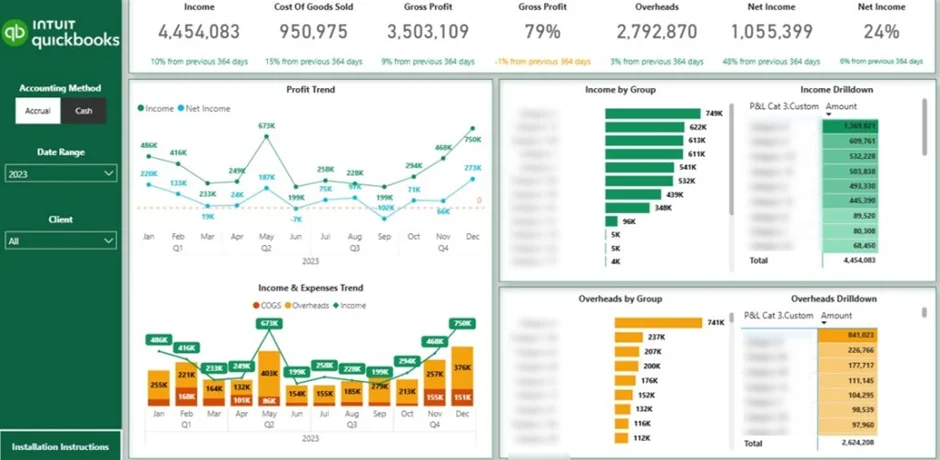
To go beyond static tables, many companies connect their accounting system to tools like Power BI. This allows finance teams and executives to visualize trends in revenue, margins, cash position, receivables ageing, and payables cycles. Instead of reviewing spreadsheets, stakeholders can monitor financial health through automated dashboards that refresh in real time.
Investor reporting is another financial process that should be automated as the business grows. Investors expect consistent, transparent, and data-driven updates on performance and future outlook.
Public companies publish annual investor reports to update shareholders on financial performance over the past year. These reports typically include revenue, profitability, cash flow, and strategic highlights, presented in a structured and compliant format.
Private companies usually produce monthly or quarterly investor updates. These reports focus on growth and profitability metrics such as revenue growth rate, gross margin, burn rate, customer acquisition, retention, and runway. The goal is to show how the company is progressing over time and whether it is moving toward its strategic objectives.
Investor reports usually go deeper than standard financial statements. They analyse the performance of strategic initiatives such as new product launches, market expansion, pricing changes, or cost optimization programmes. This helps investors understand not only what happened, but why it happened and how it supports future revenue growth and profitability.
Another critical component is actuals vs forecast analysis. Investors need visibility into whether the company is on track to hit projected revenue, margin, and cash flow targets. Automated reporting ensures that forecast comparisons are updated consistently, making it easier to explain variances and adjust strategy early if needed.
Automating investor reporting reduces manual consolidation, improves accuracy, and ensures leadership can deliver timely, structured updates that build investor confidence.
Sales reporting is closely connected to finance, especially in larger organizations. When I worked at Autodesk, sales and finance operated within the same department, and a significant part of my role as a financial analyst was supporting sales teams with structured financial insights.
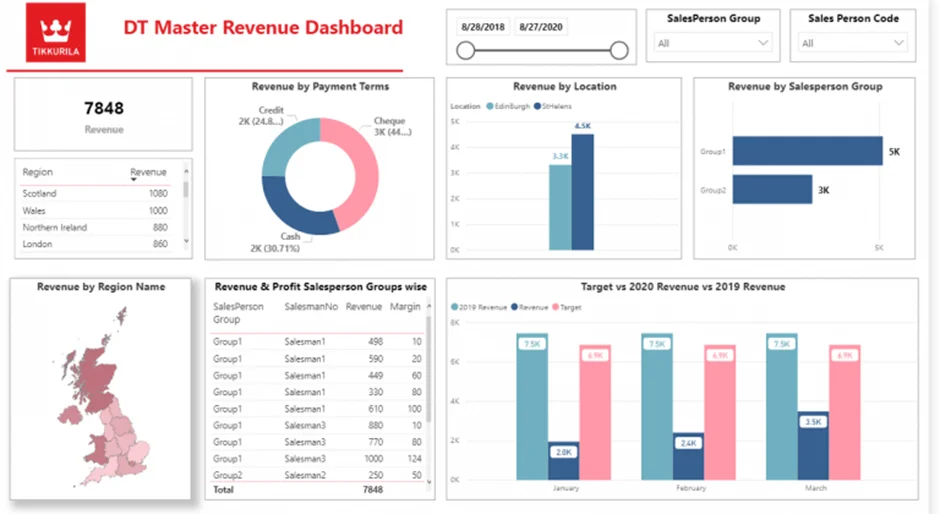
The most common sales reports produced by finance focus on weekly booked revenue and invoiced revenue. These reports help leadership assess whether the business is on track to meet monthly, quarterly, and annual forecast targets. Automated sales reporting ensures that performance against quota is visible in real time, allowing teams to react early if gaps appear.
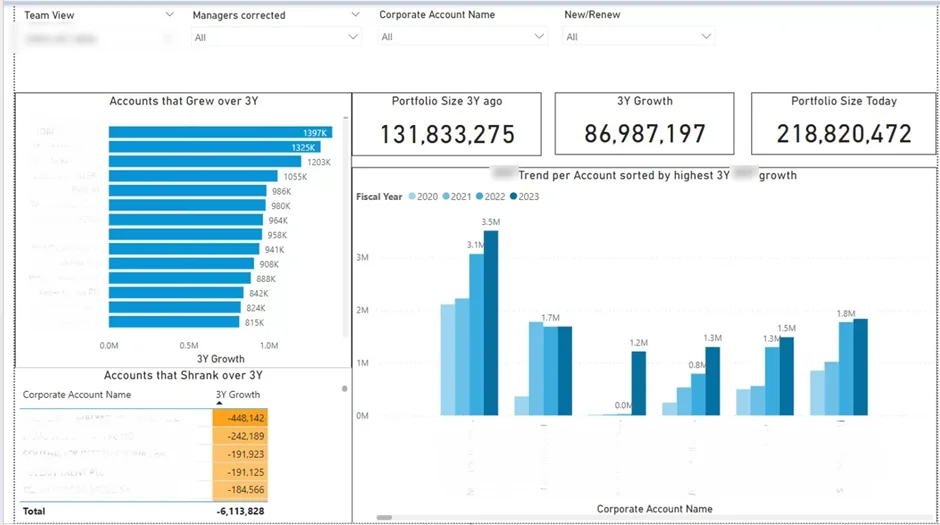
Beyond high-level revenue tracking, sales teams managing strategic client relationships require deeper analysis. In my experience, we regularly analyzed year-over-year revenue growth across each sales rep’s and manager’s client portfolio. This helped identify which accounts were expanding, which were stagnating, and which were at risk.
Automating these sales reports allows finance and sales leadership to monitor growth trends, track performance against targets, and prioritize high-value accounts. Instead of manually consolidating CRM and ERP data, teams can focus on improving win rates, strengthening client relationships, and driving sustainable revenue growth.
Finally, finance teams regularly receive ad-hoc questions about company performance. These requests often come from sales teams who have a hypothesis about what is working and want to validate it with data. When I worked as a financial analyst, I received these types of questions almost every week.
Typical examples include analyzing whether a specific campaign increased revenue, whether a pricing change improved margins, or whether a certain client segment is growing faster than others. Without structured data models, answering these questions can take hours of manual extraction and reconciliation.
Finance leadership also frequently asks for analysis around industry-wide events or internal initiatives. This usually requires time-series analysis that compares performance before and after a specific event, such as a market downturn, product launch, acquisition, or organizational change.
Automating ad-hoc reporting does not mean eliminating flexibility. It means building clean data models and reusable dashboards that allow analysts to answer questions quickly. With automated data pipelines and standardized metrics, finance teams can shift from manual data gathering to faster insight generation, supporting better and more timely decision-making across the business.
Many articles about automated financial reporting mix different types of software into one list. In reality, these tools serve different purposes, and understanding the distinction is important before choosing the right solution.
If you are a small business with relatively simple reporting needs, the native reports inside cloud accounting platforms may be sufficient. These tools can automatically generate P&L, Balance Sheet, and Cash Flow statements without additional systems.
However, as soon as reporting becomes more complex, businesses typically need a combination of systems. Cloud Accounting Software or an ERP handles transactions and financial data storage, while a dedicated reporting tool transforms that data into structured dashboards, forecasts, and executive-level insights.
In the next sections, we’ll break down these categories and review the specific tools used in each.
Cloud accounting software includes tools like QuickBooks Online, Xero, and FreshBooks. These platforms are primarily designed for bookkeeping and transaction management. While they play a critical role in financial processes, they should not be considered fully automated financial reporting tools.
Their main strength lies in data aggregation. Cloud accounting platforms typically integrate with banks such as Wise or Payoneer and sales channels like Stripe or Shopify. These integrations automatically pull transactions into the system and structure them within the general ledger. This creates a clean and reliable financial data foundation, which is essential for accurate reporting.
Most cloud accounting tools provide standard financial reports such as Profit & Loss, Balance Sheet, and Cash Flow statements. These reports are usually available in multiple views, including month-to-date, year-to-date, and year-over-year comparisons. For small businesses with straightforward reporting needs, this may be sufficient.
However, their custom reporting capabilities are limited. Complex analysis, advanced KPIs, consolidated reporting across entities, or detailed forecasting often require exporting data to Excel or connecting the accounting system to a dedicated reporting tool. As a result, cloud accounting software should be seen as the data backbone of financial reporting, not the complete reporting solution itself.
QuickBooks Online is one of the most widely used cloud accounting platforms for small and mid-sized businesses. It allows users to record transactions either manually or automatically through bank and payment integrations, and then categorize those transactions into the correct general ledger accounts. It also provides functionality to reconcile payments with invoices, helping ensure that revenue and cash records are accurate.
Once transactions are properly recorded and reconciled, users can leverage QuickBooks’ built-in reporting functionality. The platform offers standard financial reports such as Profit & Loss, Balance Sheet, and Cash Flow statements. Reports can be generated for different time periods and scheduled to be automatically exported to PDF or Excel and sent via email to stakeholders.
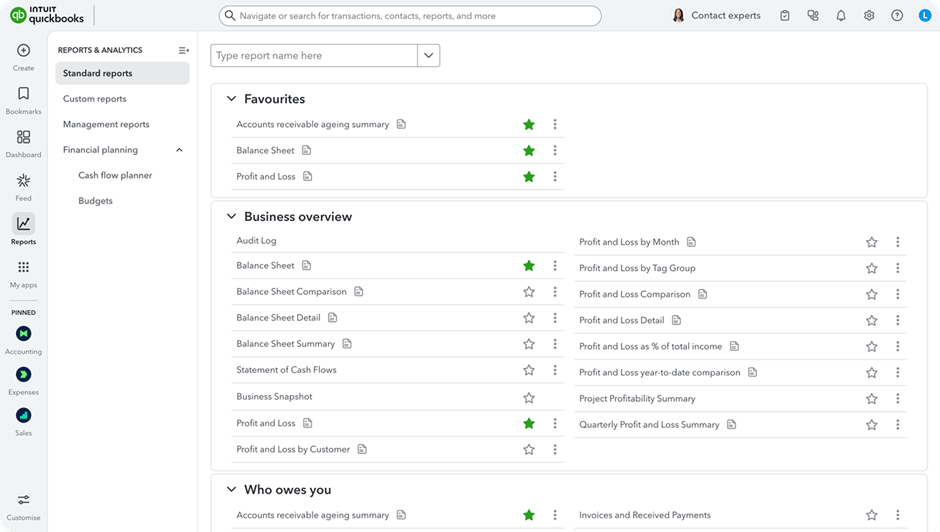
Most QuickBooks reports are presented in a structured table format. While they are not highly visual, they are interactive. Users can easily drill down from account categories into individual transactions, which makes it simple to investigate variances or unusual balances.
QuickBooks also offers limited customization options. Users can modify reporting periods, add or remove columns, and apply filters to adjust the level of detail. However, advanced KPI modelling, multi-entity consolidation, and executive-level dashboards typically require exporting data or integrating QuickBooks with a dedicated reporting tool.
Xero offers similar bookkeeping and reconciliation functionality to QuickBooks Online. Businesses can record transactions manually or automatically through bank feeds and payment integrations, then categorize them into general ledger accounts. In practice, many accountants find that day-to-day bookkeeping tasks can be completed faster in Xero due to its streamlined interface.
One important distinction is that Xero reports only show reconciled transactions. If a transaction has not been reconciled, it will not appear in financial reports. This makes the reconciliation process critical, as incomplete reconciliations can lead to missing figures in your P&L or Balance Sheet.
Xero provides the same core financial reports as QuickBooks, including Profit & Loss, Balance Sheet, and Cash Flow statements. It also offers slightly stronger customization capabilities. Users can adjust layouts, create custom report formats, and modify grouping structures to better match internal reporting needs.
Xero also includes a built-in dashboard with simple data visualizations such as revenue, expenses, bank balances, and outstanding invoices. This dashboard can be customized to display selected metrics and charts. However, the visualizations are limited to basic summaries, and it is not possible to build complex formulas or advanced KPI models directly within the dashboard. For more sophisticated reporting, businesses typically connect Xero to a dedicated reporting or BI tool.
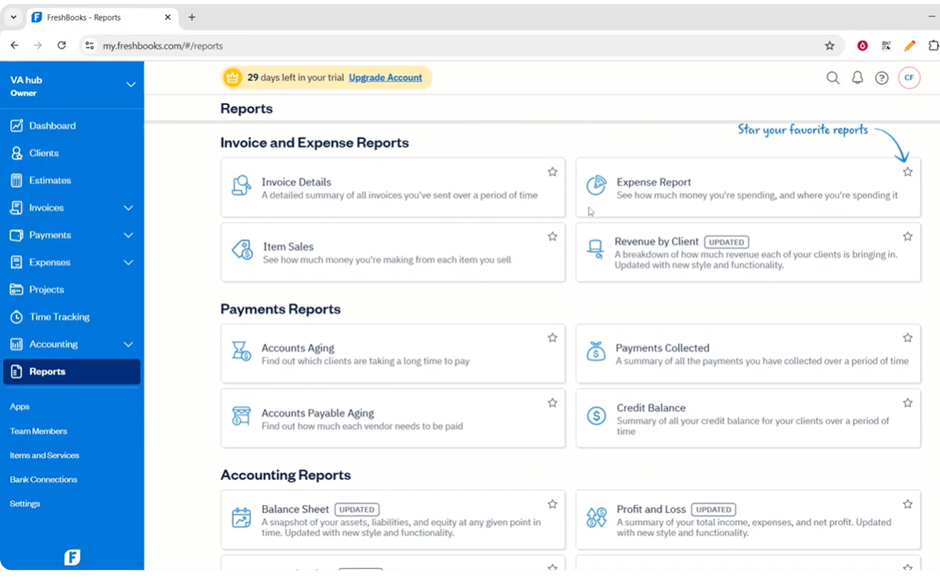
FreshBooks is less popular than QuickBooks Online or Xero and is primarily used by small businesses and freelancers. Its core focus is bookkeeping, invoicing, and expense tracking rather than advanced financial reporting.
The platform allows users to create invoices, record expenses, reconcile payments, and manage basic accounting processes. It offers a limited set of financial reports, such as Profit & Loss and tax summaries, but the reporting depth is more restricted compared to QuickBooks or Xero.
FreshBooks does not provide a customizable dashboard with visualizations like Xero. Reporting is mostly presented in a simple table format, with minimal flexibility for advanced analysis. For businesses that require more structured KPI tracking or executive-level reporting, FreshBooks would typically need to be connected to an external reporting tool.
Enterprise Resource Planning (ERP) systems include platforms such as Oracle NetSuite and Sage Intacct. Unlike cloud accounting tools, ERPs are designed to unify data across the entire organisation, not just finance.
An ERP consolidates information from finance, operations, inventory management, procurement, and supply chain into a single system. For example, in manufacturing projects we’ve worked on, the ERP did not only stored financial transactions but also tracked production volumes, warehouse movements, supplier performance, and order backlogs. This creates a much more connected data environment.
ERPs also support automation of core business processes. This can include automated inventory replenishment, purchase order creation, revenue recognition rules, approval workflows, and multi-entity consolidation. As a result, they improve operational efficiency as well as financial control.
However, ERPs are significantly more expensive than cloud accounting tools and typically require implementation support. They are often not affordable or necessary for early-stage startups.
While ERPs provide pre-configured financial and operational reports, their main purpose is to act as a central data backbone for the organization. For advanced financial analytics, KPI modelling, and executive dashboards, businesses often integrate their ERP with a dedicated reporting or business intelligence tool.
Oracle NetSuite is a full-scale ERP system that goes far beyond traditional accounting software. In addition to finance modules, it includes integrated CRM, inventory management, procurement, and HR functionality. It also supports multi-currency, multi-tax, and multi-subsidiary consolidation, making it suitable for international and multi-entity organizations.
NetSuite offers hundreds of pre-built reports covering finance, sales, inventory, and operations. It also provides strong customization capabilities. Unlike most cloud accounting tools, NetSuite allows users to build pivot tables, charts, and more advanced saved searches directly within the system. Its native reporting functionality supports joins between different data tables, enabling more complex cross-functional analysis.
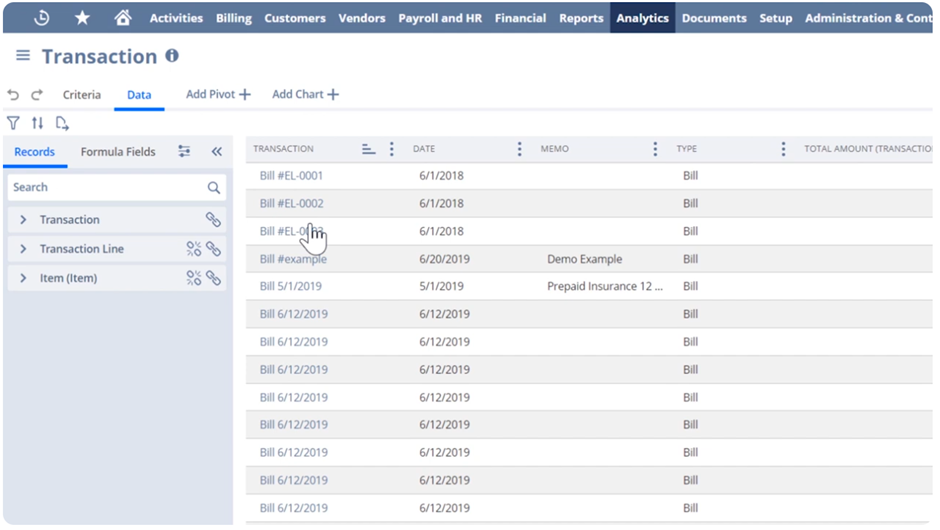
Users can also create custom dashboards tailored to different roles, such as CFO, Sales Director, or Operations Manager. These dashboards can include KPI scorecards, trend charts, and real-time operational metrics pulled directly from live system data.
For more advanced data extraction and external reporting, NetSuite offers the SuiteAnalytics Connect package, which costs approximately $500 per month as an add-on. This package provides an ODBC connector that allows businesses to automatically extract data from NetSuite into external reporting tools such as Power BI or Tableau. This makes it easier to build advanced financial models, executive dashboards, and consolidated reporting outside of the ERP environment.
Sage Intacct is primarily designed for small and mid-sized businesses that have outgrown tools like QuickBooks Online or Xero. It is particularly strong in project accounting and multi-entity consolidation, making it popular with professional services firms and growing multi-entity organizations.
At its core, Sage Intacct is a financial management system. However, it offers a wide range of add-ons and third-party integrations that can extend it toward full ERP functionality. Businesses can connect CRM, HR management, and inventory management applications. Despite these extensions, finance remains the central focus of the platform.
Sage Intacct provides pre-set dashboards tailored to different industries, such as SaaS and professional services. It also offers role-based dashboards for positions like Financial Controller and CFO. This allows leadership to access relevant KPIs immediately without building reports from scratch.
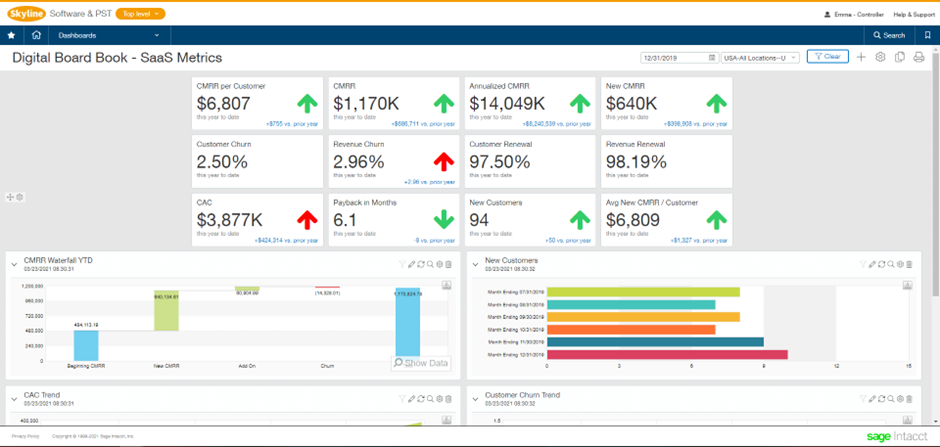
The native reporting functionality inside Sage Intacct is highly customizable. Users can build their own dashboards using drag-and-drop tools, apply conditional formatting, and design reports that match internal reporting structures. This makes it significantly more flexible than most cloud accounting platforms while still being more finance-focused than broader ERP systems like NetSuite.
Reporting tools such as Fathom Reporting and Power BI are designed specifically for analysis and visualization. Unlike cloud accounting platforms or ERPs, they are not built for bookkeeping, reconciliation, or transaction processing.
Their main purpose is to transform financial and operational data into structured dashboards, KPI reports, forecasts, and executive summaries. These tools sit on top of your accounting system or ERP and turn raw data into clear insights that support decision-making.
Fathom Reporting is a strong choice for businesses and accounting firms that need structured, out-of-the-box financial reports based on their accounting data. It is commonly used by accounting practices and outsourced CFOs to prepare and share performance reports with clients.
Fathom integrates directly with systems like QuickBooks, Xero, and MYOB, automatically pulling financial data into its reporting environment. Reports can be white-labelled, which makes the platform particularly suitable for external reporting. Accounting professionals can present branded, client-ready reports without exporting data into separate tools.
The platform also allows firms to manage multiple clients in one interface. Advisors can quickly scan performance across their entire portfolio and immediately spot unusual changes in revenue, margins, or cash flow.
Fathom includes a drag-and-drop interface for building dashboards and designing visual reports. Users can embed graphs directly into PDF reports, making it easy to produce structured management packs or investor updates.
However, Fathom has limitations. It is not designed for complex modelling or advanced formula creation. It also has limited capability to combine data from non-accounting sources. If you need to blend marketing, operations, CRM, and financial data into a single dashboard, Fathom is not the right tool. In those cases, a more flexible business intelligence platform is required.
Power BI is Microsoft’s business intelligence platform designed for advanced data modelling, automation, and visualization. It connects to 250+ data sources and starts at around $14 per user per month for the Pro license. Unlike accounting systems, Power BI is built specifically for reporting and analytics.
Power BI is best suited for fully custom, automated financial dashboards. It provides maximum flexibility for building financial statements, KPI dashboards, forecasts, and executive reports. Because it supports a wide range of data connectors, you can combine financial data with marketing, operations, CRM, HR, and supply chain data. This allows organizations to analyze the full financial impact of business initiatives rather than reviewing departments in isolation.
It is especially powerful for organizations already using Microsoft tools such as SharePoint, Dynamics 365, Azure, or Microsoft Fabric. Integration is seamless, which reduces setup time and makes it easy to embed financial dashboards into existing workflows, Teams channels, or internal portals.
Power BI also supports advanced features such as embedding visuals into PDF reports, though this requires technical setup. For complex implementations, working with experienced Power BI developers is recommended.
Another major advantage is AI capability. Using Microsoft Fabric, businesses can build AI data agents that allow stakeholders to ask questions in natural language and receive answers directly from live data. This reduces dependency on analysts and provides immediate insights to business users. Setting these up is quite a technical process, so we recommend you speak to Microsoft Fabric consultants about AI analytics.
There are also licensing advantages when Power BI is used alongside other Microsoft services. For example, certain Microsoft Office E5 licenses include Power BI functionality, reducing incremental cost.
At Vidi Corp, we offer free Power BI templates for QuickBooks Online and Xero that already contain the required formulas to ensure your numbers reconcile correctly.
Our Business Intelligence consultants have extensive experience designing automated financial reporting systems. We specialize in building fully customized financial dashboards in Power BI, where businesses need flexibility, cross-functional data integration, and scalable reporting models.
Based on our experience delivering these projects, here is the structured approach we recommend for successfully automating your financial reporting.
The first step is to structure your financial data properly. This means implementing a cloud accounting platform like QuickBooks or Xero, or a full ERP such as NetSuite or Sage Intacct.
Your reporting will only be as good as your underlying data model. A properly configured chart of accounts, consistent categorization, and completed reconciliations are essential. Without structured and clean data, automation will not work reliably.
Once your accounting system is set up, the next step is to automate data extraction.
In Power BI, this is done using ready-made connectors. We use proprietary Power BI connectors that extract data from QuickBooks Online, Xero, and Zoho Books in a reporting-ready format. Our connectors can pull data from multiple accounts and consolidate it into a single dataset automatically.
This removes the need for manual exports to Excel and ensures your reports always use the latest data.
After extraction, the data needs to be structured for reporting. Power BI includes a built-in data transformation tool called Power Query.
Power Query allows you to define transformation steps such as removing unnecessary columns, filtering data, renaming fields, replacing values, and creating calculated fields. Once defined, these steps are applied automatically every time the dataset refreshes.
This is why Step 1 is critical. If your financial data remains in a consistent format, the transformation logic will continue working without manual intervention.
With clean and transformed data, you can build your financial reports.
We recommend starting with ready-made Power BI templates that connect directly to your accounting platform or ERP. These templates already contain the necessary financial formulas, including reconciled P&L, Balance Sheet, and Cash Flow logic. This saves significant time and reduces modelling errors.
From there, you can customize the dashboards further and design tailored automated financial reports for management, investors, and finance teams.
The final step is to automate report refresh.
Power BI datasets can be refreshed up to 8 times per day with a standard Pro license and up to 48 times per day with a Premium license. Refresh schedules can be configured to run automatically at specific times.
This ensures that your financial dashboards always display up-to-date information without any manual intervention.
Manual reporting requires exporting data, cleaning spreadsheets, updating formulas, and checking reconciliations every reporting cycle. Automation removes these repetitive tasks. Finance teams can focus on analysis and strategic support instead of data preparation.
In one of our consulting projects, a CEO reported a 95% reduction in manual data consolidation tasks after we centralized 6 disconnected systems into a single cloud database with automated Power BI reporting. A CFO also confirmed that automated reporting allowed them to eliminate the need for one full-time business analyst role previously dedicated to maintaining Excel reports.
Without automation, leadership often waits days or weeks for updated numbers. Automated dashboards provide real-time visibility, enabling quicker strategic action and reducing decision delays.
A telecommunications client we supported with ERP-to-Power BI automation reported 40% faster turnaround on strategic decisions thanks to real-time dashboards. Their executive review cycles were shortened by two business days per week. In the same project, automated reporting helped the leadership team identify a cost-saving opportunity that resulted in €50,000 in immediate savings shortly after launch.
Manual processes increase the risk of formula errors, version control issues, and inconsistent assumptions. Automated data pipelines apply consistent logic every time reports are refreshed, significantly improving data reliability.
In a project where we implemented automated REST API data feeds and centralised reporting infrastructure, the client reported an 80% reduction in data-entry errors. They also confirmed that data integrity across business units improved to 99.7% accuracy, strengthening trust in financial and operational reporting.
Automated reporting consolidates finance, sales, operations, and marketing data into a unified reporting layer. This improves transparency and ensures all departments work from the same numbers.
For a client in the telecommunications sector, we developed automated Power BI reports connected directly to their ERP system. These reports were used across sales, marketing, procurement, operations, and finance. As a direct result of the improved visibility, the client identified €10–20K in new monthly recurring revenue opportunities, which they attributed to insights generated from the automated dashboards.
When reporting is automated and structured, finance shifts from manual report production to strategic leadership and business transformation. Companies seeking structured IT strategy and enterprise modernization can partner with Bay Forward digital transformation services to implement scalable, future-ready solutions.
One CFO we worked with used the automated Power BI transformation project as a cornerstone of their application for CFO of the Year 2024 in Bulgaria, where they won the category “Transformation of the Financial Function.” The automated reporting infrastructure we implemented played a key role in elevating the visibility and strategic impact of the finance function within their organisation.
When your financial data is structured, automatically refreshed, and visualized in clear dashboards, finance shifts from manual report production to strategic leadership. You reduce errors, save time, accelerate decisions, and unlock insights that directly impact revenue and profitability.
We have helped 200+ companies automate their financial reporting using Power BI, including global brands like Dermalogica and Tikkurila. Our dashboards have delivered measurable cost savings, new revenue opportunities, and award-winning finance transformations.
If you’re ready to move beyond spreadsheets and build a fully automated financial reporting system tailored to your business, contact us today.
Our BI consultants will assess your current setup and design a solution that gives your finance team real-time visibility, maximum flexibility, and measurable business impact.
![]()
![]()
![]()