
In this article we want to give 9 marketing analytics examples that provide a clear view into how modern teams measure, optimise, and scale their marketing performance. As digital channels generate vast amounts of data, success depends on the ability to interpret that data accurately and act on it with confidence.
At Vidi Corp we have delivered 100+ marketing analytics consulting solutions to enterprise clients like Teleperformance and DS Smith. We have also worked with increadibly influential marketing agencies like Neil Patel’s NP Digital and TubeScience (a FB Ads agency that spends $2B per year). In this article we are showing examples of our work that we delivered to real-world clients.
This article explores the four main types of marketing analytics, showcases real-world marketing analytics examples we’ve developed across major marketing channels, and outlines the tools used to turn complex datasets into clear, actionable insights.
Marketing analytics is the process of collecting, analysing, and interpreting data from different marketing channels such as SEO, social media, email marketing, PPC advertising, and website interactions to understand how marketing efforts are performing.
By analysing this data, businesses can see which campaigns are driving results, how customers engage with their brand, and which trends are shaping the market. Marketing analytics helps businesses evaluate performance, understand customer behaviour, refine marketing strategies, and maximise campaign results and ROI.
There are 4 different types of data marketing analytics: predictive, prescriptive, descriptive and diagnostic. Each data analytics type answers a different question about marketing data.
Descriptive analytics focuses on understanding what has already happened. It summarises historical data to show how marketing campaigns and channels have performed over a specific period. For example by analysing metrics such as website traffic, conversion rates, and engagement, businesses can evaluate the effectiveness of past marketing efforts and identify trends.
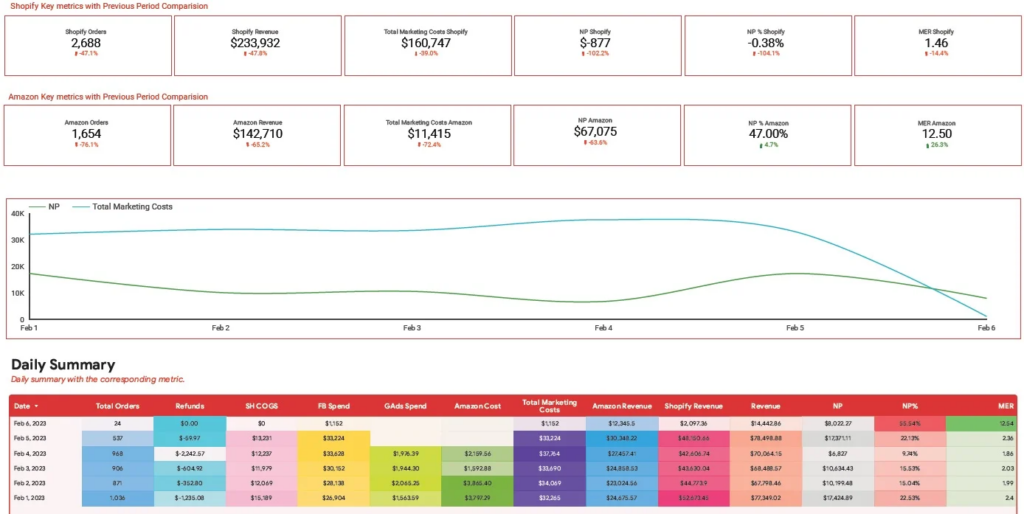
Real-World Case Study: A fast-growing ecommerce brand selling through both Amazon and Shopify was struggling to understand why revenue was increasing while profit remained inconsistent. Paid advertising represented their largest cost, but performance varied significantly across platforms.
Our approach: Our marketing analysts created the ecommerce dashboard above to help a client with descriptive analytics. Since marketing costs are often the largest overhead, the dashboard focuses on understanding how ad spend impacts net profit and marketing efficiency for a brand selling on both Amazon and Shopify.
Data Sources:
Metrics:
Outcome:
The ecommerce dashboard we built alerts the client when the net profit margin falls dramatically. It also helps to immediately attribute the change to paid ads spent from one of the channels or increased refunds. They can then investigate the cause of the issue further by looking into the individual refunds or campaigns.
Predictive analytics uses historical data and statistical models to forecast future outcomes and trends. In marketing, it helps businesses anticipate customer behaviour, campaign performance, and changes in demand. These insights allow marketers to take a proactive approach and adjust strategies ahead of time.
Real-World Case Study: A popular nightclub wanted to improve event planning and staffing decisions but relied largely on intuition rather than data. Missed opportunities on peak nights and overstaffing on slow days were hurting profitability.
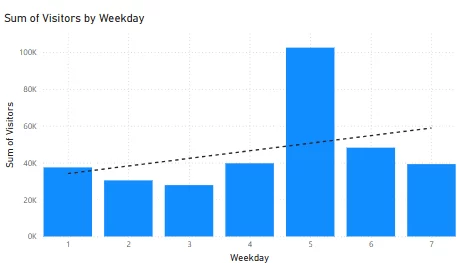
Our approach: We analyzed historical attendance data to build a forecasting model that predicted high-traffic days, allowing the nightclub to strategically plan major events on dates with the highest expected turnout.
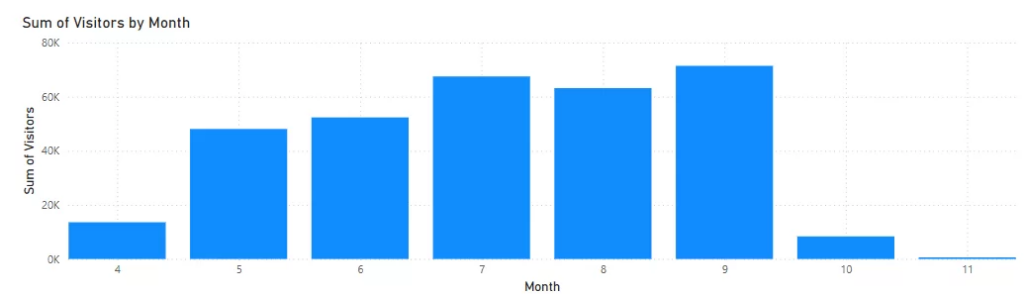
The analysis explored correlations between visitor count and time-based factors such as weekday and month. Clear patterns emerged, including higher attendance on Fridays, seasonal growth between April and September, and an overall upward trend in yearly visitors. These patterns were used to inform the staffing decisions for the following year.
Data Sources:
Metrics:
Outcome:
This marketing analytics example helped the night club to gain reliable attendance forecasts that enable better event scheduling, optimized staffing, improved budgeting, and maximized revenue from high-impact events planned on peak attendance days.
Prescriptive analytics focuses on recommending actions that businesses should take to achieve better results. It combines insights from past performance and future predictions to suggest how marketing strategies can be optimised to maximise effectiveness and return on investment.
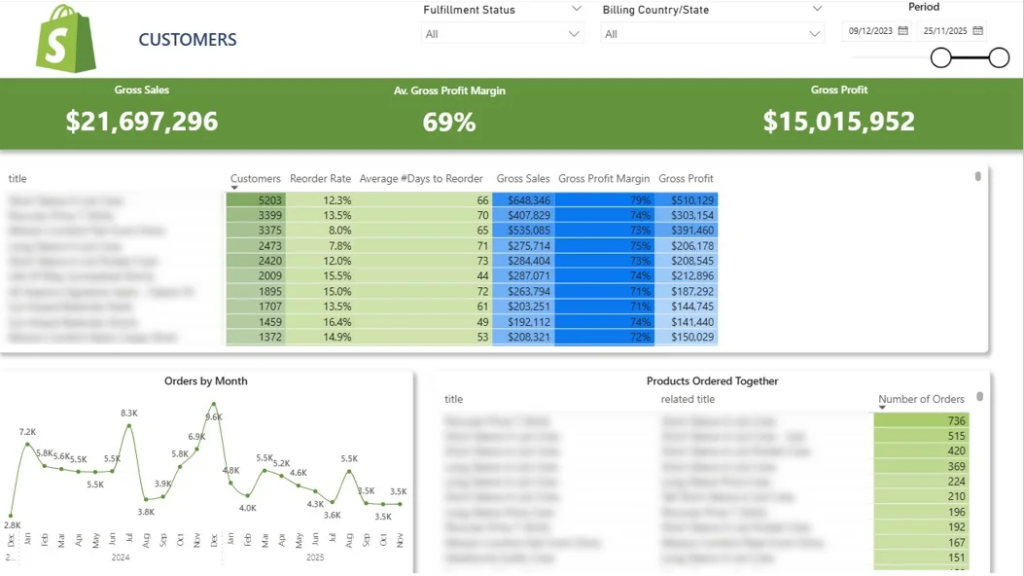
Real-World Case Study: A Shopify merchant with a large product catalog struggled to decide which products to promote, bundle, or phase out. While revenue was steady, repeat purchases and average order value were below industry benchmarks.
Our approach: We built a Shopify product dashboard above to analyze product-level performance for our client’s Shopify store. The top table summarizes product performance by showing how many customers purchased each item, the percentage who reordered, and the average time between purchases. Selecting a product dynamically filters the line chart to display its monthly order trends, making it easy to identify growth patterns and seasonality.
This dashboard also highlights product combinations that are frequently purchased together, supporting smarter merchandising and marketing decisions.
Data Sources:
Metrics:
Outcome:
Our client developed an automatic upsell process based on our analysis, suggesting another product to customers who added a related item to cart. They also started email campaigns to customers suggesting them to reorder their purchase items after the average number of days to reorder. This analysis essentially informed the marketing campaigns — ultimately driving higher revenue and stronger customer retention.
Diagnostic analytics aims to explain the “why” behind certain KPI results. It analyses data to identify the root causes behind marketing successes or failures, helping businesses understand what influenced campaign outcomes and where improvements are needed.
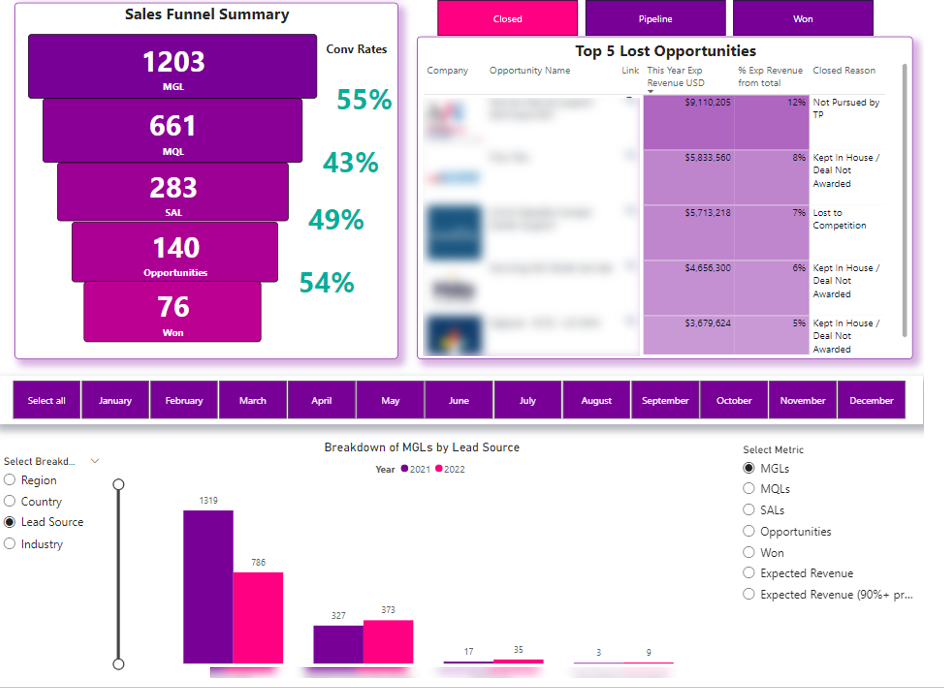
Real-World Case Study: A B2B sales team noticed inconsistent close rates but lacked clarity on where deals were breaking down in the funnel. Sales reps spent time chasing low-probability opportunities.
Our approach: We developed a Power BI sales pipeline dashboard that visualizes which potential clients are still active, won, or lost. It also helps teams identify which stages of the sales funnel are causing friction, making it easier to diagnose where deals stall or drop off.
Data Sources:
Metrics:
Outcome:
The sales team gained faster visibility into pipeline health, quickly identified problematic funnel stages, and focused efforts where deals are most likely to stall—resulting in higher conversion rates and a more efficient sales process. They also identified the countries and lead sources with the highest conversion rates and used this analysis to identify the markets to focus on for the sales team.
Below are examples of how different marketing analytics approaches are applied across specific channels.
Social media marketing analytics focuses on measuring and evaluating paid advertising performance across social platforms. It helps marketers understand how users move through the marketing funnel, how efficiently ad spend drives conversions, and where costs increase or performance drops.
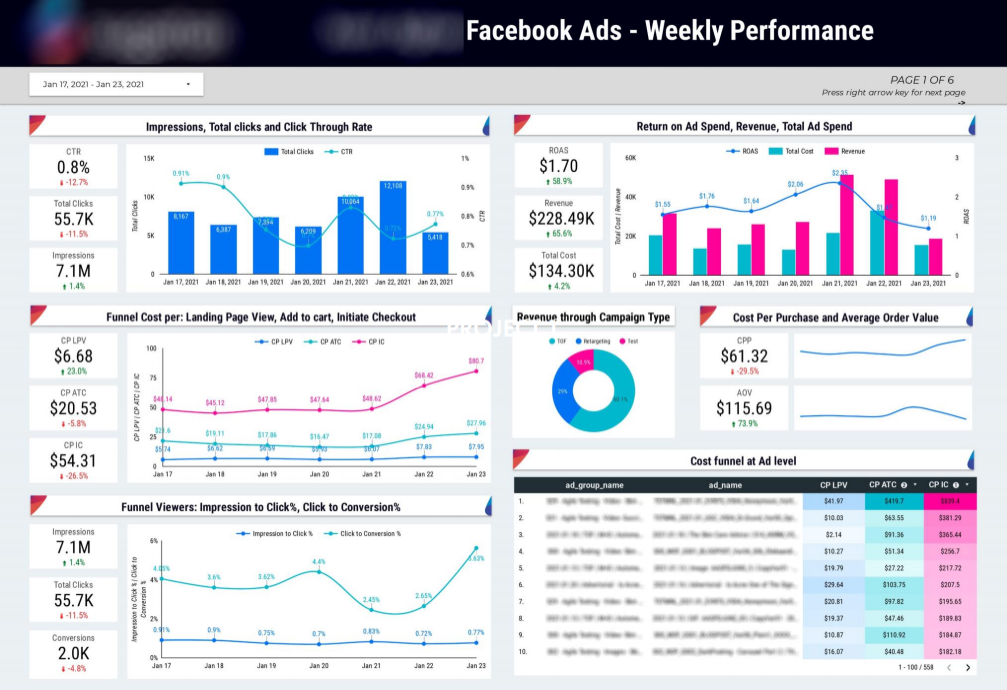
Context: An ecommerce brand running high-budget Facebook Ads campaigns knew which ads were converting but not where money was being wasted inside the funnel.
Our approach: We developed a Facebook Ads Looker Studio dashboard that provides a clear overview of Facebook Ads performance across the entire marketing funnel. It allows a client to track how impressions turn into clicks and conversions, while measuring the cost of each funnel stage—from landing page views to purchases. The dashboard highlights key monetary metrics and daily trends, helping teams quickly identify inefficiencies and profitability gaps.
Data Sources:
Metrics:
Outcome:
Media buyers and account managers gained clear visibility into funnel performance, identified costly or underperforming stages, optimized budget allocation, and improved overall campaign profitability and return on ad spend.
SEO marketing analytics focuses on measuring and explaining organic search performance. It analyses traffic acquisition, user behavior, and engagement metrics to help businesses understand how SEO efforts influence website visibility, traffic quality, and overall growth.
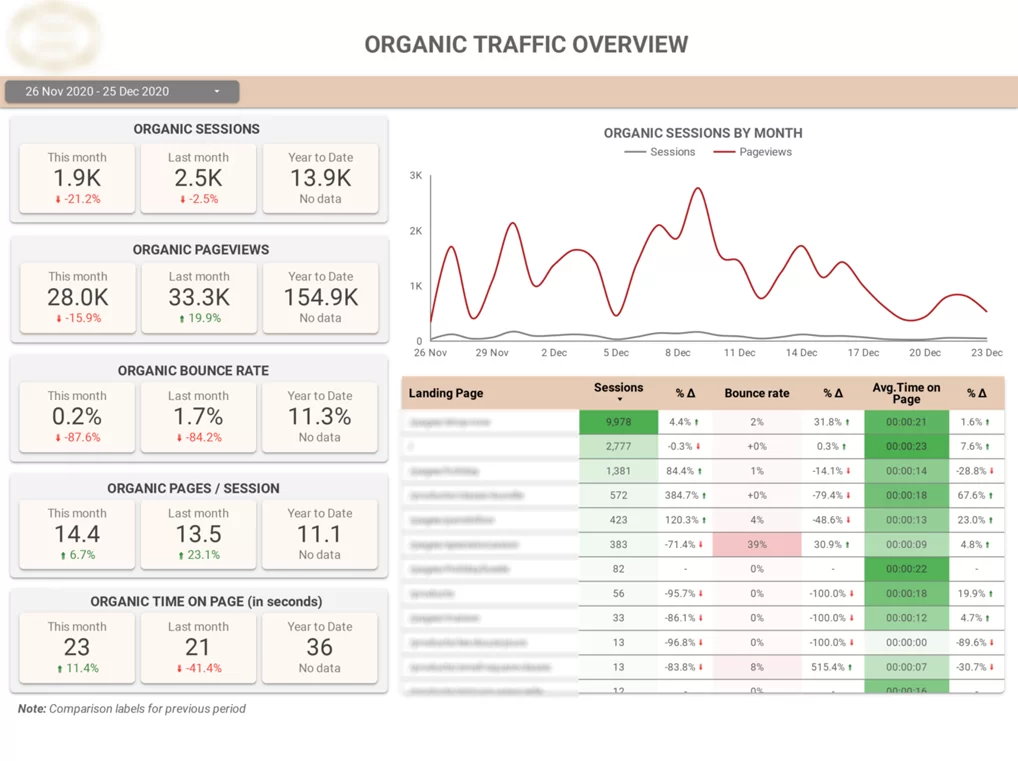
Real-World Case Study: An SEO agency needed a clearer way to report performance and explain traffic fluctuations to clients.
Our approach: Our Marketing Analytics experts created a SEO dashboard that provides a clear overview of organic traffic performance for SEO client reporting. It shows how much traffic is acquired through organic search, how it compares to other channels, and how SEO performance evolves over time. The dashboard also helps teams identify which landing pages drive the most traffic and which ones experience high bounce rates, making it easier to diagnose strengths and weaknesses in SEO strategy.
Data Sources:
Metrics:
Outcome:
SEO and marketing teams gain clear visibility into organic performance, identify high- and low-performing pages, improve content and optimization strategies, and demonstrate SEO progress to clients with data-driven insights. While advanced AI-powered solutions can help humanize AI text , turning insights into engaging content that resonates with audiences and supports more effective campaigns.
Email marketing analytics focuses on measuring and explaining the performance of outreach campaigns. It analyses engagement and response data to understand what drives opens, replies, and meetings, helping teams identify which sequences, timings, and channels perform best. Email design is a critical variable in this analysis, as A/B testing different layouts, visual hierarchies, and formatting choices reveals which design elements most effectively capture attention and encourage recipient action.
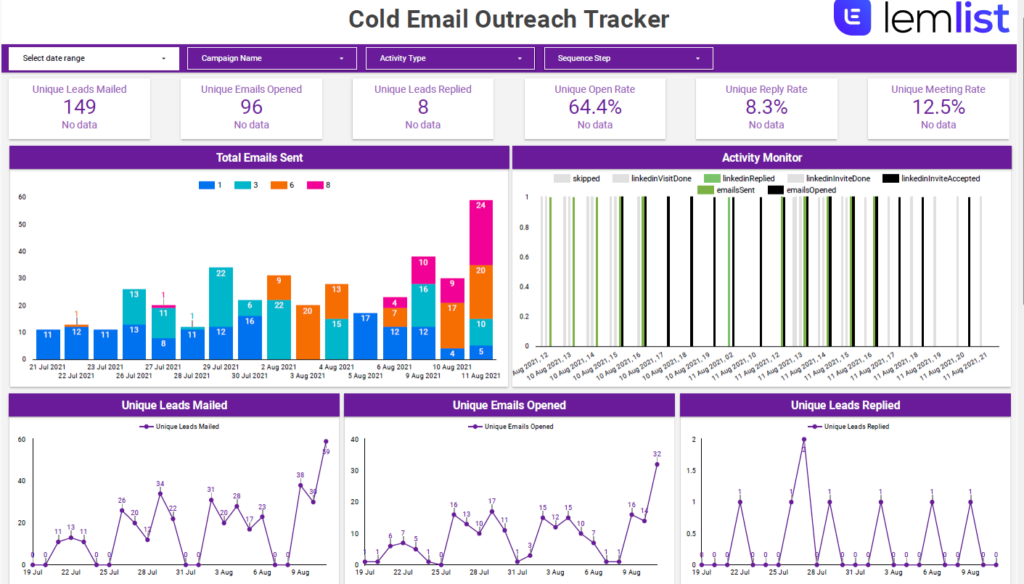
Real-World Case Study: A lead-generation agency running email and LinkedIn outreach campaigns struggled to understand why some sequences booked meetings while others stalled.
Our approach: Our Looker Studio dashboard provides a clear overview of email and LinkedIn outreach performance for a client running multi-channel campaigns with Lemlist. It shows how leads move through outreach sequences and how engagement evolves over time, making it easier to diagnose which steps, days, or hours generate the strongest responses.
Data Sources:
Metrics:
Outcome:
An email marketing agency gains clear visibility into campaign effectiveness, quickly identifies underperforming sequences or timing issues, and optimises outreach strategies to increase replies, booked meetings, and overall campaign impact.
Google Ads marketing analytics focuses on measuring and optimising paid search and display advertising performance. It analyses spend, engagement, conversions, and revenue data to help businesses understand how their Google Ads campaigns contribute to lead generation, sales, and overall return on ad spend.
Real-World Case Study: A business running multiple Google Ads campaigns needed a clearer way to evaluate performance and justify ad spend across campaigns and channels.
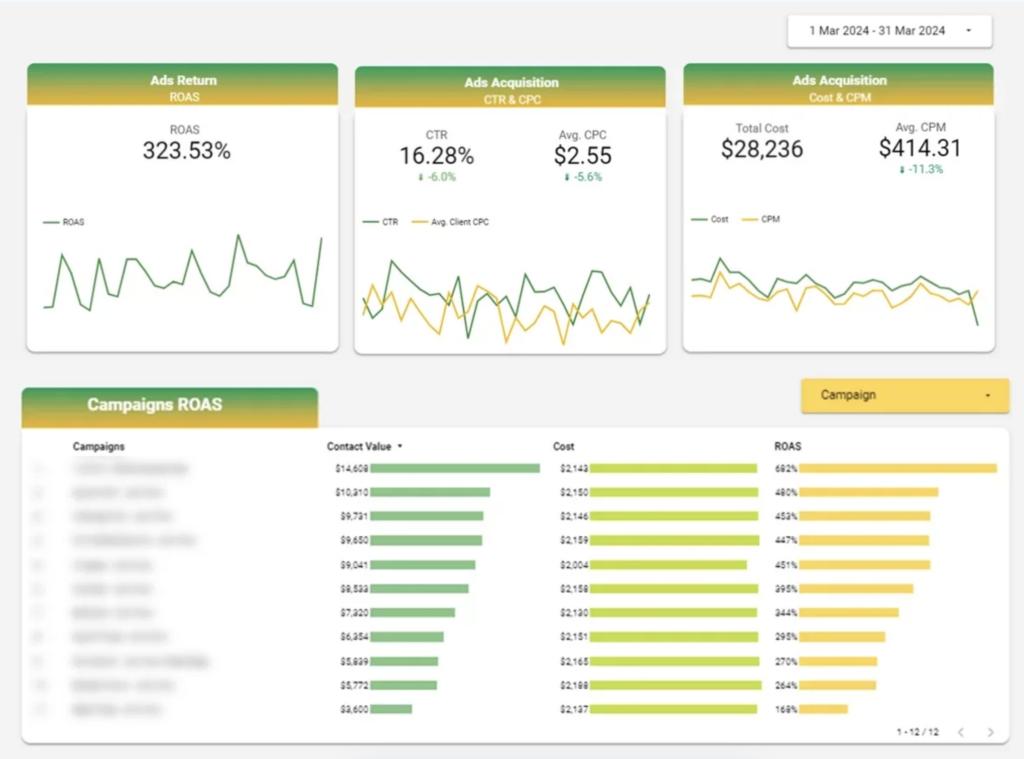
Our approach: Our Marketing Analytics experts built a Google Ads Looker Studio dashboard that provides a clear overview of paid advertising performance. The dashboard starts with a summary of the most important KPIs, including ROAS, CTR, CPC, CPM, and total cost, alongside trends and comparisons to the previous period. This allows teams to quickly assess performance and identify changes over time.
The dashboard then delivers a detailed campaign-level breakdown by combining cost data from Google Ads with revenue and conversion data from Google Analytics. This unified view makes it easier to evaluate the true effectiveness of each campaign by comparing contact value and revenue against advertising spend. It also highlights conversion types by campaign, helping teams understand which campaigns and actions are driving the most engagement and results.
Data Sources:
Metrics:
Outcome:
Marketing teams gained a clear understanding of how advertising spend translates into revenue and conversions. This enabled them to optimise budgets, improve campaign performance, and make data-driven decisions that maximise return on ad spend.
Web marketing analytics focuses on evaluating marketing efficiency across digital channels. It analyses how different traffic sources contribute to conversions, revenue, and profitability, helping businesses understand which channels and campaigns drive the most effective customer acquisition.
Real-World Case Study: An ecommerce brand advertised across multiple platforms but lacked a unified view of performance. Budget allocation decisions were based on incomplete channel-specific reports.
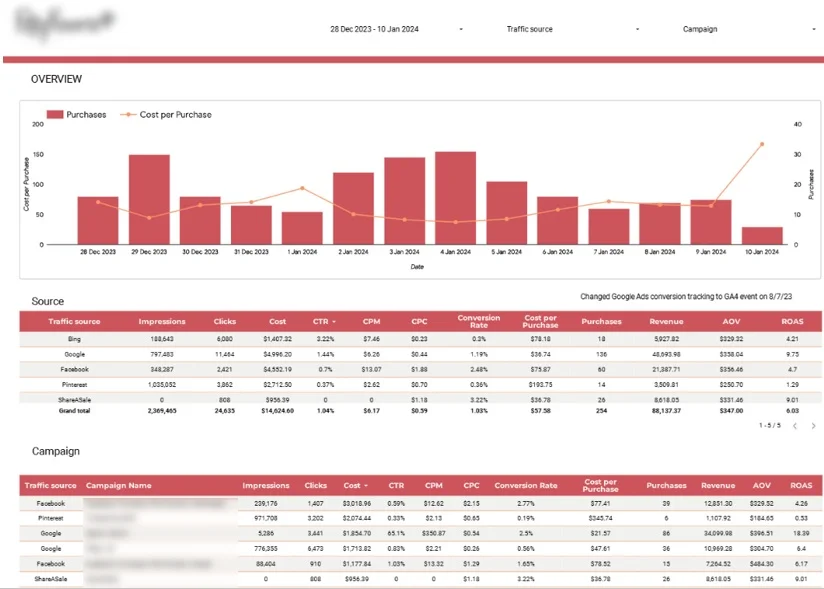
Our approach: Our analysts built a web marketing analytics dashboard that provides a clear overview of ecommerce marketing performance by combining data from multiple advertising and analytics platforms. It highlights daily purchases alongside cost per purchase to monitor acquisition efficiency, and breaks down key performance metrics by channel and campaign to diagnose which marketing efforts deliver the strongest results.
Data Sources:
Metrics:
Outcome:
Ecommerce teams gain clear visibility into cross-channel performance, identify the most profitable acquisition sources, optimize budget allocation, and improve overall marketing efficiency and return on investment.
The right marketing analytics tools help businesses collect, analyse, and visualise data from multiple sources in one place. They enable marketers to move beyond raw numbers, uncover insights faster, and make data-driven decisions in both real time and retrospect. Below are some of the most widely used marketing analytics tools and how they support different analytics use cases.
Looker Studio is a free data visualisation and reporting tool that allows marketers to build interactive dashboards using data from multiple sources. It is especially popular for client reporting and cross-channel marketing analysis.
Looker Studio connects directly to platforms such as Google Analytics, Google Ads, Google Search Console, Facebook Ads, and many third-party tools. This makes it easy to combine marketing performance data into a single, shareable dashboard.
Pros of Looker Studio
Cons of Looker Studio
Tableau is a powerful business intelligence and data visualisation platform used for advanced analytics and large-scale data analysis. It is well suited for organisations that need deeper analytical capabilities and more complex data transformations.
Tableau allows marketers to explore large datasets, uncover hidden patterns, and build sophisticated dashboards that go beyond standard reporting. It is often used by analytics teams and enterprises with dedicated data resources.
Pros of Tableau
Cons of Tableau
Google Analytics is one of the most widely used marketing analytics tools for tracking website and app performance. It helps businesses understand how users find, interact with, and convert on their websites.
With Google Analytics 4 (GA4), marketers can track events, user journeys, and conversions across devices. It serves as a foundational data source for many marketing dashboards and analytics workflows.
Pros of Google Analytics
Cons of Google Analytics
Power BI is Microsoft’s business intelligence and data visualisation platform designed for analysing data at scale and sharing insights across organisations. It is widely used by marketing, analytics, and finance teams that need robust reporting, advanced modelling, and strong integration with enterprise data sources.
Power BI allows marketers to connect data from a wide range of sources, including CRM systems, advertising platforms, databases, spreadsheets, and cloud services. Its tight integration with Microsoft products such as Excel, Azure, and SQL Server makes it particularly popular in organisations already using the Microsoft ecosystem.
Pros of Power BI
Cons of Power BI
The marketing analytics examples in this article show how businesses use data to identify inefficiencies, optimise performance, and drive growth across channels. When applied effectively, analytics turns complexity into clarity.
Looking ahead, teams that learn from real marketing analytics examples and invest in the right tools will be better equipped to adapt, scale, and compete in an increasingly data-driven environment.
At Vidi Corp we have delivered 1000+ analytics solutions to 600+ clients around the world. We would love bring our experience to your project. Please contact us now to discuss your marketing analytics needs.
![]()
![]()
![]()