Ecommerce business intelligence is the structured approach businesses use to turn ecommerce data into consistent, decision-driving insight. It defines what to measure, how data from platforms like Shopify, Google Analytics, and PPC channels is connected, and how insights translate into actions across sales, marketing, and operations. By bringing this data into a single reporting environment, ecommerce BI transforms fragmented information into clear dashboards that support revenue growth, marketing efficiency, and operational control.
Our business intelligence consultancy built 1,000+ custom analytics solutions for ecommerce brands across Shopify, Amazon, and multi-channel environments. We’ve partnered with notable ecommerce brands like Chilly Bottles, Olivia Von Halle, and AmorePacific, supporting them with scalable analytics solutions that drive better performance visibility and decision-making.
This article explains what ecommerce business intelligence is, why it matters, and how it is applied in practice based on our experience. It covers key KPIs, real dashboard examples across different areas of ecommerce, as well as the benefits, challenges, implementation best practices, and tools used to build effective BI solutions.
Ecommerce business intelligence is the process of using data to understand how your online store performs and what drives results. It helps you move beyond surface-level metrics and see how sales, marketing, customers, and operations are connected.
Instead of working across multiple tools, BI brings all your data together and turns it into clear dashboards. This makes it easier to track performance, spot trends, and understand what is actually happening in the business. BI software and BI tools enable this integration and analysis, supporting real-time insights and empowering ecommerce businesses to make data-driven decisions.
In practice, ecommerce BI helps teams answer key questions such as which products drive revenue, which channels are profitable, where customers drop off, and how inventory impacts sales. The goal is to make better decisions based on data, not guesswork.
Business intelligence plays a key role in helping ecommerce businesses understand how all parts of the business perform together. Sales, marketing, customer behaviour, and operations are often tracked in separate tools, which makes it difficult to see the full picture. BI brings this data into one place and makes it easier to understand what is actually driving results.
As ecommerce businesses grow, the volume of data increases quickly. Without a structured way to analyse it, teams rely on manual reports or incomplete insights. This leads to slower decisions and missed opportunities. Business intelligence solves this by providing consistent, up-to-date reporting that reflects how the business operates across channels and platforms.
It also creates a foundation for improving performance across the business. Teams can clearly see which products generate revenue, which marketing channels are effective, how customers behave, and how inventory impacts sales. This level of visibility allows ecommerce businesses to operate more efficiently and make decisions based on actual performance rather than assumptions.
Tracking the right KPIs is essential for understanding how an ecommerce business performs and where improvements are needed. These ecommerce analytics metrics help teams monitor sales, marketing effectiveness, customer behaviour, and operational efficiency in a consistent way.
Revenue is the primary KPI, showing how much the business generates over a given period. It is usually analysed alongside average order value (AOV) to understand how much customers spend per transaction and how pricing or bundling strategies impact sales.
Conversion rate is another key metric, measuring the percentage of visitors who complete a purchase. It helps identify how effectively the website turns traffic into customers and highlights potential issues in the user journey or checkout process.
Customer acquisition cost (CAC) and return on ad spend (ROAS) are critical for evaluating marketing performance. These metrics show how much it costs to acquire a customer and how much revenue is generated from advertising, helping teams allocate budgets more effectively.
Customer lifetime value (LTV) measures the total revenue generated by a customer over time. It is used together with CAC to assess long-term profitability and guide decisions on how much to invest in acquisition and retention.
Finally, inventory-related KPIs such as stock turnover and sell-through rate help track how efficiently products move through the business. These metrics are important for managing cash flow, avoiding overstocking, and ensuring that high-demand products remain available.
Business intelligence can be applied across every part of an ecommerce business, from sales and marketing to operations and customer analysis.
Below are the most common applications of ecommerce BI, each focused on a specific area of analysis. These examples show how data is used in practice to understand performance, identify opportunities, and support day-to-day decision-making.
Ecommerce performance analytics is a core application of business intelligence that focuses on tracking and analysing how an online store generates revenue. It brings together sales, customer, and product data to provide a clear view of what is driving performance. This allows ecommerce teams to monitor trends, evaluate key metrics, and make informed decisions on pricing, promotions, and product strategy.
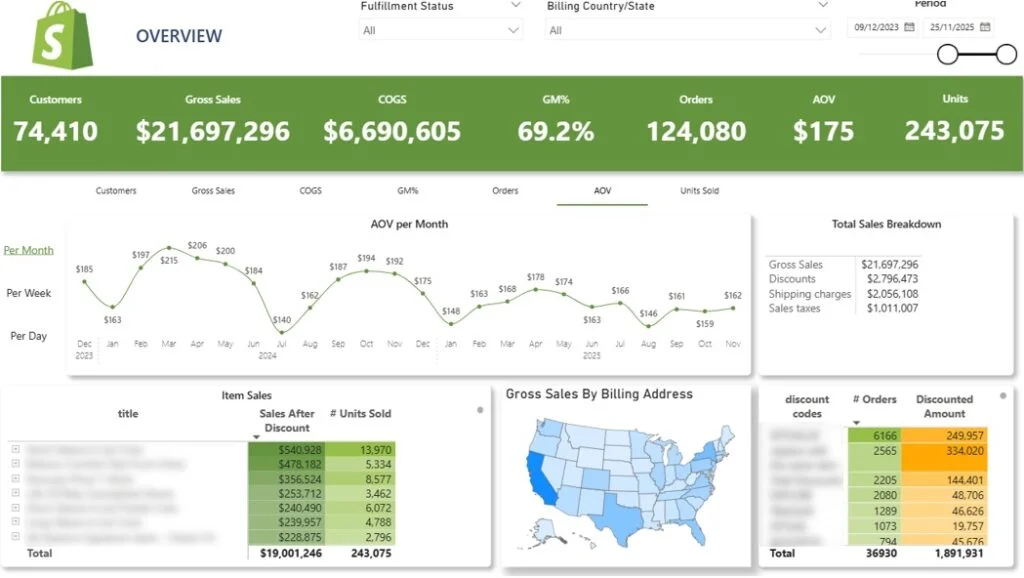
Our Power BI consultants built this dashboard for a Shopify brand to analyse performance across time, products, and customer segments. The analysis focuses on revenue trends over different time granularities, allowing users to compare daily, weekly, and monthly performance patterns. It breaks down sales by product and variant to identify which items drive volume and which contribute most to revenue and margin. Geographic analysis highlights differences in demand across regions, while discount code analysis evaluates how specific promotions influence order volume and revenue. The dashboard also enables comparison between key KPIs such as customer count, order volume, and average order value to understand the drivers behind revenue changes.
This analysis supports a consistent decision-making workflow across ecommerce teams. It helps identify high-performing products, track revenue trends, evaluate regional demand, and measure the effectiveness of discounts. As a result, teams can optimise pricing, improve marketing performance, and focus on the products and channels that drive the most value.
Ecommerce sales analytics focuses on understanding what drives revenue and how different factors influence purchase behaviour. It analyses conversion rates, sales volume, and customer actions across the buying journey to identify which channels, products, and user segments generate the most revenue.
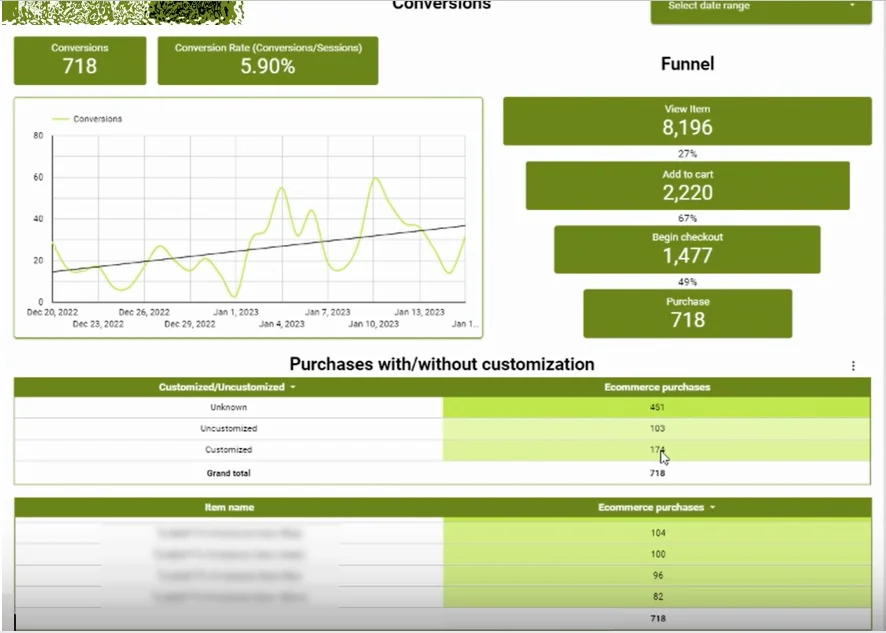
We built this dashboard to analyse sales performance across traffic sources, landing pages, and customer segments. It also uses a custom GA4 parameter to distinguish between customised and standard wristbands, enabling comparison of how product configuration impacts sales. A funnel analysis tracks user progression through each stage of the purchase journey and measures conversion rates between steps. Supporting tables analyse sales by product and compare customised versus non-customised orders to understand their contribution to overall revenue.
This analysis helps ecommerce teams identify which channels and pages drive the most sales and where users drop off in the purchase process. It supports optimisation of traffic allocation, landing pages, and product offerings based on real performance data. As a result, teams can increase conversion rates, improve revenue per visitor, and focus on the highest-performing sales drivers.
Ecommerce marketing analytics focuses on understanding how advertising spend impacts revenue and profitability. It combines sales and marketing data to evaluate which channels drive results and whether campaigns generate profitable growth.
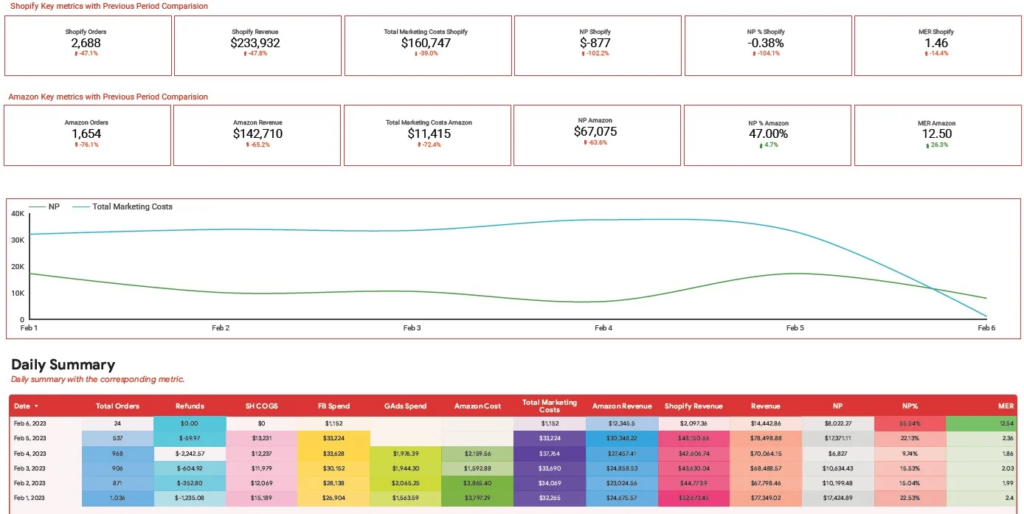
Our marketing analytics agency built this dashboard for an ecommerce brand selling on Shopify and Amazon to analyse the relationship between marketing spend and sales performance. The analysis compares revenue and order data across both platforms and links it with advertising costs from Amazon Ads, Facebook Ads and Google Ads. It evaluates how daily changes in marketing spend affect revenue, net profit, and overall efficiency. A key part of the analysis focuses on measuring profitability after deducting cost of goods sold and marketing expenses, as well as assessing how effectively marketing spend converts into revenue.
This analysis helps ecommerce teams understand which channels contribute to profitable growth and how marketing costs impact overall performance. It supports better budget allocation, improves visibility into profit margins, and enables teams to scale campaigns that generate the highest return.
Customer analytics focuses on understanding how customers behave across their lifecycle, from first purchase to repeat orders and long-term value. It helps ecommerce teams segment customers, track retention, and identify which groups drive the most revenue over time.
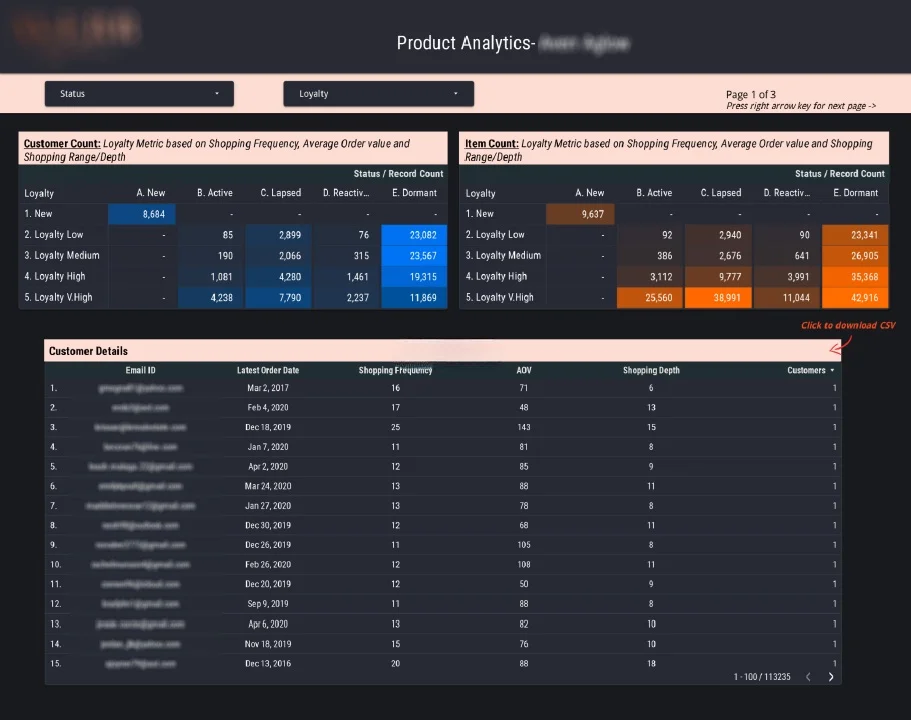
Our Looker Studio consultants built this dashboard using Shopify data to analyse customer loyalty and retention patterns. The analysis assigns a loyalty score between 0 and 1 based on average order value, purchase frequency, and product variety. It also segments customers by recency of purchase into groups such as new, active, lapsed, reactivated, and dormant. By combining loyalty scoring with lifecycle segmentation, the dashboard enables analysis of how different customer groups behave and transition over time.
This analysis helps ecommerce teams identify high-value and at-risk customers and target them with relevant campaigns. It supports retention strategies by highlighting which segments require re-engagement and which customers are most likely to generate repeat purchases.
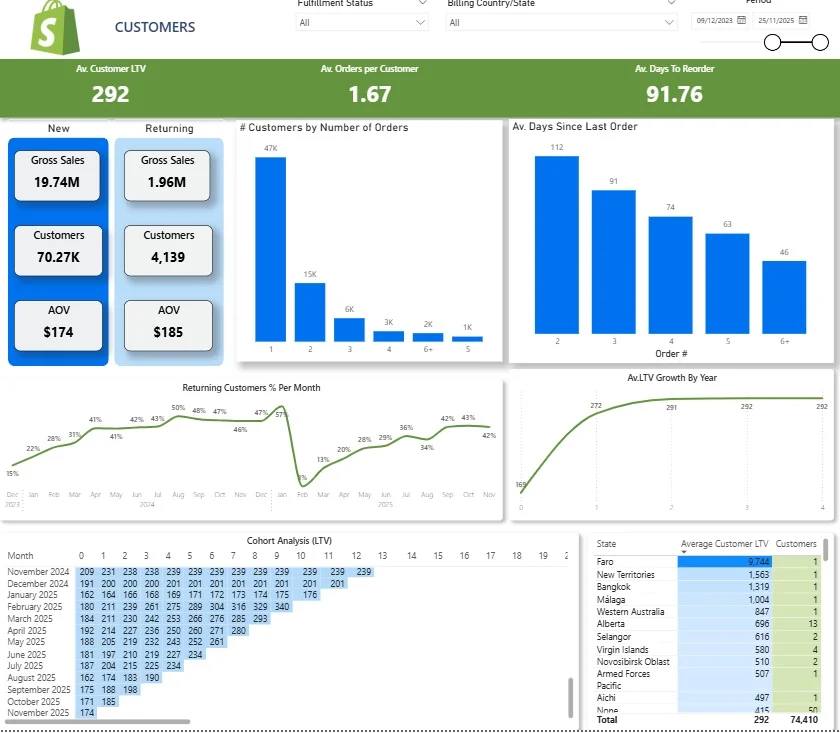
This dashboard analyses how customers behave over time, with a focus on repeat purchases, retention patterns, and long-term value. The analysis compares new and returning customers to understand their contribution to revenue and average order value. It examines how frequently customers place orders and measures the time between purchases to identify typical buying cycles.
A key part of the analysis focuses on how customer lifetime value evolves over time, including cohort analysis that groups customers by their first purchase date and tracks how their value develops. It also analyses geographic differences in customer value to identify regions that generate higher long-term returns.
This analysis helps ecommerce teams understand which customers drive long-term revenue and how quickly they become profitable. It supports more accurate customer acquisition budgeting, improves retention strategies, and enables better timing of re-engagement campaigns.
Ecommerce SEO analytics focuses on evaluating how organic search contributes to website traffic and overall performance. It helps teams understand traffic trends and identify which pages attract visitors from search engines.
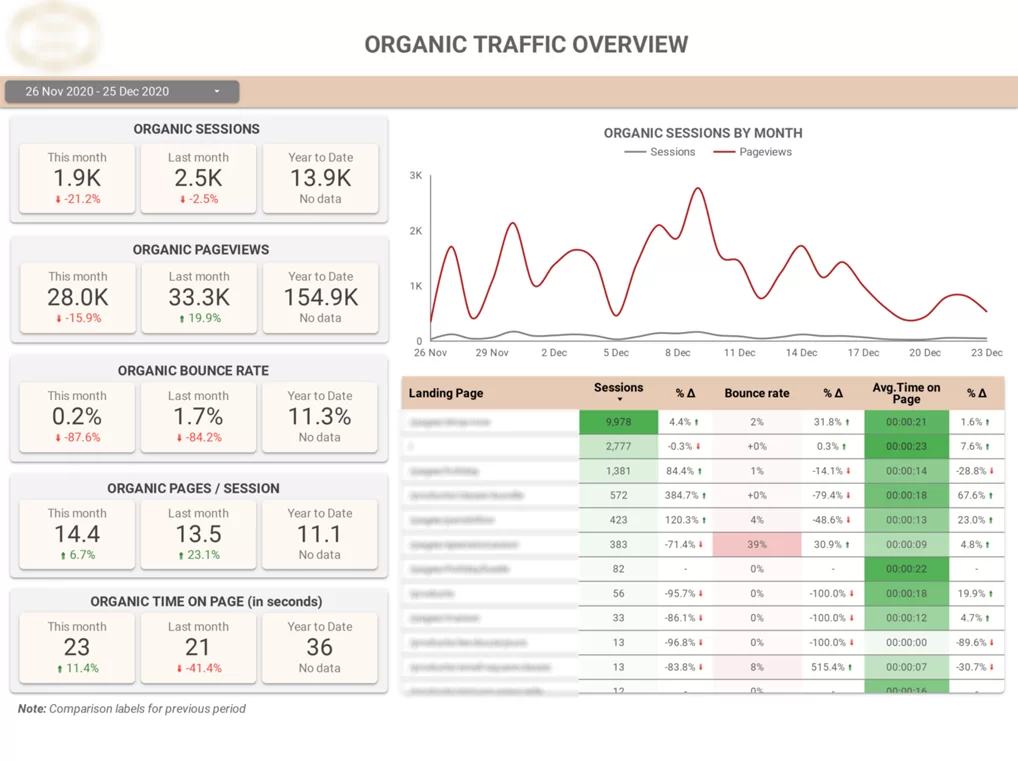
Our data visualization consultancy built this Looker Studio dashboard to analyse organic search performance using Google Analytics and Google Search Console data. The analysis focuses on tracking sessions and pageviews over time, with daily trends and month-over-month comparisons to monitor growth. It also examines landing page performance by breaking down sessions, bounce rate, and average time on page, helping identify which pages drive the most traffic and how users engage with them.
This analysis helps ecommerce teams understand how organic traffic evolves and which landing pages perform best. It supports content optimisation and prioritisation of pages that attract and engage users, improving overall SEO performance.
Ecommerce supply chain analytics focuses on tracking how products move from purchase to sale and how inventory levels impact financial performance. It helps businesses understand stock availability, sales flow, and the relationship between inventory investment and revenue generation.
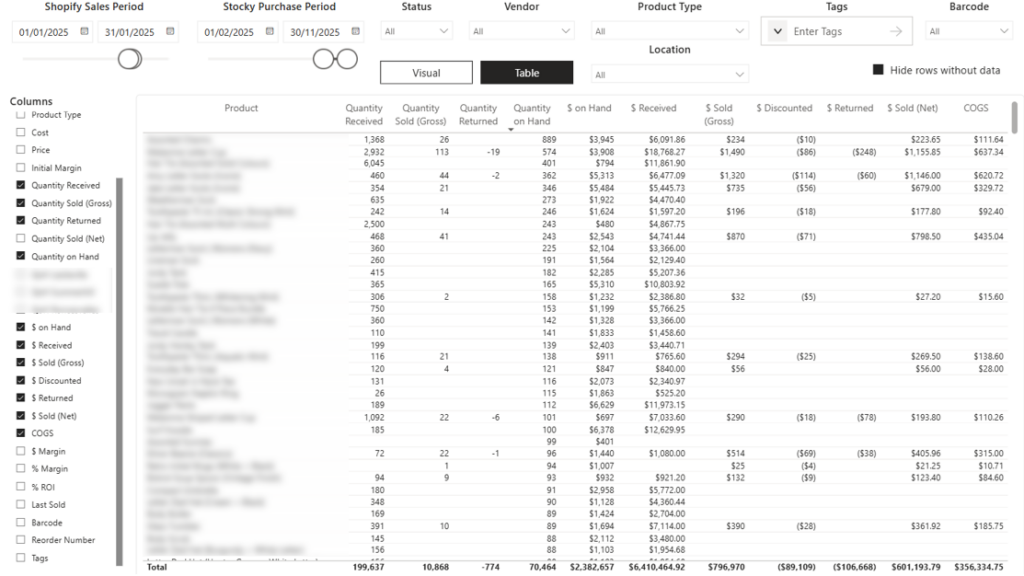
Our Tableau experts built this dashboard by combining Shopify sales data with inventory data from the Stocky app to analyse product-level supply chain performance. The analysis focuses on how inventory moves from purchase to sale and how effectively stock is converted into revenue. It highlights the relationship between incoming stock, sales activity, and remaining inventory to identify overstocking, understocking, and slow-moving products. By filtering data by Shopify sales period and Stocky purchase period, the dashboard enables clear comparison between purchasing decisions and actual sales outcomes over time.
This analysis helps ecommerce teams maintain optimal stock levels, reduce overstocking and stockouts, and understand the financial impact of inventory decisions. It supports better purchasing planning, improves cash flow management, and ensures that inventory investments are aligned with actual sales performance.
Ecommerce operational analytics focuses on monitoring how efficiently day-to-day processes support order fulfilment and customer experience. It helps teams track how orders are processed, shipped, and delivered, and identify bottlenecks that impact performance.
In our projects, we typically build dashboards that analyse operational workflows using data from ecommerce platforms, logistics systems, and fulfilment tools. The analysis focuses on order processing times, fulfilment speed, delivery performance, and return handling. It connects operational metrics with order volume and customer activity to understand how workload impacts performance and where delays occur.
This analysis helps ecommerce teams improve fulfilment efficiency, reduce delays, and maintain consistent service levels. It supports better resource planning, faster issue resolution, and a more reliable customer experience across the entire order lifecycle.
Ecommerce competitor analysis focuses on understanding how a business performs relative to others in the market. It involves comparing pricing, product offerings, promotions, and marketing activity to identify differences in positioning and performance.
This type of analysis typically looks at how competitors price similar products, how often they run promotions, and how visible they are across channels such as search and paid advertising. It also examines how these factors influence customer demand and purchasing behaviour.
As a result, ecommerce teams can identify gaps in their strategy, adjust pricing and promotions, and improve their market positioning based on real competitive insights.
Ecommerce customer experience analytics focuses on evaluating how users perceive and interact with a website throughout their journey. It helps identify friction points that affect usability, satisfaction, and the overall quality of the shopping experience.
This type of analysis typically examines factors such as page load speed, checkout usability, navigation clarity, and return or refund experience. It looks at where customers encounter difficulties, how smoothly they can complete key actions, and how different elements of the experience impact their likelihood to convert or return.
As a result, ecommerce teams can improve website usability, reduce friction in the checkout process, and deliver a more seamless and consistent experience. This leads to higher customer satisfaction, improved retention, and stronger long-term performance.
Business intelligence gives ecommerce teams a clear view of performance across the entire business. By bringing sales, marketing, customer, and operational data into one place, it becomes much easier to understand what is happening and why. Instead of switching between multiple tools, teams can rely on a single source of truth to track results and make decisions.
One of the main benefits is speed. With automated dashboards, data is updated in real time, allowing teams to react quickly to changes in performance. This reduces reliance on manual reporting and ensures that decisions are based on the most recent data available. One client reduced report generation time from 48 hours to under 5 minutes and improved decision-making speed by 40%.
Business intelligence also improves accuracy by reducing manual data handling and standardising reporting processes. When data is centralised and automated, the risk of errors decreases significantly. In one project, automated data pipelines reduced data-entry errors by 80% and increased data integrity across business units to 99.7%.
Another key benefit is better visibility into what drives revenue. Ecommerce teams can clearly see which products, channels, and customer segments contribute the most to growth. This makes it easier to focus efforts on what works and avoid wasting resources on low-performing areas. For example, improved visibility into usage and performance data enabled a client to increase service revenue by 20% while reducing costs.
Finally, BI supports scalability by making reporting easier to maintain and adopt as the business grows. Instead of relying on manual processes, teams can use structured dashboards that are accessible across the organisation. In one case, a client achieved 100% transition from a legacy reporting system to Power BI within 4 weeks and increased report usage by 25%.
While business intelligence provides clear value, implementing it in ecommerce comes with several challenges. Most issues come from how data is stored, managed, and connected across different systems.
One of the main challenges is data fragmentation. Ecommerce data is spread across platforms like Shopify, Google Analytics, ad networks, and inventory systems, making it difficult to get a consistent view of performance. The most effective way to solve this is to automate data extraction and centralise it in a business intelligence data warehouse. This creates a single source of truth and removes the need to manually combine data from different tools.
Data accuracy is another common issue. When data is pulled from multiple sources, inconsistencies can appear due to tracking gaps, different attribution models, or incorrect setups. To address this, many businesses rely on proven free Power BI dashboard templates that already include the correct logic and formulas for calculating ecommerce metrics. This reduces the risk of errors and ensures that reporting is consistent.
Many ecommerce businesses also rely on manual reporting processes. Exporting data, combining spreadsheets, and updating reports manually takes time and increases the risk of errors. It also makes it difficult to scale reporting as the business grows. The solution is to automate reporting by connecting data sources into a central BI system with scheduled refreshes. Power Automate consulting services help eliminate manual work and ensure dashboards stay up to date.
Another challenge is choosing the right metrics. With so much data available, teams often track too many KPIs or focus on metrics that don’t directly support decisions. A more effective approach is to structure dashboards around specific business processes such as marketing, inventory, or sales. This makes it easier to select the metrics that actually help optimise each area, following a clear enterprise BI strategy.
Finally, building and maintaining BI systems requires technical expertise. Setting up data pipelines, dashboards, and integrations can be complex, especially for smaller teams. In many cases, businesses solve this by working with experienced ecommerce analytics consultants who understand both the data sources and the tools required to build a reliable BI setup.
Implementing business intelligence in ecommerce starts with understanding how the business actually works. Before building dashboards, it’s important to define what decisions need to be supported and what questions the data should answer. This ensures that the solution is built around real use cases rather than generic reporting, following established BI best practices.
A key part of any BI setup is bringing data from different systems into one place. Ecommerce businesses typically rely on multiple platforms, such as Shopify, Google Analytics, and advertising channels. Without centralising this data, it becomes difficult to maintain consistency and get a complete view of performance.
It’s also important to focus on a small set of meaningful metrics. Tracking too many KPIs often creates confusion and makes dashboards harder to use. Instead, the focus should be on metrics that directly support decisions, such as revenue drivers, marketing efficiency, and customer behaviour.
Automation plays a major role in making BI sustainable. Data should be updated automatically and reports should refresh without manual effort. This ensures that teams always work with current data and reduces the time spent on repetitive tasks.
Finally, BI systems should evolve with the business. As new channels, products, or processes are introduced, the data model and dashboards need to be updated. A flexible setup makes it easier to adapt and continue getting value from business intelligence over time.
Ecommerce business intelligence relies on a combination of tools that handle data visualisation, storage, and integration. Each plays a specific role in turning raw data into structured insights.
Power BI is widely used for building interactive dashboards and reports. It allows teams to analyse large datasets, create custom KPIs, and share insights across the business. Its main advantage is flexibility, as it can handle complex data models while remaining accessible to non-technical users.
Tableau is another leading data visualisation tool, known for its strong visual capabilities. It is often used when businesses need more advanced and highly customised visual analysis. Tableau makes it easier to explore data patterns and present insights in a clear format.
Looker Studio is commonly used for marketing and web analytics reporting. It connects easily with tools like Google Analytics, Google Ads, and other marketing platforms. Its main benefit is simplicity and fast setup, making it ideal for building dashboards focused on traffic and campaign performance.
Data warehouses such as BigQuery, Snowflake, and Azure SQL are used to store and organise data from multiple sources. They create a central place where data is cleaned, structured, and prepared for analysis. This ensures consistency and allows businesses to work with large volumes of data efficiently, which is why many companies work with experienced data warehouse consultants when building their BI infrastructure.
Data integration tools are responsible for extracting and moving data from platforms like Shopify, Google Analytics, and advertising channels into the data warehouse. This can be done using APIs, custom scripts, or through custom data connectors. They are often used when businesses need more control over how data is structured and refreshed.
In practice, the effectiveness of ecommerce BI depends less on the individual tools and more on how well they are connected. A well-structured setup ensures that data flows reliably from source systems into dashboards, providing accurate and consistent insights across the business.
The future of ecommerce business intelligence is being shaped by rapid technological advancements and evolving customer expectations. As ecommerce businesses generate ever-increasing volumes of data, the role of business intelligence software and tools will become even more critical in helping companies analyze, interpret, and act on this information. Emerging technologies such as artificial intelligence, machine learning, and the Internet of Things (IoT) are set to revolutionize business intelligence, enabling more advanced predictive analytics, automated decision-making, and highly personalized customer experiences.
The integration of third-party data sources, including social media and customer review platforms, will provide ecommerce companies with deeper insights into customer preferences and market dynamics. As business intelligence tools become more sophisticated, ecommerce businesses will be able to identify trends faster, optimize marketing strategies, and anticipate customer needs with greater accuracy.
Looking ahead, investing in business intelligence software and fostering a data-driven culture will be essential for ecommerce companies aiming to stay competitive, drive innovation, and achieve sustained business growth. By embracing the latest business intelligence solutions, ecommerce businesses can unlock new opportunities, deliver exceptional customer experiences, and secure their place at the forefront of the digital marketplace.
Ecommerce business intelligence gives teams a structured way to understand performance and act on it. By connecting data across sales, marketing, customers, and operations, it becomes much easier to identify what drives results and where to improve.
The examples in this article show how BI can be applied across different areas of an ecommerce business. When implemented correctly, it creates a consistent foundation for decision-making, helping teams move faster and operate with more confidence.
If you’re looking to build or improve your ecommerce BI setup, our team can help. We design and implement custom dashboards and data solutions tailored to how your business actually works.
Contact us to discuss your requirements and see how we can support your ecommerce analytics!
![]()
![]()
![]()