Data analytics for car dealers involves analysing the dealership sales, marketing and inventory data to optimise performance. Car dealers who use it have an edge because it helps them to respond quickly to market shifts and have more control over business development.
In this article, we’ll cover everything you need to know to start using data analytics as a competitive advantage over your car dealership competitors.
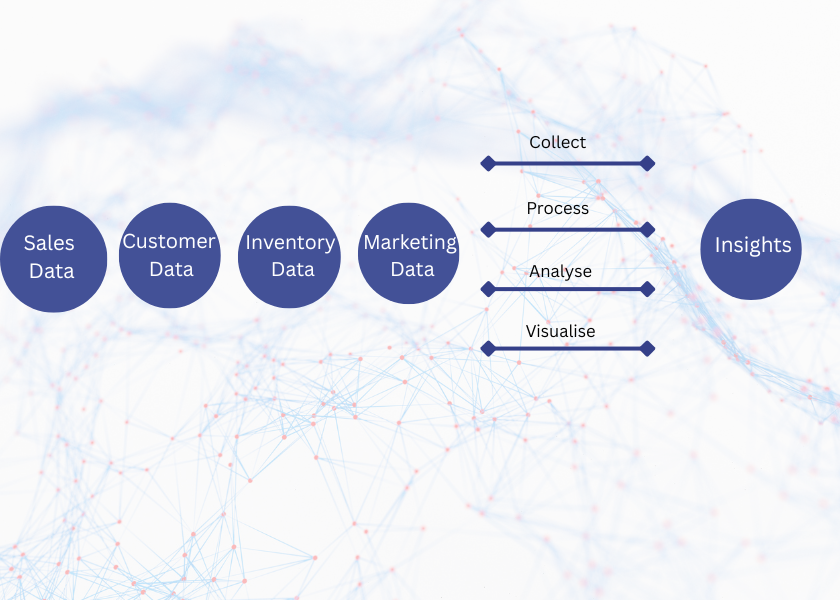
Data analytics for car dealers is the process of collecting, processing, analysing, and visualising data from sales, customers, inventory, and marketing to gain insights that help you:
Whether you’re a one-person dealer or running a full dealership, data analytics helps you see your business more clearly and make more informed decisions. With data analytics, you can:
Let’s look at real-world examples of this in action.
As a data analytics consultancy, we have helped many car dealerships go from raw data to tangible business results. In this article, we’ll use two examples to show how analytics creates real value in your industry.
Automotive marketing analytics mainly involves analysing the online marketing data to understand what products are in demand, increasing the volume of leads and crafting enticing offers. The main data sources for marketing analytics are Google Analytics 4, pay-per-click platforms (e.g. Facebook Ads, Google Ads, Bing Ads, etc) and local search engines (e.g. Google Maps).
We have been working with a marketing agency that specialises in supporting car dealerships for 2+ years. Our role was to track key website events in Google Analytics and then translate that raw data into insights the dealers could act on. (You can read the client’s review here.)
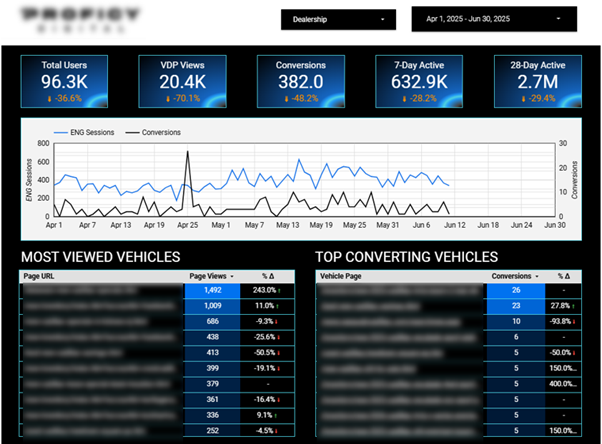
We built this dashboard to help the client track 3 key metrics on their website:
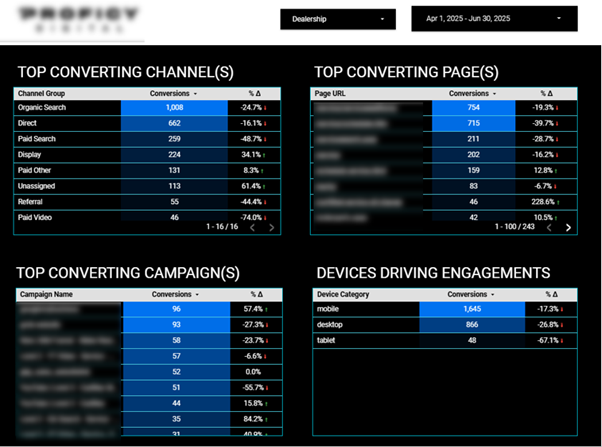
This other dashboard here helped the client identify which marketing channels generated the highest converting traffic, which campaigns were working, and even which devices (mobile, desktop, or tablet) were driving the most engagement.
They stopped wasting ad spend on underperforming campaigns, doubled down on those that brought in genuine buyers, and ran re-marketing campaigns to people who showed interest but didn’t convert the first time.
Automotive sales analytics is all about analysing the sales performance of each dealership, salesperson and product. Sales analytics helps car dealerships to plan their inventory, forecast financial performance and plan for promotions.
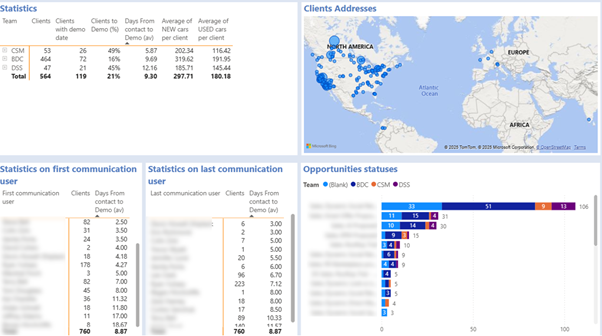
We collaborated on an automotive sales analytics project with a car manufacturer to help them track the daily activities of their sales agents and assess their impact on conversions. The key KPIs we analysed were:
As you can see in the screenshot above, those KPIs were tracked on a simple dashboard, allowing the dealership to identify which agents were more successful at converting leads to clients and who were converting conversations to demos more quickly.
This helped them balance the workload of the agents, plan targeted training, and shorten the time to move customers from first contact to demo.
| Category | Metric | Description |
| Inventory & Pricing | Inventory Turn | Shows how many times you sell and replace your whole stock in a year. |
| Days to Turn / Age Buckets | How many days to sell a vehicle and age buckets (e.g. 0–15, 16–30 days); shows slow moving stock and aging risk. | |
| Market Day Supply vs. Local Demand Signals | How many days current inventory would last at current sales rates vs. local market demand; helps with stocking levels. | |
| Cost-to-Market / Price-to-Market Bands | How vehicle prices and acquisition costs compare to market average; guides discount timing and competitive positioning. | |
| Acquisition to Frontline Time | How long it takes to get a car ready for sale (to the frontline) after buying it. | |
| Marketing & Sales | Lead Response Time | Measures how fast your team replies to new leads. |
| Contact Rate | Shows the share of qualified leads your team actually reaches. | |
| Appointment Set/Show | Tracks how many leads schedule and show up for appointments. | |
| Close Rate | Tells you the percentage of leads or appointments that turn into real sales. | |
| Cost per VDP View | Shows how much you spend to get one person to view a vehicle listing online. | |
| Cost per Sold | Divides your total marketing and sales spend by the number of cars sold. | |
| Units per Employee | Measures how many cars each staff member sells. | |
| Service & Retention | Effective Labour Rate | Tells you the average revenue you earn for each billed service hour. |
| Hours Sold per Repair Order | Shows the average technician hours billed per repair. | |
| Gross % | Tracks your gross profit margin (the amount of revenue left after deducting the cost of the cars sold) | |
| CSI/Retention | Combines customer satisfaction scores and repeat visits to measure loyalty. | |
| Fixed Coverage / Absorption | Shows how much of your overhead is covered by service and parts. |
Getting started with analytics in your dealership will be a smoother journey if you establish the right process from the outset. Begin this way:
To start seeing real results from your analytics effort and investment, you should:
Once you’ve nailed the basics, you can start letting data handle more of the work for you.
Using analytics in your car dealership business will certainly pay off, but it could backfire if you fail to use it responsibly.
Data analytics gives car dealers the clarity to sell smarter, manage stock better, and protect profits in a fast-moving market. Start small, focus on the right KPIs, and build from there. The results will follow.
If you need help from experienced data analytics consultants, please reach out to us today! Our consultants have helped 600+ clients to achieve their data analytics needs. We would be excited to bring our experience into your project!
Dealerships use data analytics to track sales, manage inventory, understand customer demand, and enhance marketing outcomes.
Important KPIs to track are sales performance, inventory turn, lead response time, and close rate.
Analytics helps you price used cars competitively, reduce how long they sit on the lot, and cut reconditioning delays.
To get started, you will need your existing sales and inventory data, along with a simple dashboard tool like Power BI or Excel.
![]()
![]()
![]()