
Data analytics in healthcare examples show how organisations use data from clinical and operational systems to support decision-making. These examples highlight how data from sources like EHRs, medical devices, and billing platforms is structured, analysed, and applied across patient care, operations, and financial management. By bringing this data into a single reporting environment, healthcare analytics provides a clear and consistent view of performance across the organisation.
As a healthcare analytics consulting, we have delivered 1,000+ custom data analytics solutions across healthcare and related industries, including patient monitoring, operational reporting, and financial analytics. These solutions are designed to handle complex data environments, integrate multiple systems, and provide reliable reporting that supports day-to-day decisions.
This article presents practical data analytics in healthcare examples to show how analytics is applied in real scenarios. It covers key types of analytics, use cases across clinical and operational areas, as well as the benefits, challenges, tools, and future trends shaping healthcare analytics.
Data analytics in healthcare refers to the systems and processes used to collect, organise, and analyse data from clinical and operational sources. This includes data from electronic health records (EHRs), medical devices, billing systems, and patient management platforms. In many cases, organisations work with a business intelligence consultant for healthcare to design these systems and ensure data is structured and accessible for reporting.
The focus is on structuring large volumes of data into a consistent format that can be analysed and reported. This involves building data pipelines, defining metrics, and creating dashboards that present key information clearly.
In practice, healthcare analytics provides the foundation for reporting and monitoring across the organisation. It enables teams to access accurate data, track performance, and maintain visibility over both patient care and operational processes.
Big data analytics in healthcare refers to the process of analyzing vast and complex datasets to uncover patterns, trends, and insights that would be impossible to detect with traditional methods. By leveraging big data, healthcare organizations can implement predictive analytics to identify high-risk patients, optimize treatment plans, and support population health management initiatives.
With access to large volumes of patient data, including clinical records, medical imaging, and real-time monitoring from wearable devices, healthcare providers can develop personalized care strategies that improve patient outcomes. Big data analytics also enables the identification of emerging health trends, allowing medical professionals to implement proactive measures and targeted interventions before issues escalate.
Furthermore, big data analytics enhances diagnostic accuracy by integrating information from multiple sources, reducing the likelihood of medical errors and supporting evidence-based decision-making. Healthcare organizations can also use big data to allocate resources more effectively, streamline clinical workflows, and reduce unnecessary costs. By harnessing the power of big data, the healthcare sector is better equipped to deliver high-quality, efficient, and patient-centered care.
Data analytics plays a central role in helping healthcare organisations use data to support decisions across clinical, operational, and financial areas. It connects information from multiple systems and presents it in a structured way that teams can use in their daily work.
In clinical settings, analytics supports patient monitoring, early risk identification, and treatment planning. By analysing historical and real-time data, clinicians can make more informed choices and improve the consistency of care.
From an operational perspective, data analytics helps manage resources such as staff, equipment, and hospital capacity. It allows organisations to understand demand patterns, reduce inefficiencies, and keep services running smoothly.
Analytics is also important for financial management. Healthcare providers use it to track costs, monitor revenue, and identify areas where spending can be controlled without affecting care quality.
Overall, data analytics provides a clear and structured view of healthcare operations, helping teams act quickly and manage processes more effectively.
Healthcare data analytics can be divided into different types based on how data is used to support decisions. Each type answers a different question and helps organisations move from understanding past performance to improving future outcomes.
Descriptive analytics focuses on what has already happened. It summarises historical data to show trends and patterns, such as patient volumes, treatment outcomes, or revenue performance. For example, a dashboard showing monthly patient admissions or completed appointments helps teams understand overall activity and performance.
Diagnostic analytics explains why something happened by analysing relationships within the data. It helps identify root causes behind trends, such as why patient engagement dropped or why overtime costs increased. For instance, breaking down missed appointments by department or patient group can reveal underlying operational issues.
Predictive analytics uses historical data to forecast what is likely to happen next. In healthcare, this can include predicting patient deterioration, estimating future demand for services, or identifying patients at high risk of readmission. For example, models can flag patients who may require additional monitoring based on past data.
Prescriptive analytics goes a step further by recommending actions based on data. It helps organisations decide what to do next, such as optimising staffing levels, improving scheduling, or adjusting treatment plans. For example, analytics can suggest how to allocate staff to reduce overtime or improve patient flow.
Data analytics in healthcare can be applied across many different areas, from patient care and operations to marketing, sales, and financial performance. Each use case focuses on a specific type of data and decision-making, but together they show how analytics supports the entire organisation.
Below are real examples of how healthcare providers and related organisations use analytics in practice. These examples highlight how data can be used to monitor patients, improve workflows, optimise costs, and support growth.
Patient analytics helps healthcare teams make better use of the data they collect. With information coming from devices, apps, and clinical systems, it becomes easier to track patient progress, spot early signs of risk, and understand how treatments are working.
This kind of analysis supports both individual patient monitoring and a broader view across populations, helping teams make more informed and timely decisions.
Clinicians often lack detailed, session-level visibility into how patients use connected medical devices and how this impacts their health. Without this level of insight, it is difficult to assess therapy effectiveness, detect irregularities, and make timely, data-driven adjustments to treatment plans.
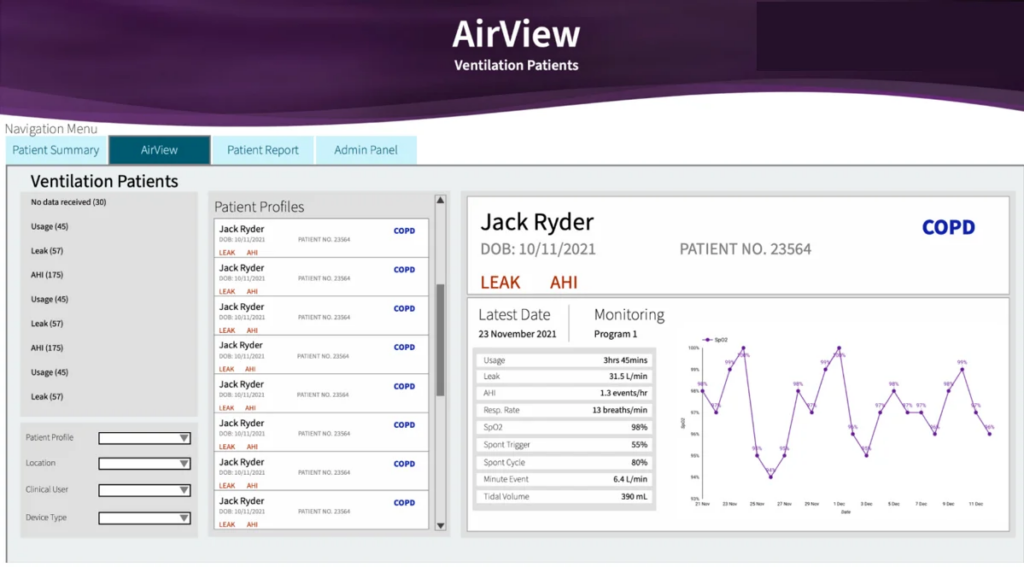
Our Microsoft Power BI consultants developed a dashboard that enables clinicians to analyse individual patient data at a granular level by combining device performance metrics with key respiratory health indicators. Doctors can select a specific patient and review every recorded session, tracking metrics such as session duration and leak rate alongside clinical indicators including respiration rate, AHI (Apnea-Hypopnea Index), SpO2, and tidal volume.
The interactive structure allows clinicians to drill down into specific dates to investigate anomalies or changes in patient condition, as well as analyse trends for individual metrics over time. This makes it possible to monitor therapy consistency, identify deviations in respiratory patterns, and evaluate how effectively the device supports the patient.
Benefits:
Healthcare organisations often lack clear visibility into whether patients are actively using connected devices and consistently transmitting data. Without this insight, it becomes difficult to identify disengagement, detect technical issues, and ensure the effectiveness of remote monitoring programmes.
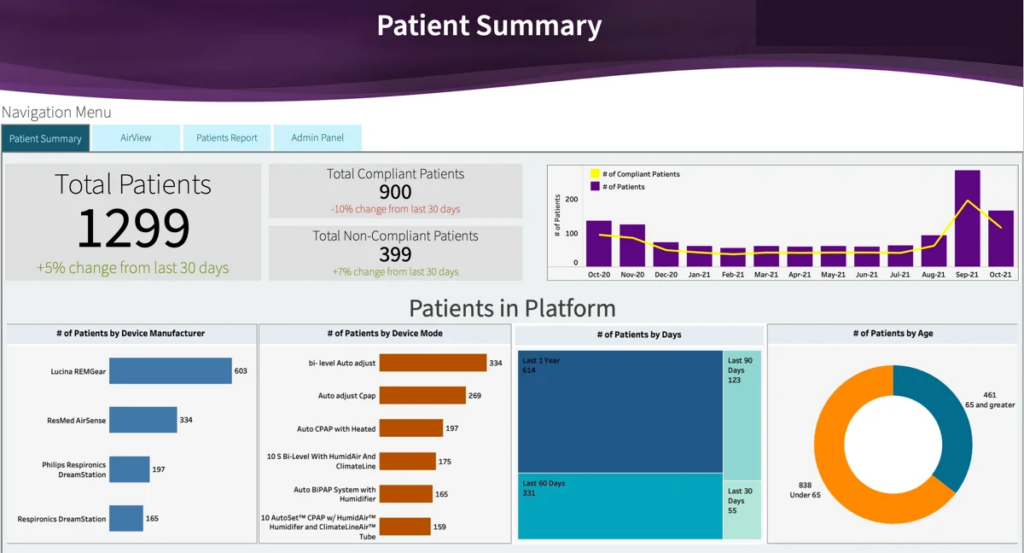
This dashboard enables teams to monitor patient engagement and device activity by analysing compliance and data transmission patterns over time. It tracks compliant and non-compliant patients and evaluates how these figures change month by month to highlight trends and potential drop-offs.
By segmenting patients by device manufacturer, device mode, and age group, the dashboard helps identify whether lower engagement is linked to specific devices or patient cohorts. Activity windows (365, 90, 60, and 30 days) provide additional insight into recent and long-term usage, making it easier to distinguish between temporary inactivity and sustained disengagement.
This level of analysis allows healthcare teams to monitor compliance rates, detect early signs of disengagement, identify inactive devices, and prioritise follow-ups to maintain consistent data flow and patient monitoring.
Benefits:
Healthcare teams often lack a centralised, real-time view of patient data collected across multiple touchpoints. When managing patients, especially those with complex conditions, data is fragmented, making it difficult to track key health indicators, assess overall patient status, and prioritise care effectively.
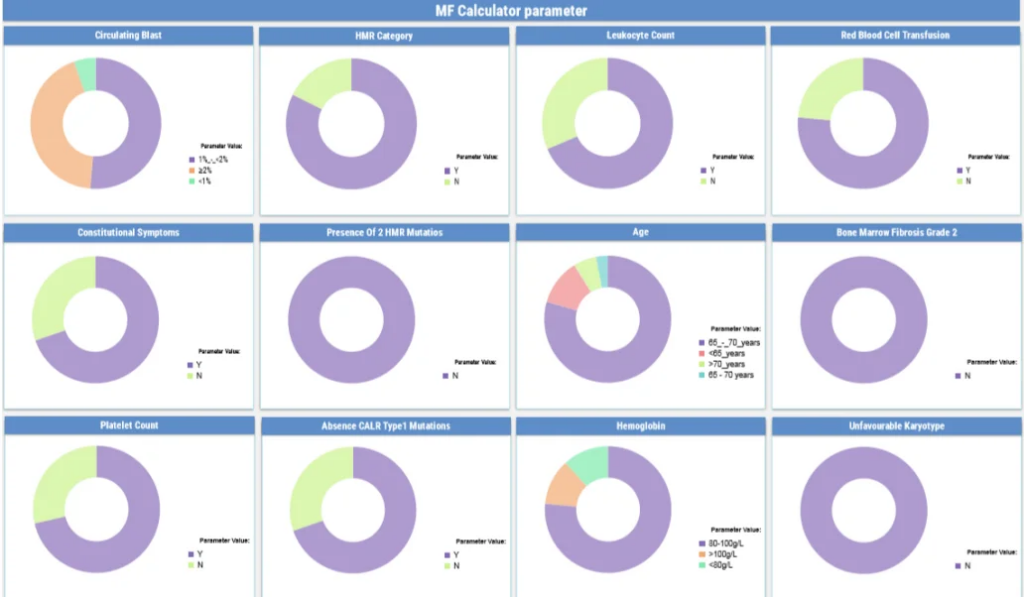
Our Tableau consulting services built a dashboard that provides a real-time overview of the patient population by aggregating clinical data collected through a mobile application into a single interactive view. It enables healthcare professionals to analyse how patients are distributed across key medical indicators using clear visual breakdowns.
By tracking condition-specific parameters, the dashboard allows teams to monitor overall patient health, identify high-risk groups, and detect changes in patient status. Segmented views make it easier to compare patient groups and understand where attention is most needed.
This level of analysis supports continuous monitoring of both health status and risk distribution across the population, helping clinicians prioritise care and respond more quickly to emerging issues.
Benefits:
Operational analytics helps healthcare organisations understand how their day-to-day processes actually run. From scheduling and staffing to referrals and equipment usage, it brings together operational data to highlight gaps, inefficiencies, and areas for improvement.
With the right analytics in place, teams can manage resources more effectively, reduce costs, and ensure that care is delivered consistently without unnecessary delays or disruptions.
Hospitals and care homes often lack a clear, real-time view of patient care activities, making it difficult to ensure that essential medical visits are consistently completed. Tracking attendance across residents, wards, and time periods typically requires manual checks, increasing the risk of missed appointments and gaps in care.
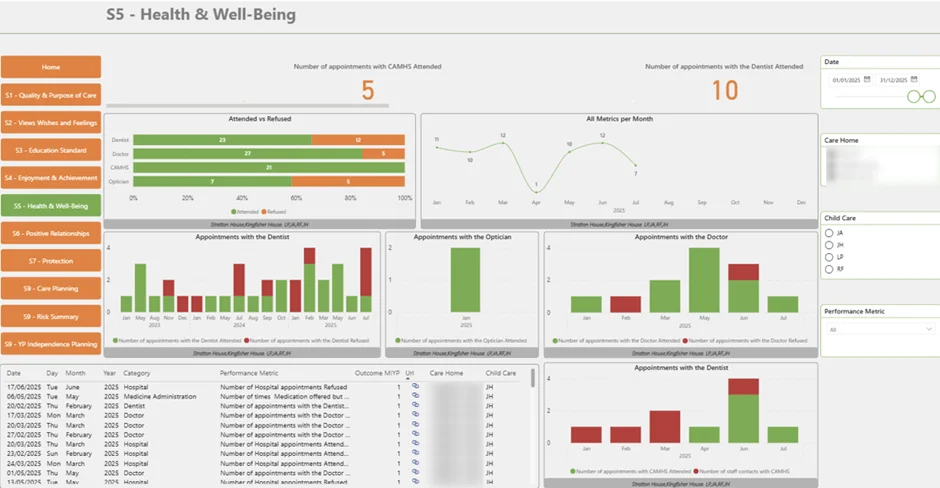
Our Business Intelligence consulting services created this analytics solution to enable teams monitor care scheduling and patient activity in one unified view. It tracks the percentage of residents who attended essential medical visits versus those who declined, providing a clear measure of care delivery performance.
Monthly trends allow teams to analyse how participation changes over time and identify periods where scheduling gaps occur. With filters by ward, unit, and time period, users can drill down into specific areas to detect patterns in missed visits and uncover operational inefficiencies.
This level of analysis supports better coordination of care activities, helping teams ensure that scheduled visits are completed, identify breakdowns in planning or communication, and maintain consistent care standards across the facility.
Benefits:
Healthcare organisations often struggle to control overtime costs while maintaining adequate patient coverage. Due to fluctuating demand and staffing constraints, overtime becomes a regular expense, but without clear visibility, it is difficult to understand cost drivers, manage budgets, and balance workloads effectively.
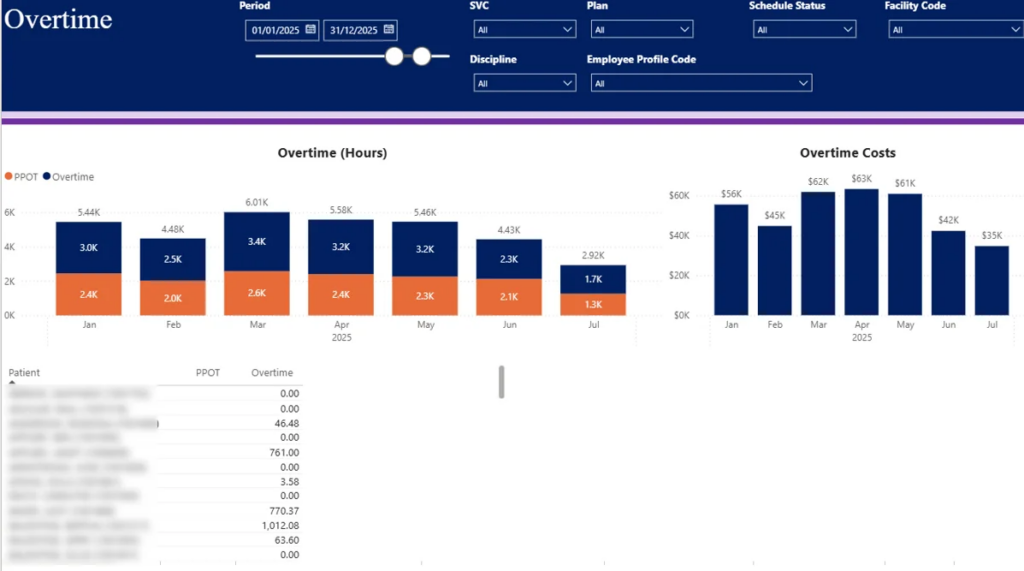
Our team developed an analytics solution that enables organisations to monitor overtime costs and identify the underlying drivers across facilities and roles. It tracks overtime spend by month, allowing leadership to detect seasonal patterns and pinpoint periods where costs spike.
Overtime is segmented into patient-paid overtime (PPOT) and hospital-paid overtime, showing how costs are distributed and where financial pressure is highest. A detailed breakdown by patient highlights which cases or assignments generate additional hours, helping teams understand operational inefficiencies or high-demand scenarios.
With filters by facility, medical discipline, and employee profile, users can analyse overtime trends across departments and roles. This makes it possible to monitor workload distribution, identify imbalances, and evaluate whether staffing levels align with patient demand.
Benefits
Hospitals often lack a clear, consolidated view of where new patients are coming from, making it difficult to track referral patterns and manage relationships with internal and external physicians. Referral data is typically fragmented across systems, limiting visibility into which branches, doctors, or partners drive patient growth.
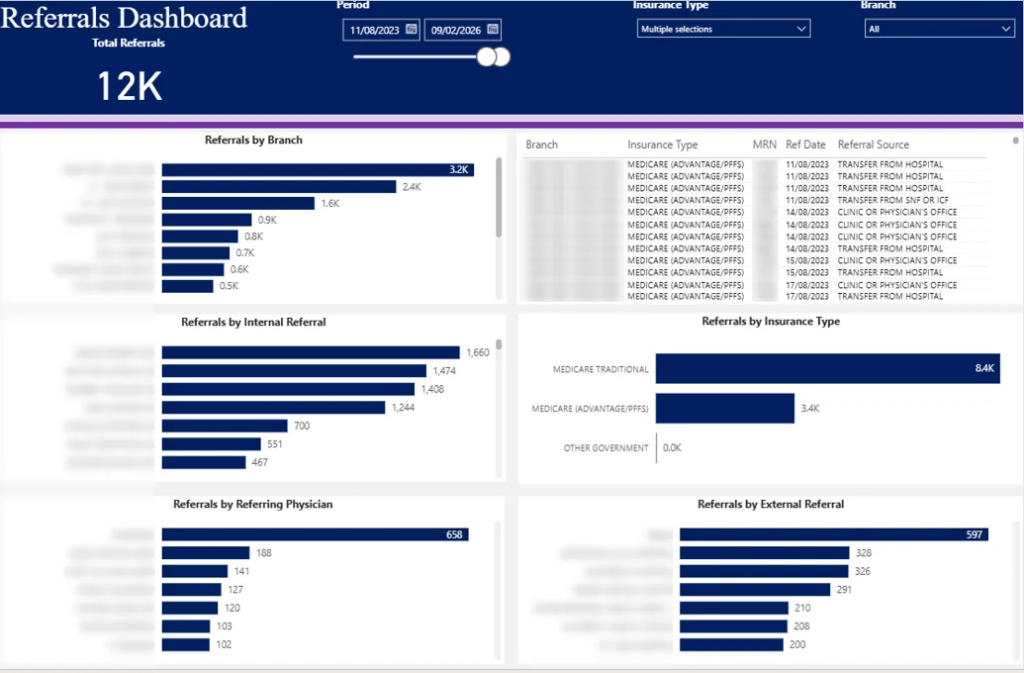
Our Looker Studio consultants built an analytics solution that enables organisations to monitor referral activity across branches, physicians, and sources in a single view. It tracks total referrals by location, allowing leadership to compare performance and identify high- and low-performing branches.
Referrals are segmented into internal and external, providing insight into contribution at both doctor and partner levels. Additional breakdowns by referral source and by insurance type help teams understand patient mix and referral dynamics more deeply.
This makes it possible to analyse referral trends over time, identify key referral partners, detect gaps in underperforming locations, and evaluate how different sources contribute to patient inflow.
Benefits:
Healthcare organisations and medical device manufacturers often lack a structured understanding of equipment condition and component wear. Without proper monitoring, maintenance is typically reactive, leading to unexpected breakdowns, increased downtime, and disruption to patient care services.
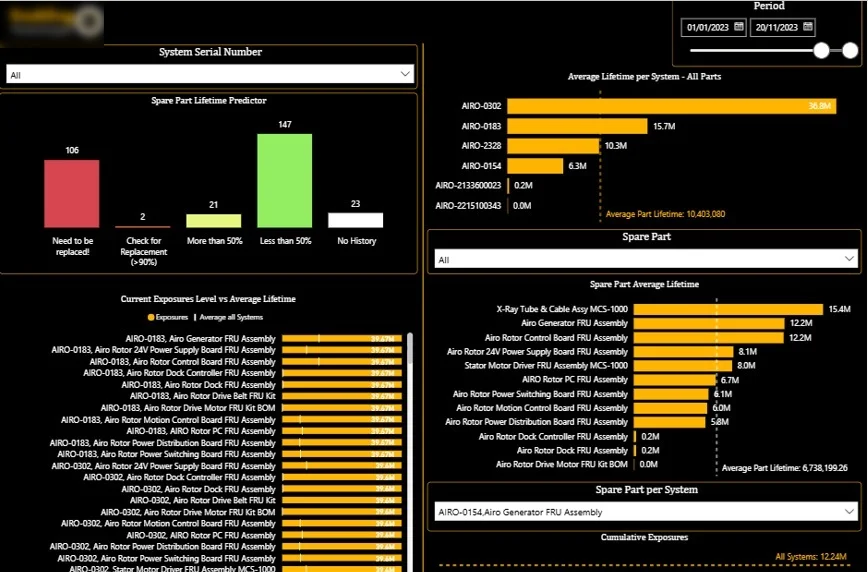
This analytics solution allows teams to track equipment health and maintenance requirements by analysing machinery performance and component lifecycle data. It monitors utilisation and evaluates individual machine parts based on their lifetime in cycles, helping teams assess how equipment performs over time.
Components are grouped by wear level, highlighting those that have exceeded their expected lifespan or are approaching replacement. This supports early failure detection and more proactive maintenance planning. By analysing how quickly parts accumulate usage, organisations can also evaluate whether maintenance schedules are appropriately timed.
This approach supports more effective service planning, optimised spare-part management, and stronger reliability of critical medical equipment.
Benefits:
Marketing analytics in healthcare is often limited by data spread across multiple platforms, making it difficult to connect campaigns with actual patient enquiries. Without a unified view, teams struggle to evaluate lead quality, optimise spend, and identify which channels drive the most effective acquisition.
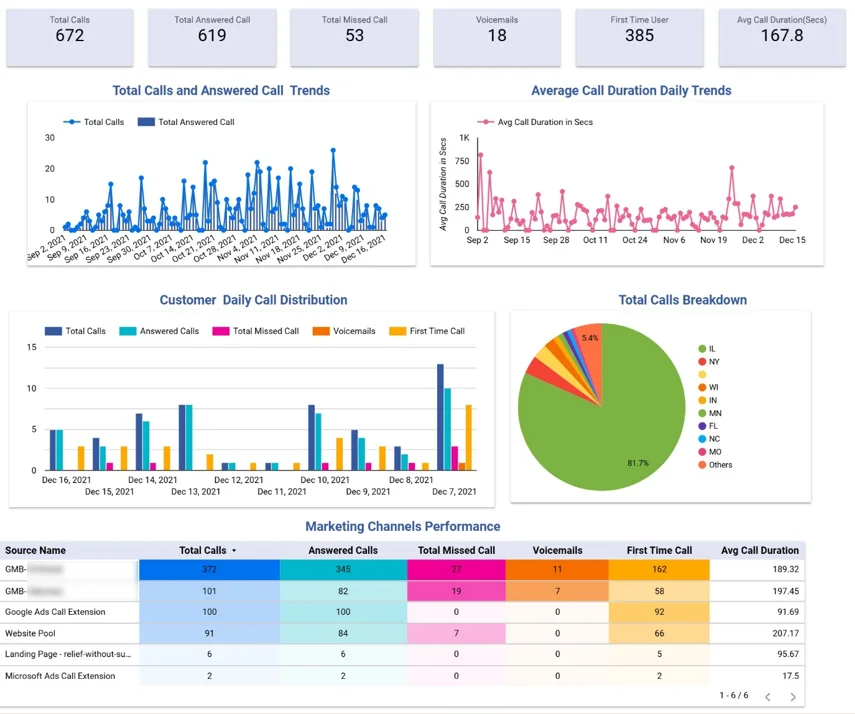
Our marketing analytics agency developed a solution that enables clinics to evaluate how effectively different marketing efforts translate into patient enquiries and where performance gaps occur. By analysing trends over time, teams can identify patterns in demand, assess the impact of campaigns, and detect inconsistencies in enquiry flow. Segmentation of call outcomes helps uncover inefficiencies in how enquiries are handled, highlighting missed opportunities and areas where response processes can be improved.
The dashboard also supports deeper analysis of acquisition quality across channels and locations. It allows teams to compare how different sources contribute not just to volume but to meaningful engagement, helping identify high-performing channels and underperforming ones. This makes it possible to refine targeting, optimise budget allocation, and continuously improve patient acquisition strategies based on actual performance.
Benefits:
Sales analytics in healthcare is often limited by data spread across multiple systems, including CRM tools, operational platforms, and reports. Organisations lack a structured view of commercial performance, making it difficult to measure target achievement and identify underperformance. Without a structured approach, leadership teams rely on manual reporting which reduces the ability to respond to performance gaps.
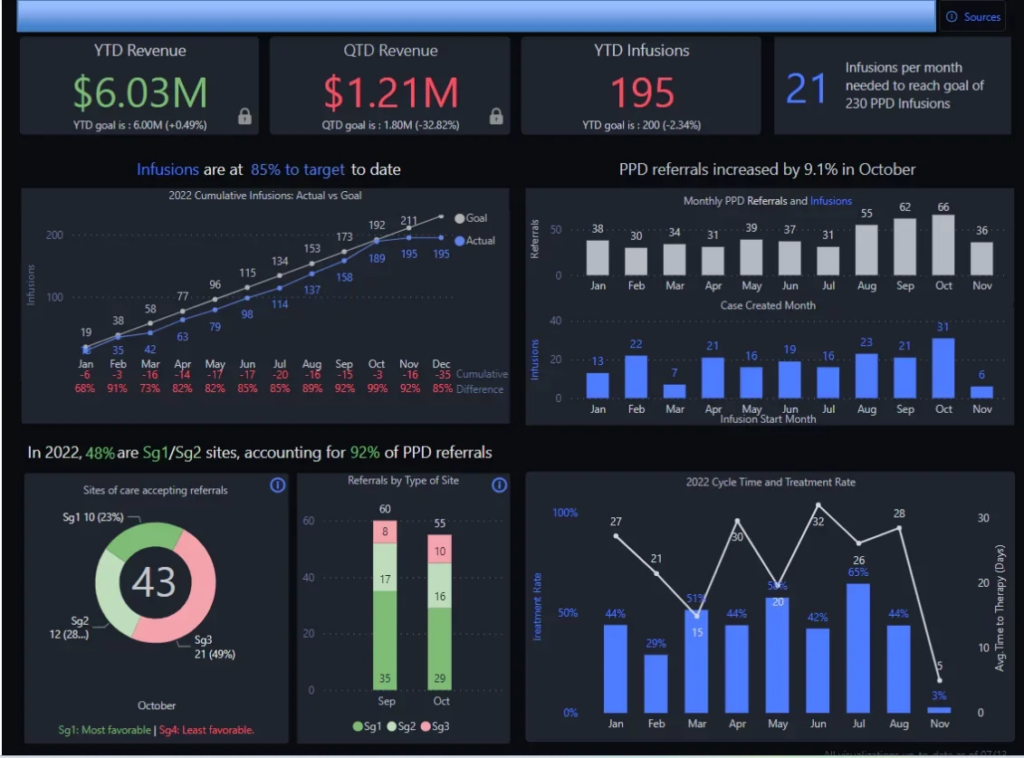
This analytics solution enables executives to evaluate sales performance by combining revenue, infusion activity, and target tracking into a single, structured view. By analysing trends over time, leadership can detect changes in performance, identify declining activity, and assess whether growth is consistent across sites.
The dashboard also supports comparison between actual results and predefined targets, allowing teams to identify gaps and areas falling behind expectations. This makes it possible to monitor sales performance at both a high level and across locations, detect risks early, and take corrective action during reporting periods.
Benefits:
Financial analytics in healthcare is often limited by disconnected data across billing, payroll, and operational systems. Organisations lack a unified view of how revenue, costs, and patient activity interact, making it difficult to assess true financial performance. Without this connection, evaluating profitability at the patient, service, or facility level becomes complex, and identifying margin drivers or inefficiencies requires significant manual effort.
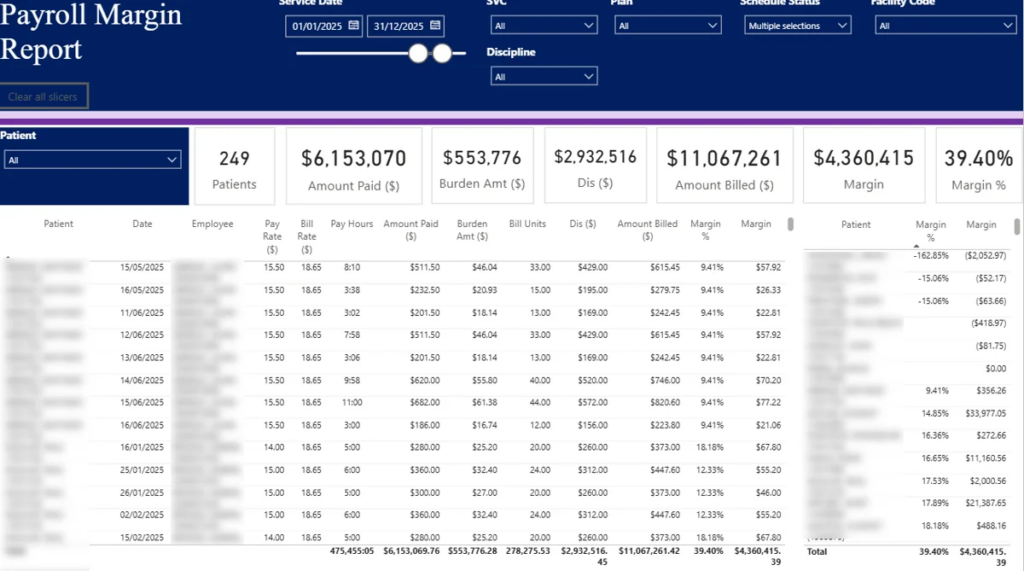
Our bi consultants developed an analytics solution that allows finance and operational teams to assess profitability by linking patient activity, labour inputs, and billing data in a single structured view. It enables analysis of how worked hours, pay rates, and billed rates contribute to margin, making it possible to evaluate financial performance at a detailed level.
By supporting filtering across patients, disciplines, procedures, and facilities, the dashboard allows teams to compare margins across service lines and locations. This helps identify high- and low-performing areas, validate expected charges, and understand how staffing decisions impact overall profitability. The ability to drill into detailed records supports accurate margin verification and more confident financial decision-making.
Benefits:
1. Improved Clinical Decision-Making
Data analytics helps healthcare professionals make faster decisions by combining patient data, treatment history, and real-time insights into a single view. This allows clinicians and leadership teams to quickly identify risks, prioritise actions, and respond to changing conditions with confidence.
In one real-world implementation, access to real-time dashboards led to a 40% faster decision-making process, enabling leadership teams to act on insights without delays and reduce decision bottlenecks.
2. Predictive Maintenance of Medical Equipment
Healthcare providers rely heavily on medical equipment, and unexpected failures can disrupt operations and patient care. Data analytics solves this by tracking usage patterns and performance metrics to predict when maintenance is needed before issues occur.
For example, a medical device company used analytics to monitor equipment health and anticipate failures early. This approach helped increase service revenue by 20% while reducing operational costs, as issues were resolved proactively instead of reactively.
3. Increased Operational Efficiency
Healthcare organisations generate large volumes of data across departments, which often leads to manual reporting and fragmented processes. Data analytics improves efficiency by automating data collection, consolidating systems, and delivering insights through centralised dashboards.
In practice, this led to a 95% reduction in manual data consolidation and reduced report generation time from 48 hours to under 5 minutes, allowing teams to focus more on patient care and less on administrative work.
4. Enhanced Data Accuracy and Compliance
Accurate data is critical in healthcare, where errors can directly impact patient outcomes and regulatory compliance. Analytics systems improve data quality by automating data flows and reducing manual input across multiple systems.
One implementation reduced data-entry errors by 80% and improved data accuracy to 99.7%, ensuring that healthcare teams could rely on consistent and trustworthy information for both operations and compliance reporting.
5. Faster and More Scalable Reporting
Healthcare leaders need timely insights across clinical, operational, and financial areas. Data analytics enables automated, real-time reporting that scales as the organisation grows, without increasing workload.
For example, automated reporting reduced preparation time by over 50%, while providing real-time visibility into key metrics. This allowed teams to act immediately instead of waiting for periodic reports.
6. Better Patient Experience and Engagement
Data analytics helps healthcare providers understand patient behaviour, identify engagement gaps, and personalise care delivery. By analysing usage trends and interaction data, organisations can take proactive steps to improve patient outcomes.
In one case, analytics helped identify declining usage trends early, allowing teams to engage patients sooner. This contributed to improved service delivery and a 20% increase in revenue through better engagement strategies.
Implementing data analytics in healthcare is not just a technical task. It requires aligning systems, data, and people to work together effectively.
While the benefits are clear, most organisations face a consistent set of challenges when trying to scale analytics across clinical and operational processes.
1. Data Integration Across Multiple Systems
Healthcare organisations often rely on disconnected systems such as EHRs, billing platforms, and lab systems. This makes it difficult to create a single, reliable view of operations and patient data.
To overcome this, organisations need to implement centralised data architectures with automated integrations. In many cases, this involves using custom-built Power BI connectors to standardise and extract data from different systems into one unified model.
2. Data Quality and Consistency Issues
Healthcare data is often incomplete, duplicated, or stored in inconsistent formats. This reduces trust in analytics and limits its usefulness for decision-making.
This challenge can be addressed by introducing structured data cleaning processes and validation rules. Automated pipelines can standardise data before it reaches dashboards, ensuring consistency across all reports.
3. Limited Real-Time Data Access
Many healthcare organisations still depend on delayed or batch reporting, which slows down response times and limits the ability to act on emerging issues.
To overcome this, organisations should implement real-time data pipelines and automated dashboards. This ensures that key metrics are continuously updated and available for immediate decision-making.
4. User Adoption and Data Literacy
Even well-designed analytics solutions can fail if healthcare staff do not understand or trust the data. Complex dashboards and lack of training often lead to low adoption.
This can be addressed by designing simple dashboards and providing targeted training. Clear visuals and intuitive layouts help users interpret insights quickly and apply them in their daily workflows.
5. Scalability of Data Infrastructure
As healthcare organisations grow, data volumes increase rapidly. Systems that are not designed for scale can lead to slow performance and limited analytical capabilities.
To overcome this, organisations should adopt scalable cloud-based infrastructure. This allows data systems to handle increasing volumes while maintaining performance and supporting more advanced analytics use cases.
Successfully implementing healthcare data analytics requires a strategic and structured approach.
Healthcare organizations should begin by establishing clear goals and objectives that align with their clinical and operational priorities. Developing a robust data governance framework is essential to ensure that healthcare data is managed securely, ethically, and in compliance with regulations.
Investing in advanced analytics technologies, such as predictive analytics platforms and machine learning tools, enables healthcare providers to extract deeper insights from both historical data and real-time information. Prioritizing data quality is also crucial. Data must be accurate, complete, and standardized to support reliable analysis and reporting.
Healthcare providers should leverage descriptive analytics to identify trends and patterns in historical data, which can inform process improvements and resource allocation. At the same time, applying predictive analytics helps forecast future outcomes and supports proactive decision-making.
By following these best practices, healthcare organizations can maximize the value of their data analytics initiatives, leading to enhanced patient care, improved operational efficiency, and reduced healthcare costs.
Healthcare organisations rely on a combination of analytics tools to collect, process, and visualise data across clinical and operational systems. The right toolset depends on how complex the data is, how many systems are involved, and how advanced the analysis needs to be.
Power BI is one of the most widely used tools in healthcare for building interactive dashboards. It allows teams to combine data from multiple systems and track key metrics such as patient outcomes, operational performance, and financial results in one place. Its flexibility makes it suitable for both clinical teams and leadership.
Tableau is another popular visualisation tool, particularly in larger organisations that require more advanced and custom reporting. It is often used to explore trends in patient data, treatment effectiveness, and operational efficiency through highly interactive visuals.
SQL databases such as Microsoft SQL Server and PostgreSQL form the foundation of most healthcare analytics systems. They store structured data from core systems like EHRs and billing platforms, and enable efficient querying and transformation for downstream analysis.
For more advanced analytics, tools like Python and R are used to build predictive models and perform statistical analysis. These tools support use cases such as patient risk scoring, disease prediction, and treatment optimisation, going beyond standard reporting.
Cloud data warehouse platforms such as Snowflake, Google BigQuery, and Azure Synapse allow healthcare organisations to centralise large volumes of data from multiple sources. They provide the scalability and performance needed for real-time analytics, while enabling seamless integration with BI tools and reporting systems. In practice, these platforms are typically implemented and optimised by cloud data warehouse consulting that design data models, manage performance, and ensure reliable data pipelines.
Finally, ETL and data integration tools such as Azure Data Factory are used to automate data movement and transformation. They ensure that data flows consistently between systems and is properly structured for accurate and reliable analysis.
Data analytics in healthcare is moving beyond reporting and into real-time, predictive, and automated decision-making. As data volumes grow and technology evolves, analytics is becoming a core part of how healthcare organisations operate and deliver care.
One of the key trends is the shift towards predictive and preventive care. Advanced analytics models are increasingly used to identify patient risks early, forecast disease progression, and support more proactive treatment plans. This enables early intervention to prevent the progression of chronic diseases, improve patient outcomes, and reduce hospitalizations.
Another major development is the adoption of real-time analytics. With modern data platforms and automated pipelines, healthcare teams can access up-to-date information on operations, patient flow, and resource utilisation. This enables faster responses to changing conditions and more efficient day-to-day management.
Artificial intelligence is also playing a growing role in healthcare analytics. AI models are being used to analyse complex datasets, automate diagnostics, and support clinical decision-making. This reduces the manual workload on healthcare professionals while improving accuracy and consistency.
Finally, analytics is becoming more accessible across healthcare organisations. With intuitive dashboards and user-friendly tools, more teams can use data in their daily workflows without needing technical expertise. This shift is helping embed data-driven decision-making across all levels of the organisation.
Data analytics in healthcare examples show that analytics is no longer optional. It has become a core part of how organisations manage patient care, operations, and financial performance.
From monitoring patients and optimising workflows to improving reporting and planning, analytics provides the structure needed to manage complex healthcare systems effectively. When implemented correctly, it supports faster decisions, better resource allocation, and more consistent care delivery.
However, success depends on more than just tools. It requires the right data architecture, clear processes, and solutions that are tailored to how your organisation operates.
If you’re looking to implement or improve data analytics in your healthcare organisation, the next step is to build a solution that fits your systems and workflows. Contact us to discuss how you can design and deploy a data analytics setup that supports your clinical and operational goals!
![]()
![]()
![]()