Power BI architecture represents the end-to-end flow from data sources through semantic models to reports, dashboards, and sharing in the cloud. Understanding this architecture is essential for building reliable, governed, and performant analytics solutions.
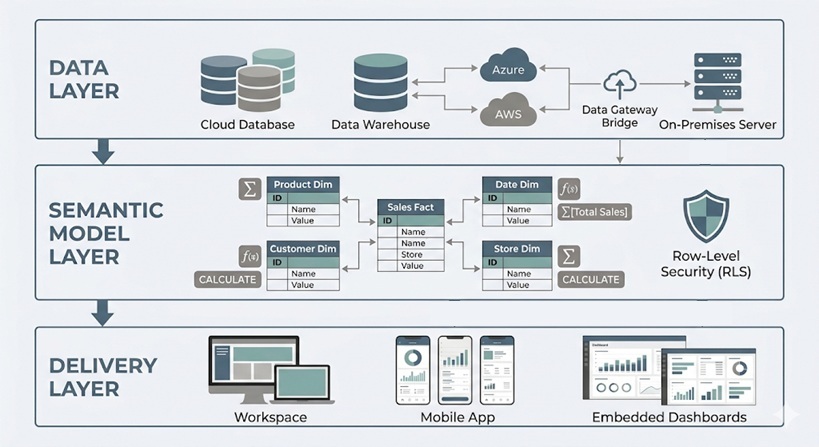
The architecture consists of three core layers:
As Power BI consultants we have delivered 1,000+ dashboards for 600+ clients including Google, Heineken and Dermalogica. We have designed Power BI architecture for companies of all sizes so we have a wealth of experience in this area. We are also Microsoft-certified in Power BI so some of our guidance in this article comes from the official Microsoft materials.
Based on our experience, choosing the right connectivity mode and refresh strategy directly impacts performance, scalability, and data freshness. We also see that the best practices have changed over time since the launch of Microsoft Fabric as more effective architectures have emerged.
Architecture requirements differ significantly between small self-service teams and enterprise Power BI deployments. Larger organizations need governance structures, certified datasets, Microsoft Fabric capacities, and hybrid connectivity patterns.
This article walks through concrete scenarios including real-time dashboard monitoring, hybrid SQL warehouse implementations, and marketing analytics consolidation, finishing with FAQs addressing practical design decisions.
Power BI launched in 2015 as Microsoft’s modern bi platform and has evolved into a core component of the Microsoft Fabric ecosystem. Understanding its architecture matters for three reasons: reliability (avoiding refresh failures), governance (preventing multiple versions of the truth), and speed (handling large datasets efficiently).
At its simplest, bi architecture describes how business data flows from sources into models, then into interactive reports, dashboards, and apps. This article focuses on practical architecture—what core components exist and how to combine them for real-world solutions.
The building blocks covered include connectivity modes, power bi semantic models, refresh strategies, security patterns, capacity types, and sharing architectures. Conceptually, picture data sources on the left, Power BI Desktop and datasets in the middle, and the power bi service with dashboards and consumers on the right.
Power BI follows four fundamental phases: connect to data sources, transform and model data, visualize via reports and dashboards, and share through the cloud or on-premises alternatives.
Users typically author in power bi desktop (a Windows client) and publish to the cloud based version at app.powerbi.com or to an on-premises power bi report server. Integration spans hybrid environments—on premises data sources like SQL Server or file shares require the power bi gateway for secure connectivity, while cloud sources like Azure SQL Database or Dataverse connect directly.
In 2026, Power BI integrates closely with Microsoft Fabric (OneLake, lakehouses, dataflows Gen2), though many organizations still rely on classic Business Intelligence data warehouse architectures. Later sections drill into each phase, but here the focus is the conceptual pipeline from raw data to governed, shareable actionable insights.
Architecture starts with data acquisition from operational databases, data warehouse systems, SaaS apps, flat files, and streaming endpoints. Power BI supports extensive source categories:
Category | Examples |
|---|---|
Relational databases | SQL Server, PostgreSQL, Oracle, MySQL |
Cloud platforms | Azure Synapse Analytics, Snowflake, BigQuery |
Files | Excel, CSV, Parquet |
SaaS connectors | Dynamics 365, SharePoint Online, Google Analytics, Salesforce |
The most common way to connect to the data is through “Get Data” experience in Power BI desktop which enables users to choose their data source, specify and load tables or use native sql queries. 200+ native connectors maintained by Microsoft ensure reliability, but users can also code custom connectors via Power Query M extensions to connect to niche systems.
Microsoft Fabric introduces DataFlows Gen 2 as its core data preparation experience. It works like Power Query Online – with the same data integrations and full transformation capabilities, all running in the cloud. Running transformations in the cloud means Power BI connects to clean, pre-processed data rather than doing the heavy lifting itself. This makes data refreshes more stable and significantly reduces the risk of timeouts. Fabric also supports custom API integrations written in Python. Microsoft Fabric developers can write and host this code directly inside Fabric notebooks, keeping everything within the same environment.
A key architectural decision happens here: favor curated data warehouse or lakehouse tables over hitting source system databases directly to minimize latency and errors.
Power BI offers three connectivity modes with major implications for performance, freshness, and modeling features:
Import mode compresses data into VertiPaq in-memory storage, delivering blazing query performance (often 10-100x faster than sources). It requires scheduled refresh and has dataset size limits—approximately 1 GB in shared capacity with Pro, scaling to hundreds of GB with Premium or Fabric capacities.
Direct query proxies live SQL to sources like Azure SQL Server, Big Query or Snowflake, suitable for truly large datasets (millionof rows) or near-real-time needs. It constrains DAX complexity, data transformation steps in Big Query and depends heavily on source optimization and network latency.
Live Connection federates to external models like analysis services or existing Power BI datasets, ideal for connecting to ready-made reporting models that only require simple data visualisation.
We recommend to use Import for most of your BI scenarios. Reserve DirectQuery for massive or rapidly changing data. Use Live Connection for governed enterprise models and shared key metrics.
Once connected, Power BI’s transformation and modeling layers prepare data for reliable, performant data analytics. Power Query serves as the data transformation (ETL/ELT) layer, while the semantic model stores relationships, measures, and security rules.
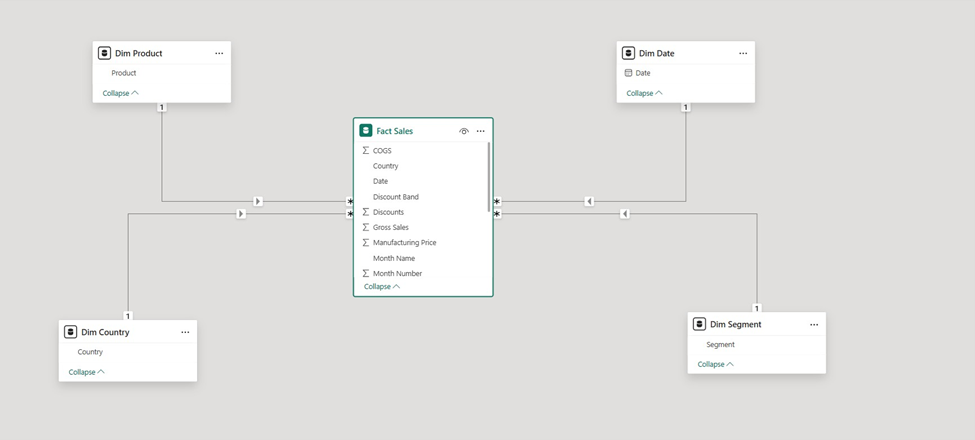
Designing a star schema with fact and dimension tables creates scalable, intuitive models compared to ad-hoc flat table designs. Heavy data merging and cleansing typically belong in upstream tools (SQL, Fabric pipelines) with Power Query reserved for final shaping.
The power query editor (accessed via “Transform Data”) provides a visual interface and M programming language for transforming data. Common operations include:
Each transformation becomes a step replayed on every refresh, so complexity impacts refresh time and gateway load. Some data sources like Azure SQL support query folding which automatically replaces your applied data transformation steps with a SQL query. Use query folding where possible to push work back to the source for better data accuracy and scalability
For loading data at massive volumes, organizations move most transformations in DataFlows Gen 2 or create dedicated views in the data warehouse before data reaches Power BI.
The semantic model (dataset) forms the analytical core—an in-memory or virtual structure holding tables, relationships, hierarchies, calculated columns, and DAX measures.
Power BI best practice star schema design includes:

Star schemas simplify DAX context, boost compression (VertiPaq achieves 10:1 ratios typically), and enable reuse across power bi reports. DAX enables reusable business rules and mathematical calculations—Year-to-Date Sales, rolling averages, conversion rates—leveraged across multiple reports.
Advanced modeling features include calculation groups , aggregation tables for drill-down speedups, and composite models combining Import and DirectQuery modes.
Reports, dashboards and apps each serve a distinct purpose and understanding the difference helps teams share the right content with the right audience.
A Power BI report is the primary canvas for data visualization. It connects directly to a semantic model and supports multiple pages, each containing charts, tables, slicers, and KPI cards.
Reports are interactive by design. Users can filter, drill down, and cross-highlight visuals without any additional configuration from the developer.
Dashboards live in the Power BI Service and are built by pinning visuals from one or more reports onto a single canvas. They are designed for at-a-glance monitoring rather than deep exploration.
A dashboard gives stakeholders a single view across multiple data sources. A sales director, for example, can see revenue, pipeline, and headcount metrics side by side — each pulling from a different underlying report.
Power BI apps bundle reports and dashboards into a packaged experience for a specific audience. An app published to the Finance team, for instance, contains only the reports relevant to them — with a clean navigation structure and no access to the underlying workspace.
Apps separate content consumption from content development. End users get a stable, curated interface while developers retain control over the underlying reports.
Power BI Embedded allows organizations to surface dashboards and reports inside their own external-facing products. This is handled through the Power BI REST API and Azure Active Directory authentication, with the visual rendered inside an iFrame or JavaScript component.
This is commonly used by SaaS platforms that want to offer analytics to their own customers without building a reporting layer from scratch. The end user sees a fully branded dashboard experience — with no visibility into Power BI itself.
Embedding supports the same interactivity as the native Power BI Service. Filters, drill-throughs, and slicers all function within the embedded view
The key components of a power bi solution include:
Not every organization uses every component.
Power bi desktop serves as the Windows-only development tool where data analysts build queries, models, and report layouts. Key views include:
View | Purpose |
|---|---|
Report view | Create visualizations and visual design |
Data view | Table inspection and imported data review |
Model view | Relationships and metadata (model data structures) |
Support includes core visuals (bar charts, matrices, maps, cards) and custom visuals from AppSource—some affecting performance or requiring governance. Use themes and templates to align multiple interactive reports with enterprise design standards. Mature BI teams store .pbix files in Git-based repositories for version control.
The Power BI service is a multi-tenant SaaS layer hosted on Microsoft Azure, accessed via browser. It stores datasets, reports and dashboards, and workspaces while managing scheduled refresh, security, sharing, and collaboration.
Capacity differences matter:
Capacity Type | Dataset Limit | Refresh Frequency |
|---|---|---|
Shared (Pro) | ~1 GB | 8/day |
Premium/Fabric | 100+ GB | 48/day |
Under the hood, Service uses Azure Traffic Manager, CDN, and regional data centers. Features important for architecture include deployment pipelines, dataflows, data lineage views, and tenant governance settings.
The on premises data gateway is a Windows service bridging Power BI Service to internal data sources. Two modes exist:
The gateway uses outbound connections via Azure Service Bus, avoiding inbound firewall ports. Treat it as critical infrastructure: implement redundancy via gateway clusters, monitor CPU/memory (>80% risks failures), and patch monthly.
Power bi report server provides on-premises hosting for organizations with strict data residency requirements. Prerequisites include licensing via power bi premium or SQL Server Enterprise with Software Assurance.
Authors publish from a specific Desktop edition (Report Server version) to an internal web portal. Support includes interactive reports, paginated reports, and KPIs. Some cloud features (AI visuals, Fabric integrations) aren’t available, trading functionality for compliance.
Bi mobile apps (iOS, Android) render dashboards optimized for phones and tablets, including offline caching and notifications. Mobile usage influences architecture—reports need responsive layouts and key KPIs surfaced for small screens.
Power bi embedded enables users to embed content in custom web apps or SaaS products via REST and JavaScript APIs. Common scenarios include multi-tenant analytics, white-label reporting, and line-of-business integration. Embedded architecture adds considerations: token generation, RLS integration with app identities, and capacity sizing for external users.
Beyond individual reports, organizations need sharing architecture: how content moves from development to production and how different user groups access it.
Deployment pipelines give teams a structured way to move Power BI content through development, test, and production stages. Each stage is a separate workspace, and content is promoted from one to the next once it has been reviewed and approved.
This prevents untested changes from reaching end users. A developer can update a report in the development workspace, validate it in test, and push it to production — without disrupting the live version at any point during the process.
Deployment pipelines are available on Power BI Premium and Fabric capacities. They support reports, dashboards, semantic models, and dataflows.
Data refresh is a central architectural concern balancing freshness, reliability, and cost.
Main refresh patterns:
Refresh interacts with gateway, source systems, and capacity. Capture requirements early: acceptable data latency, peak usage times, and concurrency expectations, then design accordingly.
Incremental refresh refreshes only recent partitions while older data remains static, dramatically reducing workload.
Example: A sales fact table with 5 years of data using a policy that refreshes the last 30 days while retaining full history—achieving 90% time savings.
Configure incremental refresh in Desktop via parameters, then execute in Service. Please note that your dataset needs to contain a data/time column in order to configure incremental refresh.
Security must be designed into architecture from the start. Layers include:
Centralize security rules at the dataset level to prevent duplication. The admin portal provides capacity assignments, tenant settings (export restrictions, publish controls), auditing, and DLP policies. Align Power BI security with organizational standards (ISO 27001, GDPR) for regulated sectors.
Power BI workspaces use a four-tier role system: Admin, Member, Contributor, and Viewer. Each role controls a specific level of access to reports, datasets, and workspace settings.
The principle of least privilege should guide every role assignment. Admins can grant access to any asset in the workspace, including sensitive data models so this role should be reserved for those who genuinely need it.
Download permissions are tied to role level. Users with Admin, Member, or Contributor access can download Power BI files and share them externally. If that is not acceptable for a given dataset, assign Viewer access instead.
RLS filters data per user or group based on DAX expressions tied to security roles.
Typical scenarios:
Implementation steps: create a security dimension, relate it to facts, define DAX filters using USERPRINCIPALNAME() for dynamic patterns, and map roles to Azure AD groups. Test thoroughly using “View as roles” in Desktop before production rollout.
Microsoft Activator is a Fabric component that brings automated governance and alerting into the data pipeline. It allows teams to define rules that trigger actions when data meets specific conditions — for example, flagging anomalies, sending alerts, or restricting access when a threshold is breached.
This moves governance from a manual, reactive process to an automated one. Compliance rules and data quality checks are enforced continuously rather than during periodic audits.
Activator connects directly to Fabric data streams, meaning governance logic sits close to the data itself rather than being bolted on at the reporting layer.
These mini-case studies illustrate different architecture decisions, adaptable across industries with similar patterns.
A digital marketing analytics agency consolidates ad performance from Google Ads, Meta Ads, LinkedIn Ads, and CRM data. Architecture: APIs land campaign data into Azure Synapse; Power BI connects via Import mode. Power Query performs light transformations while upstream pipelines handle heavy loads.
Semantic model: fact table for impressions/clicks/spend, dimensions for Date, Channel, Campaign, with DAX measures for CPC, CPA, ROAS. Delivery via Marketing Performance app with RLS by region.
A retail chain uses on-premises SQL Server containing sales and inventory data to create retail BI reports. Daily reporting uses Import with incremental refresh for large datasets sales facts via the gateway. Near-real-time monitoring uses DirectQuery or hybrid tables for current-day data.
Star schema includes separate Sales and Inventory facts with shared Store, Product, Date dimensions. Share data via “Retail Performance” app with regional RLS.
A support center needs up-to-the-minute metrics: queue length, average handle time, abandoned calls. Event streams stored in Azure SQL with DirectQuery connection. Streaming datasets power top-level KPIs on wallboard dashboards with alerts.
Historical analytics use Import models separately. Gateway required if telephony systems are on-premises; emphasize database tuning for DirectQuery load through data science optimization.

Good architecture impacts performance, governance, security, and user adoption over the long term. Periodically review your architecture as Microsoft releases new capabilities and data volumes grow.
Create a Power BI implementation roadmap: start with basic self-service Import models, evolve toward centralized semantic models, Premium/Fabric capacities, and formal deployment pipelines. Collaboration between BI developers, data engineers, and IT security teams is essential when designing or revising Power BI architecture.
Next step: Inventory your current sources, models, and sharing patterns. Identify pain points—refresh failures, duplicated KPIs, slow reports—and use these concepts to design a more robust data strategy.
Power BI is a powerful platform but its value depends entirely on how it is architected. A well-designed semantic model, a governed security layer, and a structured publishing pipeline are what separate a reliable business intelligence solution from a collection of disconnected reports.
The concepts covered in this article, from DataFlows and deployment pipelines to RLS and Power BI Embedded, form the foundation of a scalable Power BI implementation. Getting these right from the start reduces rework, protects sensitive data, and gives every user the information they need without the noise they don’t.
If you are planning a Power BI project or looking to improve an existing implementation, our team can help. Contact us to discuss your requirements.
Primary factors when deciding between Import and Direct Query include data volume, required freshness, source performance, and feature needs. Import is preferred unless data exceeds practical limits or near-real-time is mandatory. Import benefits from compression and fast interactions but needs scheduled refresh; DirectQuery depends on database tuning and restricts some visualization capabilities.
Pilot both modes on representative data before committing. Hybrid options (composite models, hybrid tables) can combine Import speed with DirectQuery freshness. Premium/Fabric capacities significantly expand options for large datasets.
While official limits vary by license (around 1 GB in shared capacity, tens to hundreds of GB in Premium), practical limits depend on refresh windows, gateway capacity, and performance expectations. VertiPaq compression allows tens of millions of rows within smaller limits, but poor data modeling (wide tables, excessive columns) bloats sizes quickly.
Use incremental refresh, star schemas, and aggregation tables to keep large models efficient. For billions of rows, DirectQuery or Fabric Direct Lake architectures may be more appropriate than pure Import.
Report Server suits organizations with strict data residency, regulatory requirements, or network isolation preventing cloud service use. Typical scenarios include regulated industries, government mandates, or transitional periods during cloud migration.
Report Server lacks some cloud features (AI visuals, Fabric integration, collaboration tools), creating trade-offs between compliance and functionality. Licensing requires Premium per capacity or SQL Server Enterprise with Software Assurance. If cloud is acceptable, Service is generally recommended for faster innovation.
Follow a stepwise approach: identify overlapping datasets and KPIs, consolidate into shared semantic models owned by a central team, then update existing reports to use these datasets. Introduce workspace standards (Dev/Test/Prod), deployment pipelines, and certification processes.
Communication matters: publish metric definitions, source catalogs, and ownership information. Tools like Power BI lineage views help discover dependencies. Monitor adoption and deprecate legacy standalone datasets once consumers migrate.
A gateway is required only when Power BI Service needs data not directly reachable on the public internet, on-prem SQL Server, file shares, or private network systems. Cloud sources (Azure SQL, Dataverse, most SaaS connectors) don’t need a gateway.
Some organizations install gateways on Azure VMs with VPN/ExpressRoute for hybrid network architectures. Consolidate into clustered enterprise gateways rather than numerous personal gateways for production workloads through proper planning for location, redundancy, and patching.
![]()
![]()
![]()