Power BI data modelling is the process of structuring your data in a clear, logical way so it supports accurate analysis. It includes cleaning the data, defining relationships between tables, and creating DAX calculations. A well-designed data model helps your Power BI reports load quickly, stay accurate, and make the data easier to explore.
Think of it like organizing a messy room—when everything is scattered, it’s hard to find what you need. But once everything is sorted into the right places, you can find and use things much more easily.
Vidi Corp is a BI consultancy that has offered Power BI data modelling services for 600+ clients, including Google, Heineken and Teleperformance. We are globally ranked as #1 business intelligence consultancy by G2, and all of our developers are Microsoft-certified in Power BI.
In this article, we want to share the good practices of data modelling in Power BI based on our experience, give examples of common Power BI data models and give a step-by-step guide for building a robust data model.
A good Power BI data model becomes the foundation for all analytics, reports, and dashboards. If data isn’t organized and structured correctly, reports can show inaccurate numbers, mismatched totals, or inconsistent results. This can mislead teams and lead to poor decisions that directly impact business performance.
When data is modeled properly:
● All departments—sales, finance, marketing, HR, and operations—use the same definitions and calculations. Terms like ‘Revenue,’ ‘Profit,’ or ‘Active Customer’ mean the same thing across the entire organization.
● These definitions stay centralized, controlled, and consistent. This reduces confusion, eliminates duplicate work, and ensures everyone is speaking the same ‘data language.’
● Power BI reports run faster and refresh quicker. Without proper modeling, graphs load slowly, dataset refreshes result in ‘timeout errors’ and development takes more time. On the other hand, an optimized model allows Power BI to handle millions of rows efficiently and return results instantly.
The Power BI consultants at Vidi Corp offer comprehensive Power BI data modelling services that help organizations create strong, scalable, and high-performing analytics models.
We have had data modelling projects where we reduced the Power BI report refresh time from 2 hours to 5 minutes. If you want to achieve similar results, contact us today!
As part of our Power BI data modelling services, we:
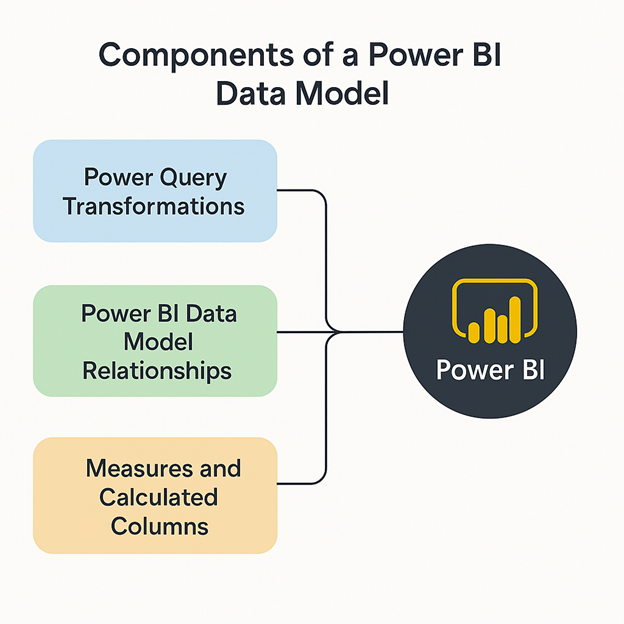
Power BI data modeling is built around Power Query transformations, table relationships and DAX calculations. Let’s explore each of them in detail:
Power Query is the starting point for all Power BI data modelling work. Best practice is to use Power Query transformations to reduce the size of your model by removing unnecessary columns, filtering out unwanted rows, grouping data where needed, and assigning the correct data types to your columns.
Power Query is also used to choose between Import and Direct Query mode for your tables. Import mode generally loads faster because the data is stored in the Power BI dataset cache. With Direct Query, Power BI fetches data directly from the source every time a filter is applied, which can take longer.
Relationships define how different tables connect to each other. For example, a Sales table can link to a Products table using a Product ID. These connections ensure Power BI pulls the right values when a user filters or interacts with the report. Let’s look at the different types of relationships in Power BI:
One-to-Many (1: *)
This is the most common and recommended relationship, where one value in a dimension table connects to many rows in a fact table, giving the best performance. Example: One Customer has many Sales Orders.
Many-to-One (*:1)
This is the reverse of one-to-many and behaves the same way, also offering good performance in most models. Example: Many Sales Orders link back to one Product in the Product table.
Many-to-Many (:)
This occurs when both tables contain repeating values with no unique key, making the model more complex and sometimes slower. Example: Customers belonging to multiple loyalty programs and programs shared by multiple customers.
One-to-One (1:1)
This links one row in a table to exactly one row in another and is typically used when splitting wide tables, with minimal impact on performance. Example: One Employee record linked to one Employee Details record.
Choosing the correct type of relationship can greatly affect both performance and accuracy. When relationships are designed well, your visuals respond faster, and calculations give correct results.
| Relationship Type | Explanation | Performance Impact |
| One-to-Many (1: *) | One item relates to many records, the most common structure | Best performance — recommended for most models and follows star schema design |
| Many-to-One (*:1) | Similar to 1: * but reversed direction; often occurs when building models from source tables. | Good performance — behaves the same as 1: * when used correctly. |
| Many-to-Many (*: *) | Both tables have repeated values | Can slow performance and cause confusion |
| One-to-One (1:1) | One record connects to one record | Light impact but rarely needed |
Using the right relationship type helps keep your model fast, organized, and easy to maintain.
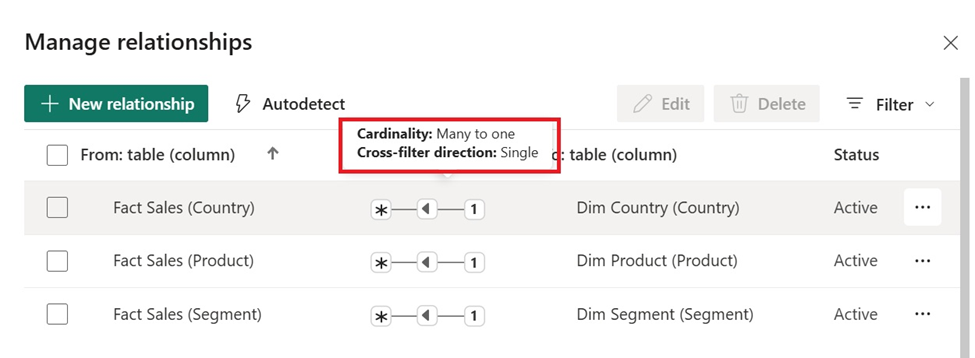
In addition to relationships, cross-filter direction is also an important aspect of Power BI data modelling. It controls how filters flow between tables and affects how visuals respond to user selections. A single direction is ideal for clean star schemas, while both-direction filtering supports complex models but can impact performance and introduce ambiguity.
Both measures and calculated columns use DAX, but they work differently.
Calculated columns are created during data refresh and stored in the data model. This means Power BI physically saves the result for every row, increasing the model size. They are useful when you need row-level values that do not change with filters — such as categories, flags, labels, or extracted fields like “Month Name” from a date.
Since they are stored in memory, too many calculated columns can slow down your model and increase file size. They are best used sparingly and only when the value needs to exist at the row level.
Measures are calculated only when a user interacts with the report. Their value changes based on the filter selections and graphs they are in. Measures do not increase the data model size because their value is not stored in the data model and instead is computed on the fly.
Measures are more efficient for performance because they do not add to the model size. They leverage Power BI’s in-memory engine (VertiPaq), which is optimized for fast calculations. However, very complex DAX measures can still impact performance if written poorly.
Here are the common use cases for when to use a calculated column or a measure, shown in the table below:
| Use a Calculated Column when | Use a Measure when. |
| The output is a label, category, or flag (e.g., Premium Customer: Yes/No). | The output is an aggregated calculation (e.g., Total Sales, Average Sales). |
| The column is required for relationships, sorting, or filtering. | The calculation should update dynamically in visuals and slicers. |
| The value does not need to be recalculated based on user selections. | The value should recalculate instantly whenever the report is filtered. |
The three most common Power BI data models are the Star Schema, the Snowflake Schema, and the Flat Table Model. Before getting into different data modelling approaches, it’s important to understand two core building blocks of any data model in Power BI: Fact tables and Dimension tables.
A Fact table contains the measurable business events or transactions. These are the numbers you want to analyse — such as sales amount, quantity sold, profit, cost, or number of visits. Each row in a fact table represents a specific event, like a single sale or a daily transaction.
A Dimension table, on the other hand, provides descriptive information that gives meaning to those numbers. It contains attributes such as product names, customer details, store locations, dates, employee information, or regions. Dimensions help you “slice” and “filter” your fact data.
For example, you can view sales by customer segment, by product category, or by month only because those attributes live in dimension tables.
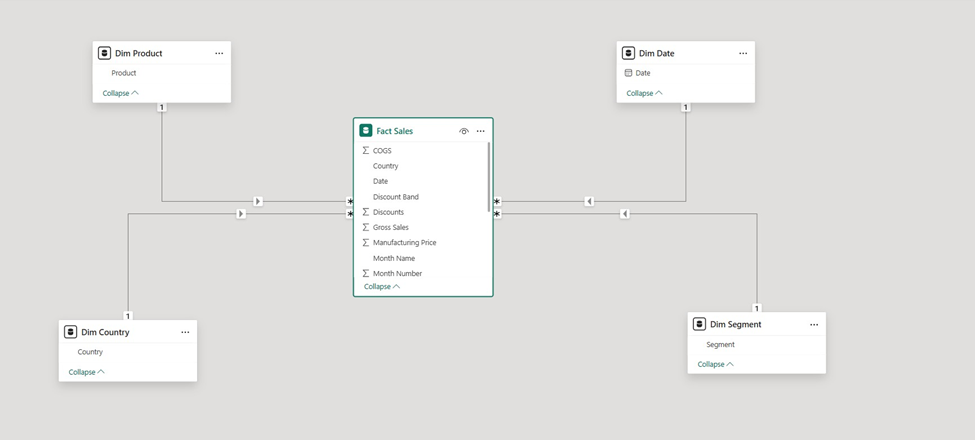
The Star Schema is the most efficient data modeling approach for Power BI. In this layout, the fact table sits at the center holding all measurable values like sales, quantity, and profit, while the surrounding dimension tables provide the descriptive details needed for analysis. Because each dimension connects directly to the fact table, the overall structure forms a simple, clear “star” pattern.
This design keeps relationships easy to manage, speeds up report performance, and allows Power BI’s analytical engine to work at its best.
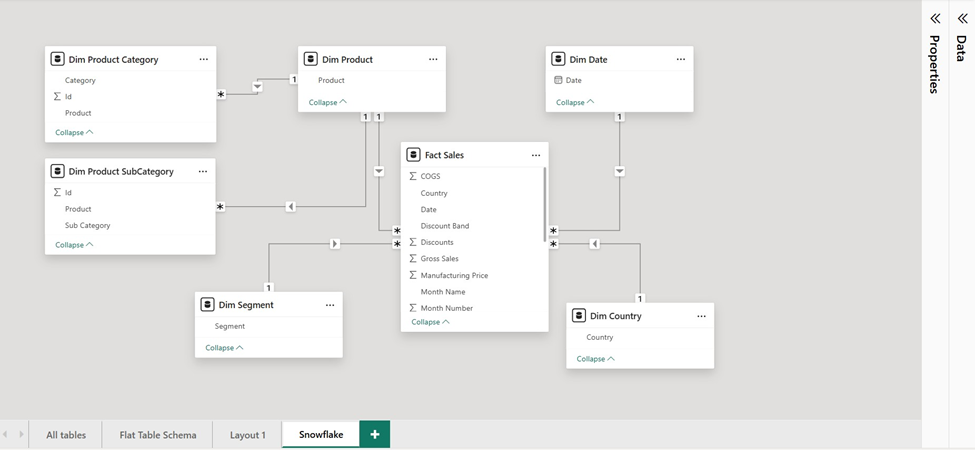
A Snowflake Schema extends the Star Schema by breaking dimension tables into multiple related tables through normalization. For example, instead of keeping Product, Category, and Subcategory in a single table, the Product dimension may be split into:
This reduces redundancy and enforces strong data integrity. However, the extra layers of tables introduce more relationships, which can have performance implications and add complexity for report authors. Power BI supports snowflake models, but they are usually recommended only for enterprise-level warehouse environments where normalization is required.
The following Power BI data modelling best practices come from our work experience and the official Microsoft guidance. You can read our Power BI best practices guide for more details on those:
Whenever possible, perform data transformations upstream, ideally in your SQL queries before loading into Power Query. If SQL isn’t an option, transform the data in Power Query rather than relying on DAX. Query folding (covered later) can help optimize this process.
Query folding pushes transformation steps back to the data source, letting it handle the heavy lifting. After you apply multiple transformation steps in Power Query, you can select them and click “fold queries”. Power BI would automatically convert your Power Query code to a SQL query moving the data transformations upstream.
Many-to-many relationships can confuse users and slow down reports. Filters may behave unpredictably, and visuals load slower. A star schema with one-to-many relationships is recommended instead, improving both usability and performance.
Design your model with a central fact table (sales, transactions, metrics) surrounded by dimension tables (products, customers, date, geography). This layout boosts performance, reduces complexity, and makes reporting intuitive. Avoid overly normalized tables unless necessary.
Bi-directional filtering can degrade performance and cause unexpected filter behaviour, especially when used across multiple relationships. For one-to-one relationships, consider merging tables in Power Query. You can also replace bi-directional relationships with visual-level filters.
Correct data types reduce memory usage and improve speed. Check Power BI’s auto-detected types and adjust as needed—for instance, use Date instead of Date/Time or numeric types instead of text when possible. This avoids unnecessary background tables and reduces memory overhead.
Eliminate columns not used in reports before loading into Power BI. This reduces data volume, speeds up visuals, and lowers memory usage. Pay special attention to long text columns—they consume the most memory and may need trimming or removal.
Summarize data by key dimensions (e.g., product or customer) to reduce row counts and table size. Power Query’s “Group By” function is ideal for aggregating numerical or categorical data efficiently.
Dataflows move data transformations to the cloud, reducing local processing in Power Query. This leads to faster model refreshes and lighter PBIX files since the heavy transformations occur before the data reaches your report.
A date table is an essential part of Power BI data model because it supports time-Intelligence functions. Built-in functions like YTD, QTD, MTD, rolling 12 months, or same-period-last-year only work with a proper Date Table marked in Power BI.
Unlike fact tables, which only include event dates, a Date Table covers all dates, filling gaps and enabling accurate reporting even when no activity occurs. Year, quarter, month, and week calculations are also handled in your date table, avoiding duplication across tables.
A well-structured data model organizes information into the right tables and relationships, eliminating inconsistencies such as double-counting, mismatched totals, or incorrect aggregations. This ensures all teams see the same numbers and can trust the reports, providing a solid foundation for informed decision-making.
Optimized models handle large datasets efficiently and load faster because the engine works with clean, structured data. Visuals respond quickly, calculations run smoothly, and users experience fewer delays. Even as data grows, performance remains stable, making the reporting environment scalable.
A robust model lets users slice, filter, and drill down into data at granular levels without breaking relationships. Analysts can confidently explore trends and patterns, generating insights that are accurate, meaningful, and easy for business users to interpret.
Clean, structured models are simpler for BI or IT teams to update when business needs change. New data sources can be added, columns adjusted, and measures created with minimal rework, reducing maintenance time, preventing technical debt, and lowering long-term costs.
A standardized data model ensures everyone—from analysts to leadership—uses the same definitions for metrics and KPIs. This eliminates confusion, prevents competing versions of the truth, and creates a unified reporting environment where decisions are based on consistent, trusted data.
When data modeling in Power BI is done correctly, businesses can unlock deeper insights, improve performance, and establish a framework that supports long-term success. It not only enhances the quality of analytics today but also prepares organizations to scale and adapt as their data grows.
With expert guidance from Vidi Corp Power BI experts, companies can build models that are both scalable and aligned with their business goals. A strong data model provides consistency, reliability, and clarity, ensuring that analytics remain valuable over time. Ultimately, investing in solid data modeling in Power BI is not just about solving current reporting needs it is about creating a sustainable foundation for future growth and smarter decision-making.
Data modelling creates the structure that Power BI uses to calculate results and display visuals. A well-designed model ensures accuracy, improves performance, and makes your reports easier to analyze and maintain. Without proper modelling, even good data can lead to wrong insights.
The Star Schema is considered the most effective structure for Power BI. It simplifies relationships, enhances compression, improves calculation performance, and allows users to analyze data faster and more reliably.
Yes. Power BI can connect to, merge, and transform data from many different systems using Power Query. This allows you to build a unified model even when your data comes from CRM, ERP, databases, flat files, or cloud platforms.
In most cases, yes. Measures are calculated on the fly, so they don’t increase model size and are more efficient. Calculated columns should be used only when the value needs to be stored or used as a relationship key.
A modelling service ensures your model is built using best practices. It improves performance, reduces errors, creates a scalable structure, and simplifies maintenance for IT teams. It also makes reports more reliable and easier for business users to explore.
Unoptimized models can lead to slow reports, incorrect totals, broken filters, and long refresh times. It also becomes difficult for analysts to troubleshoot issues or add new features without affecting existing reports.
Both extremes create problems. A flat table may work for small projects, but becomes slow and hard to maintain as data grows. Over-normalized models add unnecessary complexity. The ideal approach is a clean Star Schema that balances simplicity and performance.
![]()
![]()
![]()