
Telecom Business Intelligence is the process of collecting, transforming, and visualising telecom data to support better business decisions. It typically involves automatically extracting data from operational systems into a data warehouse, modelling and cleaning that data, and presenting it through dashboards and reports in BI tools such as Power BI or Tableau.
At Vidi Corp, we have hands-on experience delivering 1,000+ BI consulting projects, including several in the telecommunications industry. Our work spans online streaming services, network infrastructure providers, hardware sellers, and wireless service providers.
In this article, we walk through the key telecom BI dashboards we build for clients, explain the business problems they solve, and highlight the measurable impact they deliver. We also cover additional BI applications, common challenges, and best practices for implementing scalable analytics in telecommunications.
Business intelligence delivers the most value in telecom when it is directly tied to financial performance, cost control, and revenue growth. Well-designed dashboards turn complex operational data into clear insights that executives can act on quickly.
A strong example of this is our work with the CFO of Neterra Telecom. The Power BI dashboards we built delivered measurable business outcomes, including contributing to his Ernst & Young “Transformation of the Financial Function” CFO award in 2024.
The insights also helped identify a €50k one-off cost-saving opportunity, unlocked €10k–€20k in additional monthly recurring revenue, and fully automated reporting, removing the need for a full-time business analyst.
Below are examples of Telecom BI dashboards we have built for clients to analyse revenue, customers, and services across different telecom business models.
Sales analytics is one of the most intuitive and high-impact applications of business intelligence in telecom. It helps providers understand where revenue is coming from, how it changes over time, and which products and plans drive the most value.
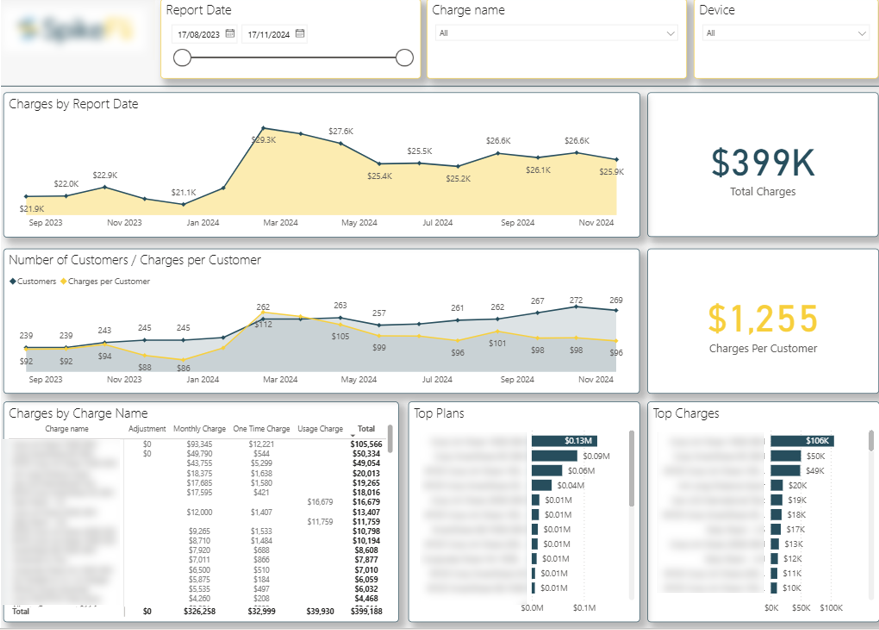
Our Power BI consultants built this sales analytics dashboard for a telecom provider to break down customer revenue by product and billing type. Line charts at the top track total revenue, number of active customers, and revenue per customer on a monthly basis.
A table below separates revenue into monthly recurring, one-time, and usage-based charges, while bar charts break revenue down by plan and by specific charges within each plan, such as roaming and data usage.
The client uses this dashboard to monitor revenue trends and quickly spot shifts in customer behaviour. These insights support pricing decisions, plan optimisation, and more focused sales efforts around the products and services that generate the strongest returns.
Telecom providers manage complex customer relationships that often involve multiple plans, add-ons, and usage-based services. Understanding how individual customers interact with these offerings is key to improving retention and increasing average revenue per user.
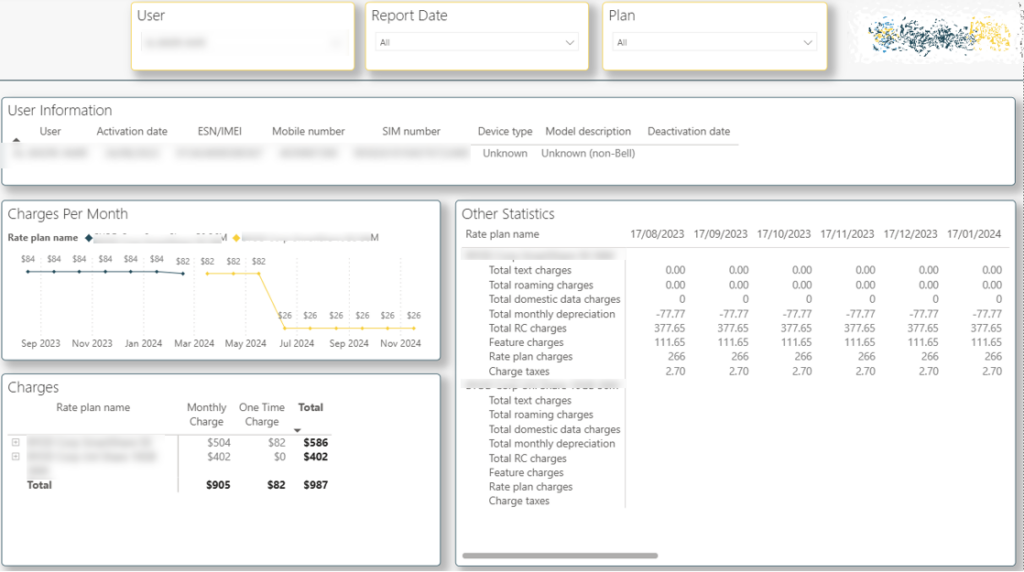
Our Power BI developers built a Power BI customer-level analytics dashboard that allows the wireless services company to filter down to a single customer and review their full commercial profile. The dashboard shows which plans the customer subscribed to over time, highlighting plan changes such as a move from Plan A between September 2023 and March 2024 to a different plan afterwards.
A table below breaks down the customer’s monthly recurring charges and one-off fees by plan, while the table on the right shows monthly charges for individual services.
The client uses this dashboard to identify customers who are strong candidates for plan upgrades based on their spend and service usage. Sales teams can quickly review customer activity and reach out with targeted upgrade offers, making outreach more timely, relevant, and effective.
Telecommunication companies often sell physical devices such as smartphones, routers, headphones, and accessories alongside their core services. Managing hardware sales efficiently is critical, as margins depend on pricing, inventory control, and demand forecasting across multiple locations.
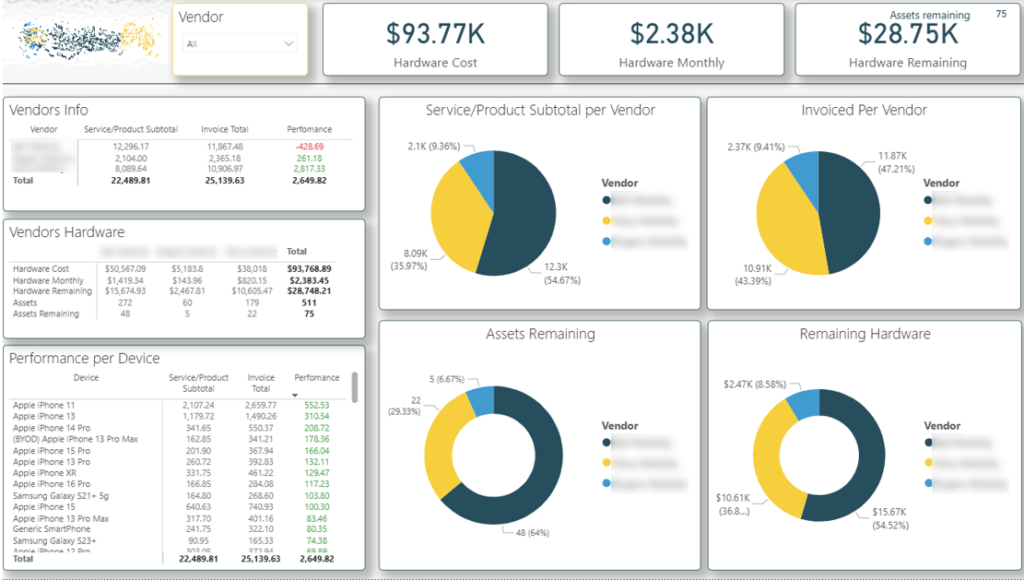
We previously built a sales dashboard for a telecom client to analyse the performance of their hardware sales across three retail stores. The top table compares purchasing costs, sales revenue, and the resulting margin to give a clear view of profitability by store.
The second table focuses on inventory, showing how many units were purchased, how many remain in stock, and the current inventory value.
A third table breaks down revenue and cost by device type, highlighting which products are in the highest demand and which ones underperform.
The client uses this dashboard to optimise purchasing decisions and avoid overstocking slow-moving devices. By clearly seeing which products sell fastest and where margins are strongest, they can adjust pricing, rebalance inventory between stores, and improve overall hardware profitability.
Customer retention is a critical focus for telecom providers, where long-term value depends on keeping customers engaged across plans and services. Retention analytics help teams understand customer lifecycle changes and spot early signs of churn.
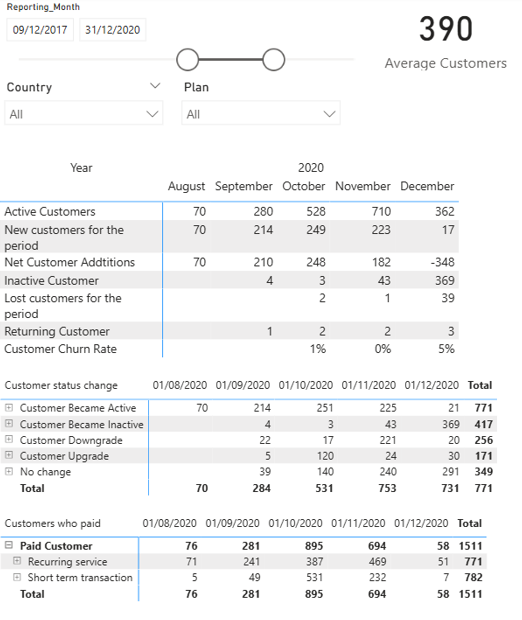
We built a customer retention dashboard that tracks how many customers are active, new, or inactive in each month. It also monitors returning customers, churn rate, and subscription movements, including how many customers upgraded or downgraded their plans.
The dashboard allows users to drill down into individual customers to see exactly who changed plans and when, and it also shows the number of paying customers split between recurring subscriptions and short-term, one-off transactions.
The client uses this dashboard to proactively manage churn and identify opportunities to retain or upsell customers. By combining high-level trends with customer-level drilldowns, teams can take targeted action before customers disengage and protect recurring revenue.
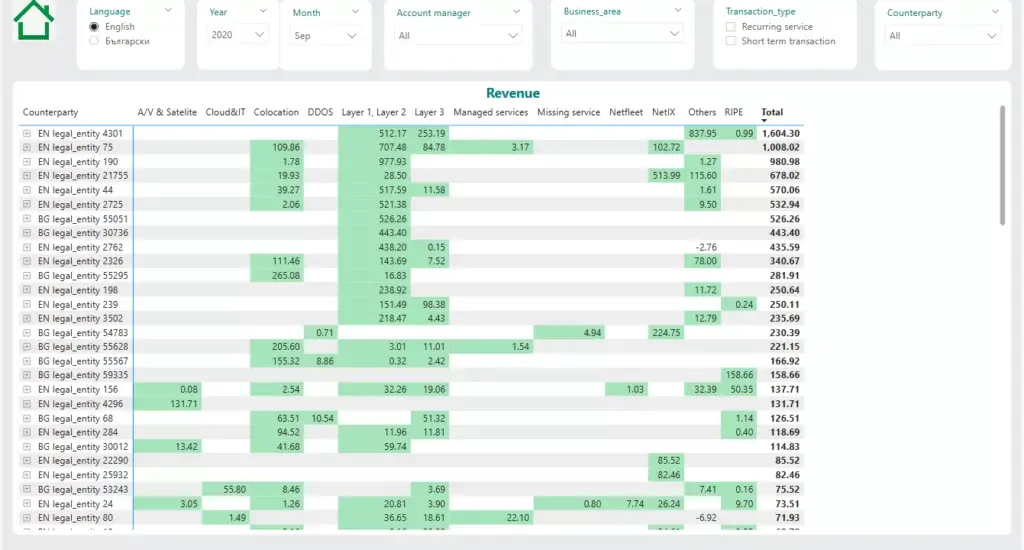
When telecommunication companies sell to B2B clients, visibility into contracted services and spending patterns becomes even more important. B2B accounts are typically larger, more complex, and offer stronger upsell potential when analysed correctly.
The first dashboard we built focuses on service-level visibility by client. It shows exactly which services each B2B customer is paying for, allowing the sales team to quickly spot gaps in service adoption and identify upsell opportunities across the client base.
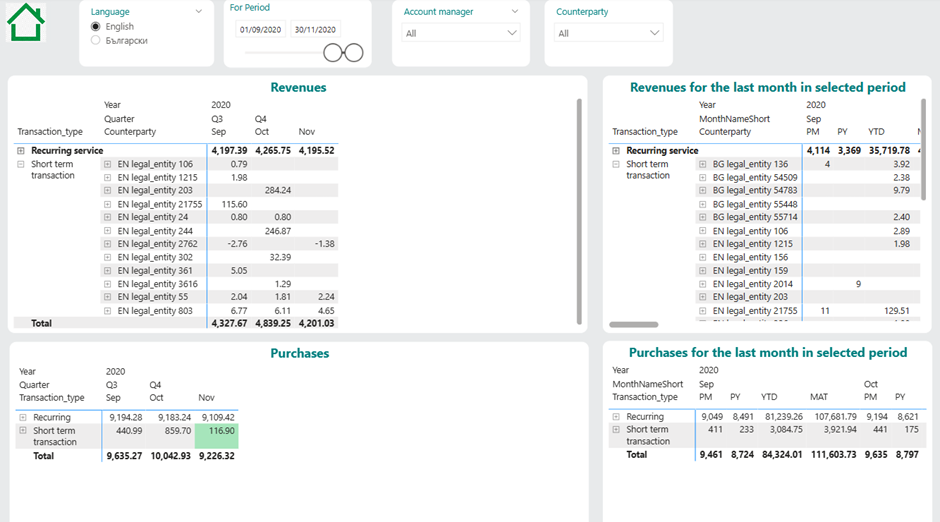
The second dashboard analyses customer spend in more depth by breaking down recurring charges and short-term transactions for each client. It compares performance across the current month, previous month, prior year, and year-to-date, making it easy to track growth, seasonality, and changes in purchasing behaviour.
Together, these dashboards give the client a complete view of B2B account value. Sales teams can prioritise high-potential accounts, time their outreach more effectively, and base upsell conversations on clear, data-backed insights rather than assumptions.
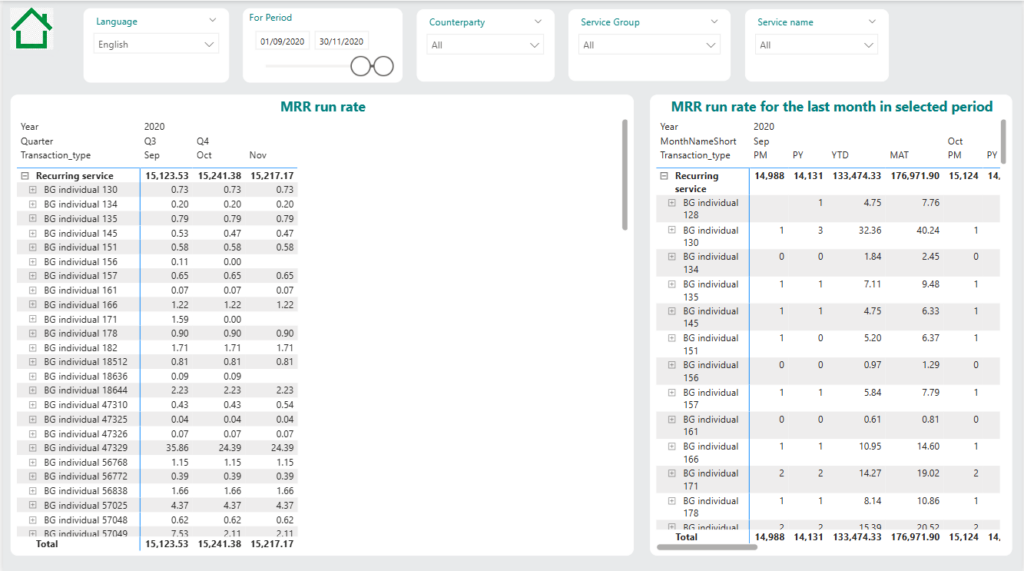
Monthly recurring revenue is one of the most important performance indicators for telecom companies, as it reflects the stability and predictability of future income. Tracking how MRR evolves over time helps teams understand whether the business is growing sustainably.
We built an MRR dashboard that shows total monthly recurring revenue and how it changes month over month. The dashboard highlights increases and decreases in MRR and allows users to drill down into the specific customers driving those changes.
The client uses this dashboard to monitor revenue momentum and quickly investigate unexpected fluctuations. By identifying which customers upgraded, downgraded, or churned, teams can take targeted action to protect and grow recurring revenue.
Beyond the dashboards shown above, telecom business intelligence supports several high-impact use cases where visual examples cannot always be shared. These applications are especially valuable for commercial, finance, and retention teams that focus on sustainable growth and profitability.
This analysis is most relevant for telecom providers investing heavily in sales and marketing, particularly mobile operators, ISPs, and MVNOs. By comparing customer acquisition cost with the average revenue per user from newly acquired customers, businesses can see which channels and campaigns bring profitable customers versus those that destroy value.
This insight helps teams optimise marketing spend, refine targeting, and scale acquisition strategies that recover CAC faster and generate stronger long-term returns.
This application is especially useful for telecom companies selling fixed-term contracts, enterprise services, or add-ons with expiry dates. The analysis highlights services and contracts that are approaching their end date, allowing teams to proactively identify customers at risk of churn.
Sales and account management teams use this insight to prioritise outreach, renew contracts, or upsell replacement services before revenue drops, improving retention and reducing last-minute renewals.
Customer lifetime value analysis is most relevant for subscription-based telecom businesses focused on long-term growth rather than short-term sales. By measuring how much revenue an average customer generates over their lifetime, companies can better understand the true value of different customer segments.
This insight supports smarter pricing, more realistic acquisition budgets, and improved retention strategies, ensuring that growth efforts are aligned with long-term profitability rather than just short-term volume.
Telecom analytics benefits from large datasets, but in practice they create serious performance challenges. In our project with Neterra Telecommunications, the live billing and usage tables contained several million rows, which initially led to slow report load times, heavy Power BI refreshes, and long iteration cycles during development.
We solved this by separating development from production data. During development, we worked against a dedicated analytics database with reduced, representative datasets (around 20–100k rows per core table), which allowed fast model changes and rapid testing. Once the dashboard logic was finalised, we switched the data source to the full live database.
We also simplified the data model and pushed all heavy transformations upstream into SQL. By pre-aggregating and cleaning data before it reached Power BI, we reduced in-memory calculations, improved refresh speed, and delivered a responsive user experience despite the underlying data scale.
Even when telecom providers use ERPs, critical data often sits in silos such as marketing platforms, billing systems, CRMs, and network tools. This fragmentation limits the ability to perform end-to-end analysis.
The solution is aggregating data into a central repository using automated data pipelines and APIs, creating a single source of truth for analytics.
Telecom data frequently contains missing values, inconsistent naming, and conflicting data types. This is common and does not mean a business is unprepared for analytics.
These issues are typically resolved through repeatable transformations in SQL or Power Query, ensuring data is cleaned and standardised every time reports are refreshed.
Addressing these challenges early ensures telecom BI solutions remain fast, reliable, and scalable as data volumes and business complexity grow.
Telecom Business Intelligence turns complex data into clarity, helping providers improve revenue, retention, and operational efficiency. When implemented correctly, BI becomes a core decision-making tool rather than just a reporting layer.
If you’re looking to build custom Telecom BI dashboards tailored to your data, systems, and business goals, contact us. We’ll help you design and implement analytics that deliver measurable impact from day one.
![]()
![]()
![]()