
Eugene Lebedev is a Power BI consultant by background. Before founding Vidi Corp in 2021 he created Power BI reporting for Autodesk. His Power Bi reports were used by VPs of Finance and C-suite of Autodesk. As part of Vidi Corp, Eugene created dashboards for Google, Teleperformance, Delta Airlines and 200+ clients worldwide.
Whether you are considering Power BI for your company or your career, this Power BI overview video should help you answer some of the questions you might have. I will talk about:
All the topics in this Power BI overview are time-stamped so if you are interested in anything in particular, feel free to jump ahead.
My name is Eugene and I am a data analytics consultant. I spend a good half of my time working in Power BI for my clients and here is your express introduction to Power BI.
I will use several claims about Power BI to explain what it is
1. Power BI is a data analytics reporting tool. Let’s break it down:
Analytics – people use it to analyse their data and answer some business questions from this data
Reporting – the answers to these business questions come in the form of reports.
When we say reports, I don’t mean reports that we used to write in the University with thousands of words of boring text. Those are data visualization reports.
2. Power BI is a data visualization tool
What I mean is that Power BI is used for turning your tables of data into graphs and charts that help you find patterns inside of your data. It is important to say here that Power BI is not used for predictive analytics and Machine Learning. It can be used to visualise the output of those Machine Learning models though.
3. Power BI is a self-service reporting tool
This is something that Microsoft keeps claiming about Power BI. Self Service means that users can serve themselves rather than relying on specialists to serve the reports to them. This is true for simple analysis because it is easy to get started with Power BI, however, sometimes you do need some specialist assistance. After all, I am a professional Power BI consultant and I still have a job for now!
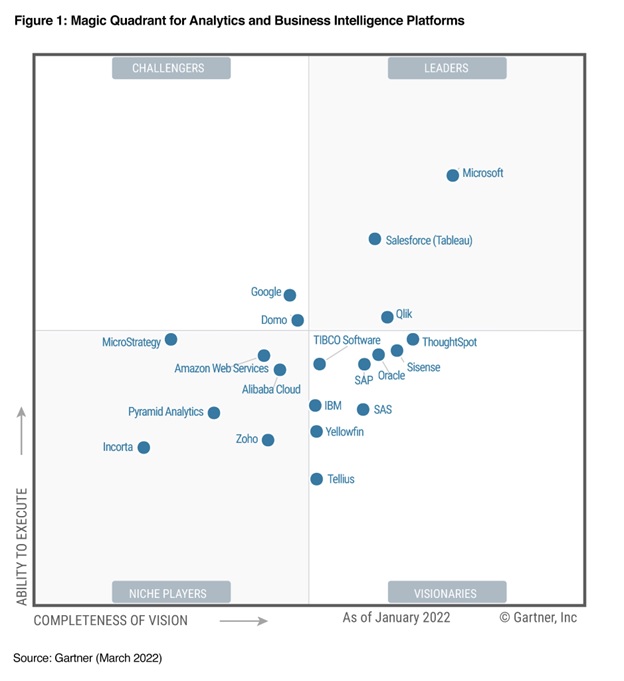
It is worth saying that these claims would describe the whole family of tools that are collectively called Business Intelligence Platforms. Many tech giants like Microsoft, Amazon, and Google have their own products in this product family. Every year Gartner publishes a magic quadrant that compares these tools against each other. Microsoft Power BI has come up at the very top 3-4 years in the row.
Later in this video I will show which features of Power BI specifically help to solve each one of these problems.
To see how you can optimise your reporting with Power BI, make an enquiry here.
As a developer you would do most of your work in a desktop application called Power BI Desktop. You can download it from the Microsoft website. There is no cost to you as a developer so you can start learning Power BI and playing with it for free.
When you open Power BI Desktop, you will see that it allows you to automatically download data directly into your reports from 200+ data sources. There is a visual interface for this in the form of get data menu. There are ways of automatically extracting data even if your data source is not available to pick from the menu. I have a video demo on how it works in one of my previous videos. I am planning to do a tutorial on building this kind of solution later but for now you can view the demo if you are interested.
After you extract the data using the get data menu, you will find yourself in Power Query which is a visual interface for transforming your data. The data transformation steps that you implement here will run every time that you refresh your Power BI file. Therefore, instead of you having to manually do the same repetitive data transformations, Power Query will do those for you.
Once your data is transformed, you can load it into your Power BI file and start creating relationships in the data. This is a very powerful functionality because it allows you to join several data sources together. For example, you can load data from Facebook Ads, Google Ads, Google Analytics and Hubspot and filter all the datasets by date or by campaign name from your reports. This way, your data sources are no longer disconnected from each other. There is a single place to view and explore data from them.
Finally, you would start building your data visualization inside of Power BI using the drag and drop functionality. You can select the visual type, place it on a page, specify the calculation for it, apply formatting steps, etc.
Once you finish building your reports, you will publish them to Power BI Service so that other people within your company can view them. You can also schedule automatic updates of your reports inside of Power BI Service but more on this later.
It is important to say that Microsoft advertises Power BI as a no-code/low-code tool whereas in reality, some coding skills are needed for writing formulas. There is a coding language called M inside of Power Query that you sometimes need to use. There is another one called DAX which you use to write formulas to display in your visualizations.
Overall, the amount of code you would write is still a lot less than if you were trying to create the same data visualization reports with Python or R. However, please don’t think that there is no need to write formulas at all.
If you simply need to view reports, Power BI can be useful for you in a number of ways:
In terms of the reports themselves, they become much more interactive. For example if you click one visual, it will filter the other visuals on the page. This makes it easier to dig deeper into the data and discover patterns that were not obvious before.
Power BI is free if you want to develop reports. No license is needed to download the Power BI Desktop or start using it.
You do need a Power BI Pro license to access Power BI Service though. It would be needed to share reports with other users or view the reports that were shared to you. This costs $10 per user per month as of now so if your organization has 10 Power BI users, this will cost $100 per month.
There is also Power BI Premium license which unlocks some additional features like AI, dataflows and allows you to work with a larger data volume.
Conclusion
I hope this information helps you to get some sense of what Power BI is and how you can make it useful for your organization or your career.
I am planning to launch a lot of content about Power BI in the coming weeks including a video course for building your first Power BI dashboard. Make sure you subscribe in order to see it when it comes out and I will see you in the next video.
![]()
![]()
![]()