
Most marketing agencies manage campaigns across dozens of platforms. Pulling reports from each system manually wastes time and increases the risk of errors. At Vidi Corp, we’ve delivered 100+ marketing analytics and marketing agency dashboard solutions that solve this problem. We partnered with highly influential marketing agencies including Neil Patel’s NP Digital and TubeScience, a Facebook Ads agency managing over $2B in annual ad spend.
In this guide, we’ll explain what a marketing agency dashboard is, the key benefits it delivers, the essential metrics every agency should track, and real-world dashboard examples.
A marketing agency dashboard is a centralized reporting and analytics tool that brings together your clients’ campaign data from multiple marketing channels into a single dashboard. Instead of manually pulling data from platforms like Google Ads, CRMs, or analytics tools, agencies can view all key performance indicators in one place, updated automatically and often in real time.
Most marketing agency dashboards also require little to no technical expertise. It connects directly to multiple marketing platforms, standardises the data, and presents it in user-friendly charts and reports. This allows teams to spend less time on data collection and more time on strategy and optimization.
A marketing agency dashboard does far more than display metrics. Marketing dashboard tools allow agencies to replace manual workflows with automated processes, improving operational efficiency.
One of the biggest advantages of a marketing agency dashboard is automation. Instead of exporting data, building spreadsheets, or taking screenshots from multiple platforms, dashboards automatically collect and update data from all connected channels. This helps to save hours each week and eliminate common human errors that occur during manual reporting.
By automating reporting, marketing dashboard tools free up time that teams can reinvest in strategy and optimization. Repetitive manual tasks can now be automated, allowing agencies to shift their focus from data preparation to performance improvement.
A marketing agency dashboard centralises all campaign data in one place. It gives teams a real-time overview of performance, making it easier to spot trends, identify underperforming channels, and adjust campaigns before opportunities are missed. This centralized visibility leads to improved collaboration across teams and more efficient use of the budget.
Marketing dashboard tools also decrease operational costs by reducing time spent on manual reporting. Automation minimizes the need for repetitive work and expensive custom reporting processes, helping agencies scale efficiently while maximizing return on investment.
To effectively measure performance and demonstrate ROI, a marketing agency dashboard should track the metrics that matter most across channels, campaigns, and customer touchpoints.There are several core categories and KPIs that every agency should include to provide a complete view of marketing impact.
| Metric Category | What It Measures |
| Leads & Opportunities | New leads generated, won opportunities, expected revenue, and marketing-influenced revenue. |
| Conversions & Funnel Metrics | Conversion counts, funnel progression, conversion rates, micro conversions. |
| Revenue & Ecommerce Metrics | Total sales, average order value, units/items sold, discounts applied, shipping revenue, taxes, and campaign revenue. |
| Cost & Advertising Metrics | Ad spend, cost per purchase/conversion, ROAS, and budget efficiency across channels. |
| Website & Engagement Metrics | Sessions, pageviews, bounce rate, pages per session, average time on site, stickiness ratio, and app installs. |
| SEO KPIs | Organic sessions, keyword rankings, impressions, clicks, CTR, and average position (from Google Search Console). |
| Social Media Analytics | Engagement metrics (likes, comments, shares, clicks), impressions, audience demographics (age, gender), optimal posting days/hours. |
| Email Marketing Metrics | Emails sent, open rates, reply rates, clicks, meeting bookings, and sequence performance. |
| Geographic & Location Insights | Customer or business location performance, sales/revenue by region, local search visibility (Google Business Profile metrics). |
| Promotion & Discount Metrics | Discount code usage, promotion performance, and impact on revenue or conversion rates. |
Below, we showcase a variety of our dashboard templates designed for different marketing functions including SEO, ecommerce, and local search performance, highlighting the metrics and insights each dashboard provides.
The digital marketing dashboard helps agencies evaluate marketing efficiency across channels by centralising performance data into a unified view. It shows which channels deliver the strongest business impact, leading to smarter budget allocation.
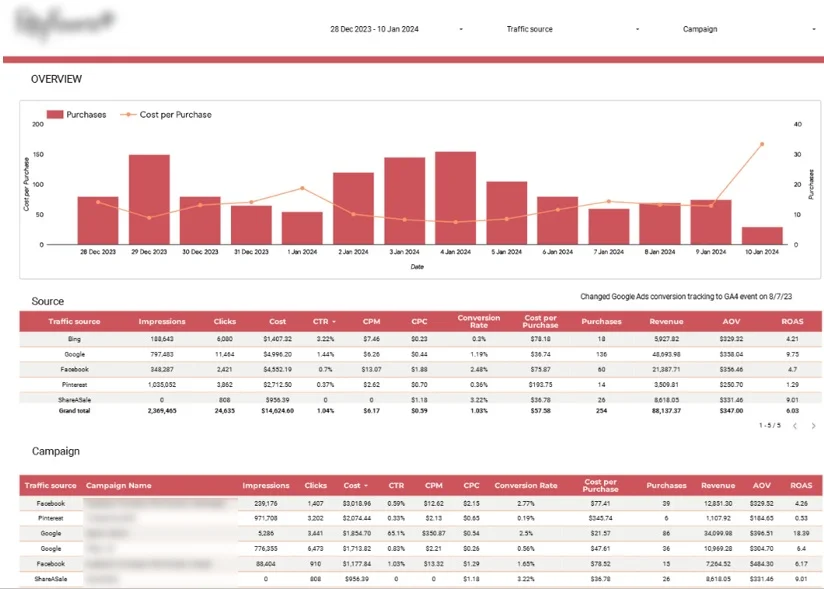
For example, a digital marketing dashboard we built for a flower delivery brand consolidates data from Google Analytics, Google Ads, Bing, Facebook, Pinterest, and affiliate platforms into one report. A top-level view highlights daily purchases alongside cost per purchase, making it easy to monitor acquisition costs against average order value.
What it includes:
Great for: marketing agencies managing multi-channel ecommerce campaigns and reporting performance to clients on a regular basis.
The ecommerce marketing dashboard gives Shopify brands and agencies a clear view of store performance by centralising sales and revenue data into a unified view. It highlights how revenue trends evolve over time and which products, regions, and promotions contribute most to growth, improving optimisation and planning decisions.
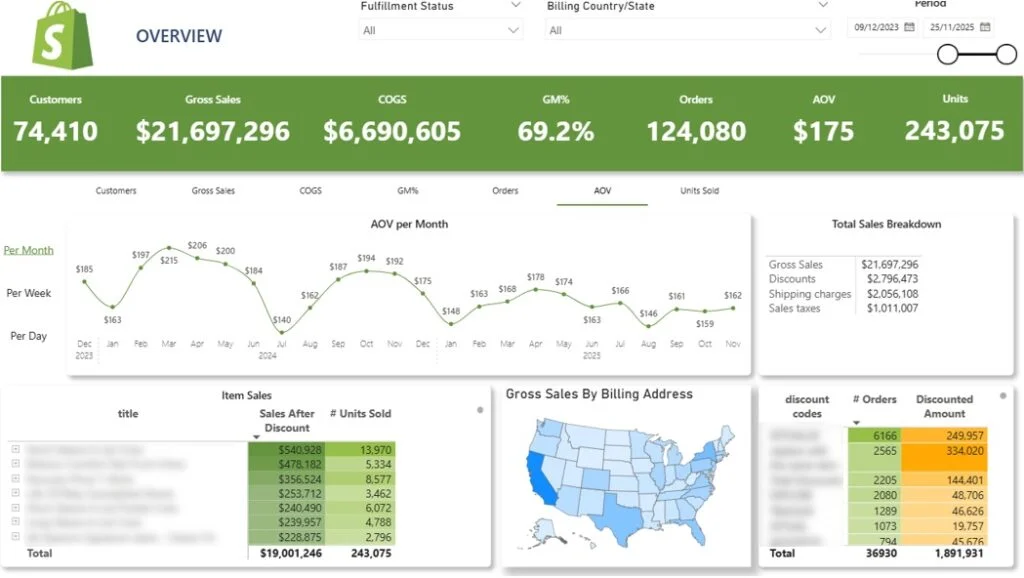
For instance, our ecommerce marketing dashboard built for a Shopify brand surfaces key metrics such as total sales, discounts, shipping revenue, sales tax, average order value, and total items sold in one report. A top-level interactive trend chart allows users to track performance daily, weekly, or monthly while switching between KPIs like total revenue, customer count, gross margin, order volume, and units sold.
What it includes:
Great for: marketing agencies and Shopify brands tracking ecommerce performance, product sales trends, regional demand, and promotional impact in a single dashboard
The email marketing dashboard helps agencies track and optimise outreach performance by centralising campaign data. It shows how outreach sequences perform at each stage of the funnel, making it easier to demonstrate campaign progress, optimise timing, and highlight tangible results such as replies and booked meetings.
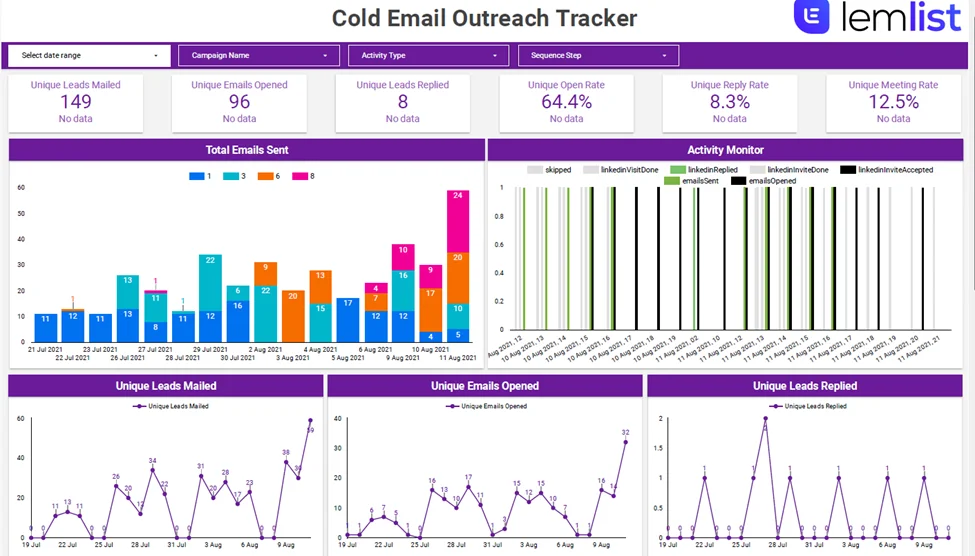
Above is an email marketing dashboard we built for an agency running a multi-channel outreach campaign with Lemlist and LinkedIn. A top-level view surfaces core outreach metrics, allowing the agency to quickly update clients on performance and engagement across active sequences.
What it includes:
Great for: marketing agencies managing outbound email and LinkedIn outreach campaigns and reporting engagement, replies, and meetings booked to clients in real time
The LinkedIn Ads dashboard helps agencies and B2B teams understand campaign performance by presenting LinkedIn Ads data. It analyses campaigns based on their specific objectives such as awareness, making it easier to evaluate results and share results with stakeholders.
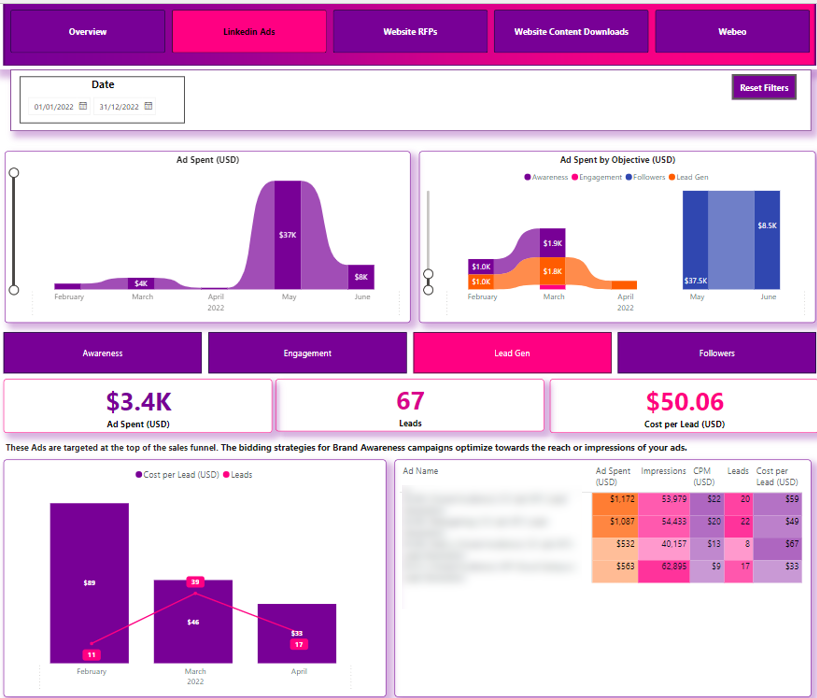
Above is a LinkedIn Ads dashboard our analysts developed for a global company with 400k+ employees. It shows how much budget was spent over time, what that spend was allocated to, and the results generated from it. Users can switch between different campaign objectives directly within the dashboard to view the most relevant metrics for each goal.
What it includes:
Great for: marketing agencies and B2B brands running LinkedIn Ads who need objective-driven performance insights and clear visual storytelling for client or internal reporting.
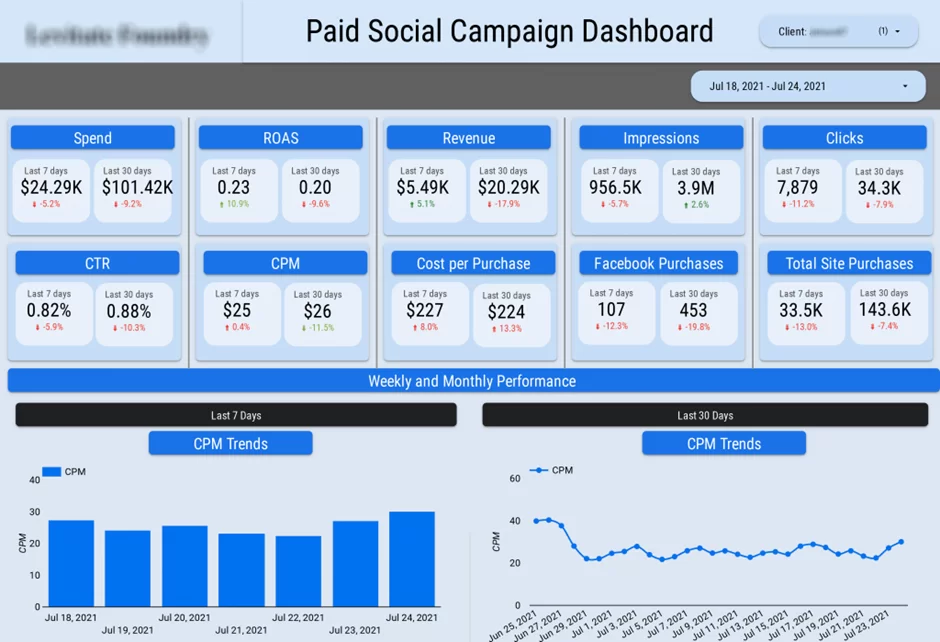
The Facebook Ads Marketing Dashboard helps agencies evaluate paid social performance across the entire conversion funnel. It reveals how efficiently ad spend moves users from impressions to purchases, supporting smarter budget allocation decisions.
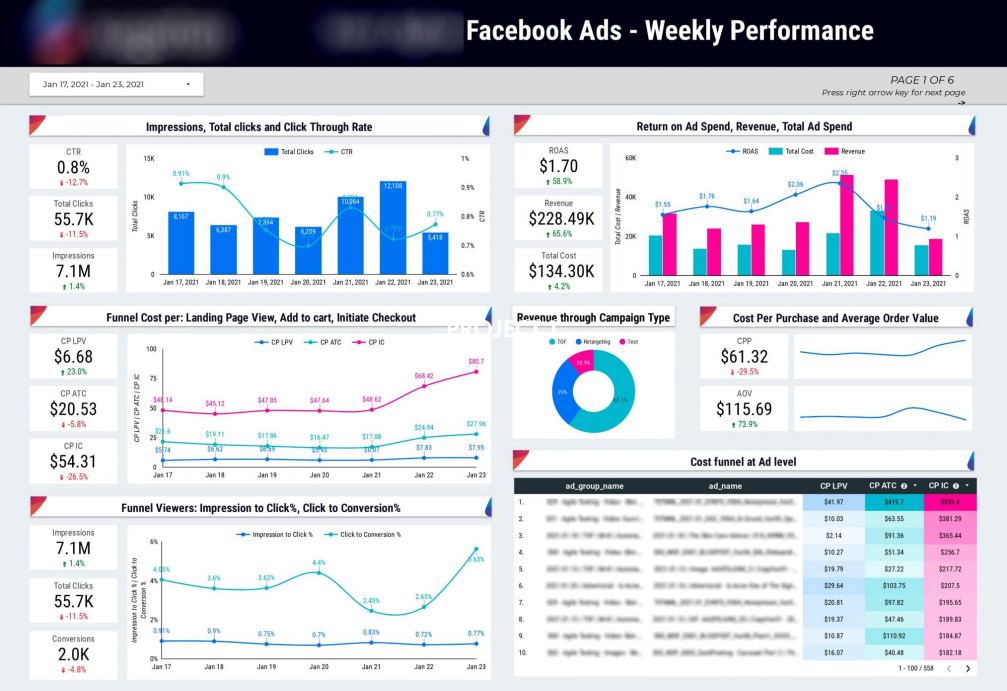
A Facebook Ads marketing dashboard our marketing analysts built for an ecommerce brand analyses each stage of the funnel, from initial impressions and clicks through to purchases. A top-level view highlights key financial metrics such as ad spend, revenue, and ROAS alongside daily trends, making it easy to monitor performance over time.
What it includes:
Great for: marketing agencies and brands running Facebook Ads who want clear visibility into funnel efficiency, conversion costs at each stage, and overall return on ad spend.
The Google Analytics dashboard helps agencies understand website performance by centralising key traffic and engagement metrics into a single, comparative view. It shows how users visit the site, how they interact with content, and where engagement drops off.
A Google Analytics dashboard our team created for a content-driven website highlights engagement KPIs for the current month with the clear comparisons to the previous month. It helps to assess organic traffic performance over time and across custom date ranges, revealing trends in user behaviour and site engagement.
What it includes:
Great for: marketing agencies that need clear visibility into traffic quality, engagement trends, and organic growth performance.
The Google Ads dashboard helps agencies evaluate paid search performance by analysing cost, engagement, and revenue data. It provides a clear snapshot of campaign efficiency, highlighting how ad spend translates into clicks, conversions, and revenue
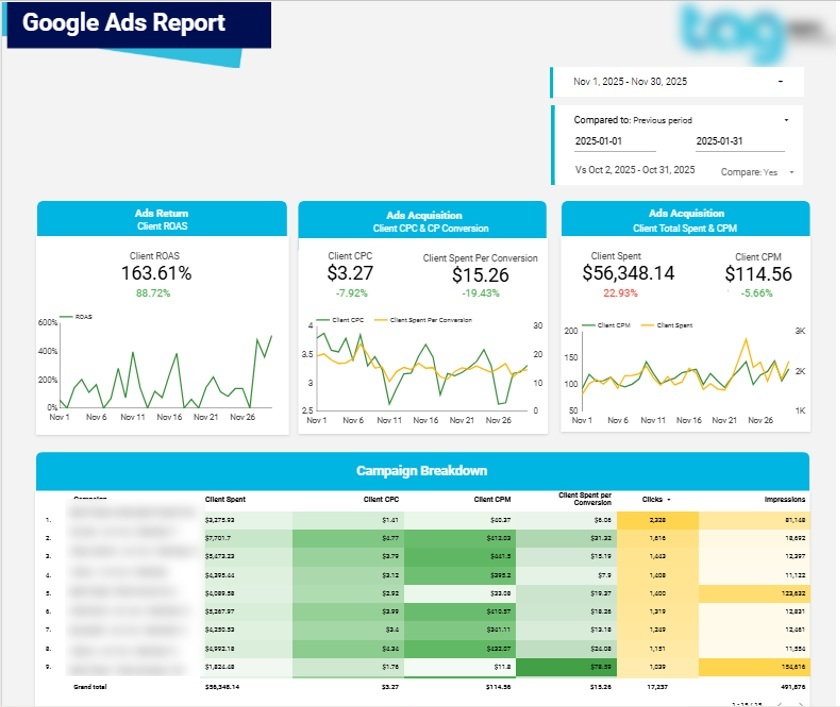
Our Google Ads dashboard combines data from Google Analytics and Ads into one report. A top-level summary surfaces the most important KPIs along with trends and comparisons to the previous period, giving clients a concise overview of performance at a glance.
What it includes:
Great for: agencies managing Google Ads campaigns who need a revenue-focused view of paid search performance and return on advertising spend.
The Google Search Console dashboard helps agencies monitor organic search visibility and performance. It shows how often a site appears in search results, how frequently users click through, and how rankings change over time.
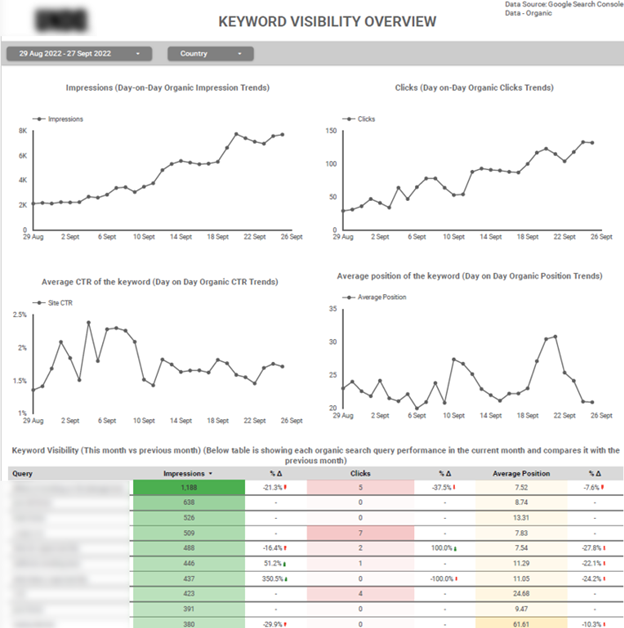
A Google Search Console dashboard our analysts built presents summary KPIs for a selected time period, with flexible filters for search queries. It highlights impressions, clicks, CTR, and average position, alongside trend lines and comparisons to the previous period for quick performance evaluation.
What it includes:
Great for: agencies managing SEO and content strategies who need to analyse search performance, ranking trends, and organic growth opportunities.
The marketing dashboard gives agencies a high-level view of marketing performance by connecting marketing data with sales outcomes. It highlights how marketing efforts contribute to won opportunities and expected revenue, making it easier to measure impact and align marketing activities with business growth.
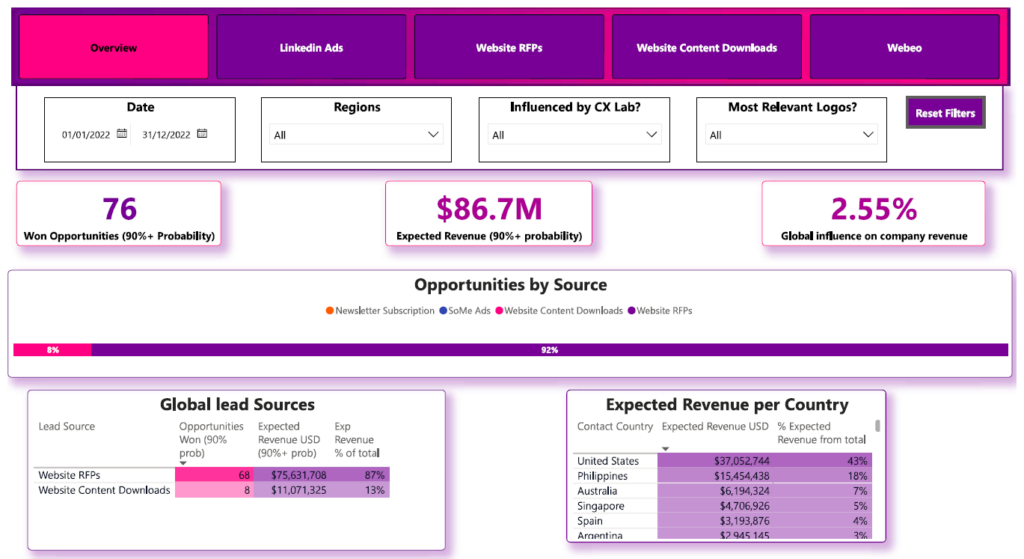
Our marketing dashboard shows key revenue metrics such as won opportunities, total expected revenue, and the percentage of revenue influenced by marketing data sources. The overview page summarises performance across all lead channels, while deeper views break down opportunities and expected revenue by lead source and customer country.
What it includes:
Great for: teams that want to evaluate lead performance, revenue contribution, and conversion efficiency across the entire marketing funnel.
The PPC dashboard helps agencies monitor and optimise paid advertising performance across multiple clients which can be selected using the filter at the top. It shows budgets, spend, and results in real time, making it easier to evaluate performance across clients and campaigns.
Our cross-channel PPC dashboard integrates data from various ad platforms through automated pipelines. Users can filter by client, account, campaign type, or date range to get a detailed view of performance. Teams can view metrics for all clients or drill-down for individual campaigns, highlighting high and low performers.
What it includes:
Great for: marketing agencies managing multiple PPC campaigns who need up-to-date performance reporting and insights for optimisation.
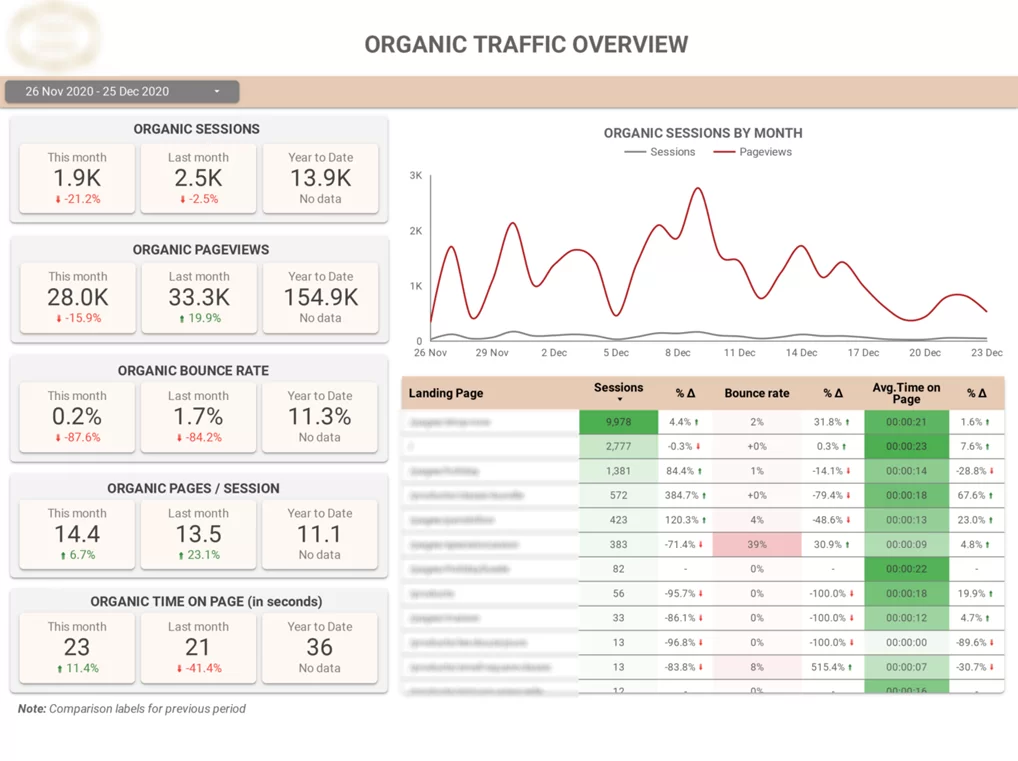
The SEO dashboard helps agencies monitor website search performance by centralising key traffic and engagement metrics into an easy-to-read view. It shows how organic search efforts impact user behaviour and overall site performance, supporting optimisation decisions.
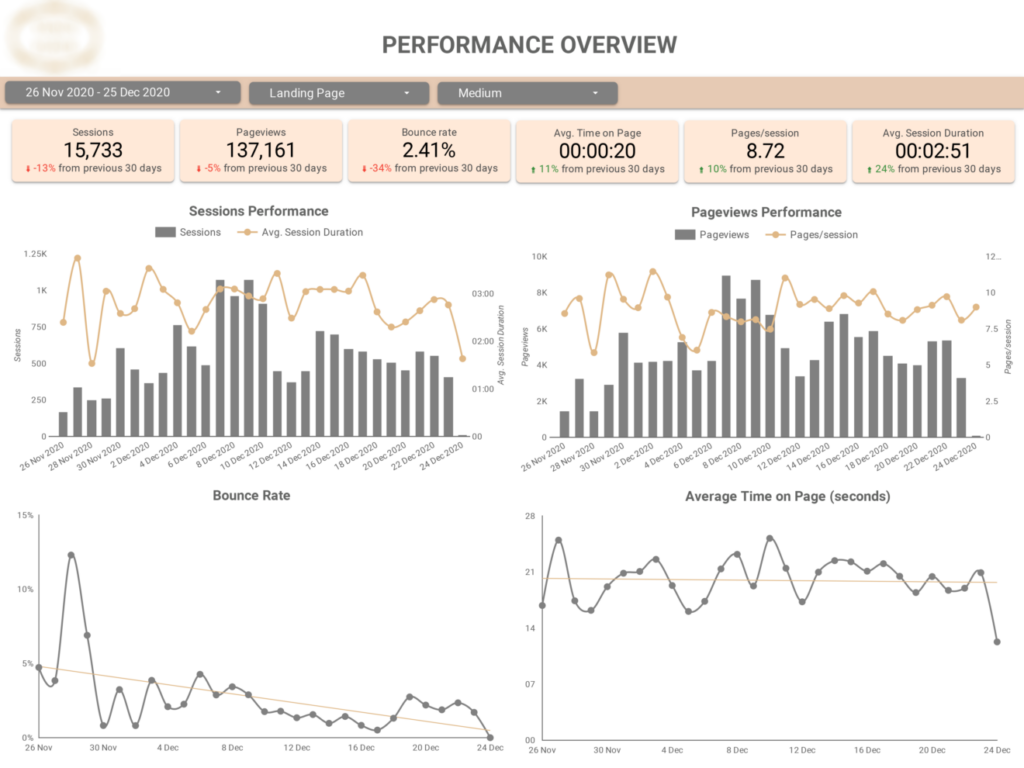
Our SEO dashboard presents high-level metrics at the top of the page, with comparisons to the previous 30 days. Daily trend charts track sessions, pageviews, bounce rate, and average time on page, making it easy to spot performance changes and identify opportunities for improvement.
What it includes:
Great for: agencies managing SEO campaigns who need visibility into organic traffic, engagement trends, and website performance over time.
The search engine marketing dashboard helps agencies track and optimise SEM campaigns by centralising performance metrics across Bing and Google. It shows how ad spend drives conversions and revenue, enabling more informed optimisation and budget decisions.
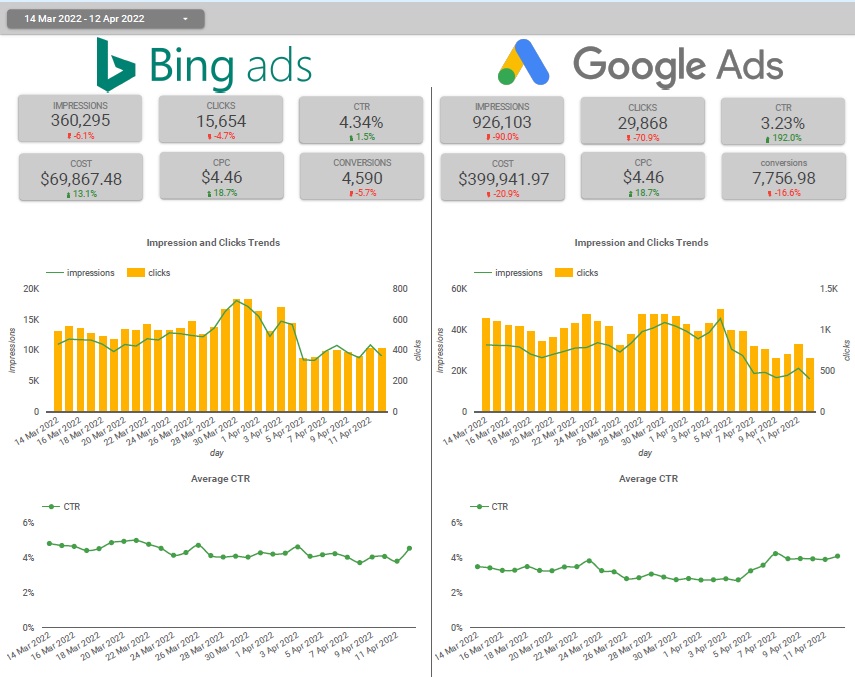
Our search engine marketing dashboard analyses conversions by channel and device, while tracking the weekly progression of average conversion rates. KPI cards display CTR, total conversions, and conversion value, giving a quick snapshot of campaign efficiency. A daily trend graph compares Google Ads costs with the revenue generated, highlighting return on investment over time.
What it includes:
Great for: marketing agencies and brands running SEM campaigns who want clear visibility into conversion performance, cost efficiency, and revenue impact across search marketing efforts.
The web analytics dashboard helps agencies and brands monitor user behaviour, engagement, and conversions by centralising key metrics from multiple sources. It provides insights into user activity, application installs, and audience composition, enabling data-driven optimisation of products and campaigns.
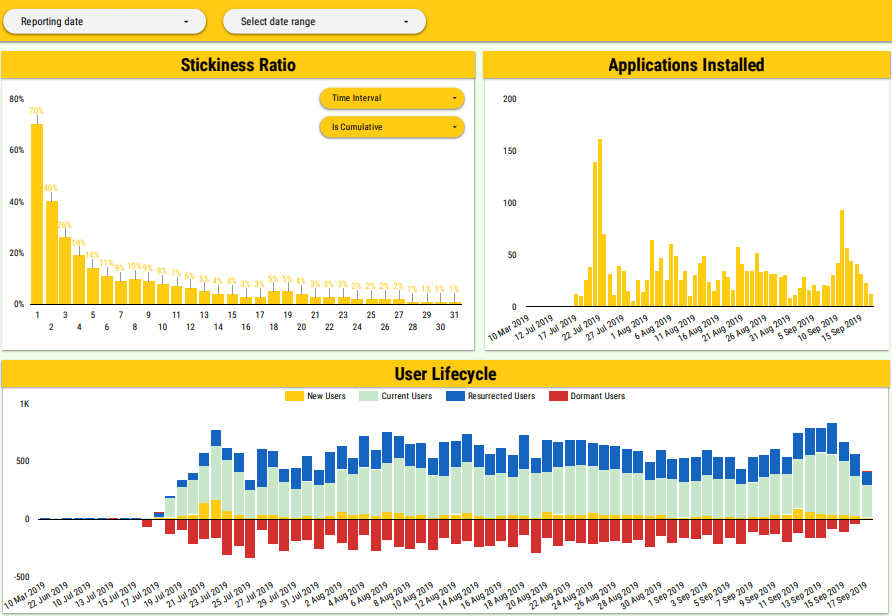
A web analytics dashboard our analysts built for a client migrated reporting from Amplitude to Google Data Studio, maintaining full analytical capabilities while reducing costs. Using BigQuery as the data source, the dashboard tracks conversions, user stickiness, application installs, and user segments in a visually intuitive way.
What it includes:
Great for: marketing agencies and product teams who need a cost-effective, comprehensive way to track user behaviour, engagement trends, and conversions over time.
The Instagram Ads dashboard helps to understand engagement patterns and audience characteristics from ad performance and demographic data. It shows when ads generate the most engagement and which audience segments respond best.
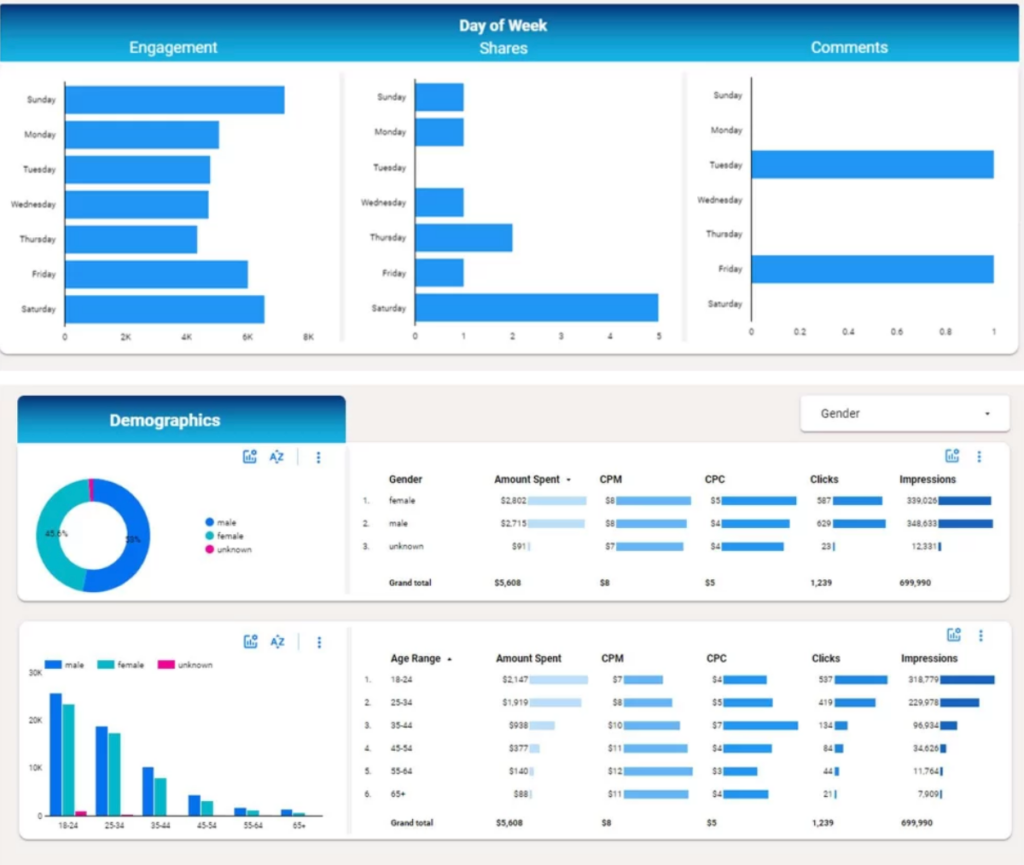
An Instagram Ads dashboard our team built shows engagement trends by day of the week, making it easy to identify the best days to run or schedule ads. A dedicated demographics section breaks down key metrics by age and gender, allowing users to analyse performance across different audience segments.
What it includes:
Great for: brands running Instagram Ads who want to refine targeting and improve campaign performance based on engagement timing and audience demographics insights.
The Google My Business dashboard helps agencies measure local search visibility and customer engagement using Google Business Profile data from Google Search and Google Maps. It shows how customers discover local businesses, which locations perform best, and which actions drive conversions.
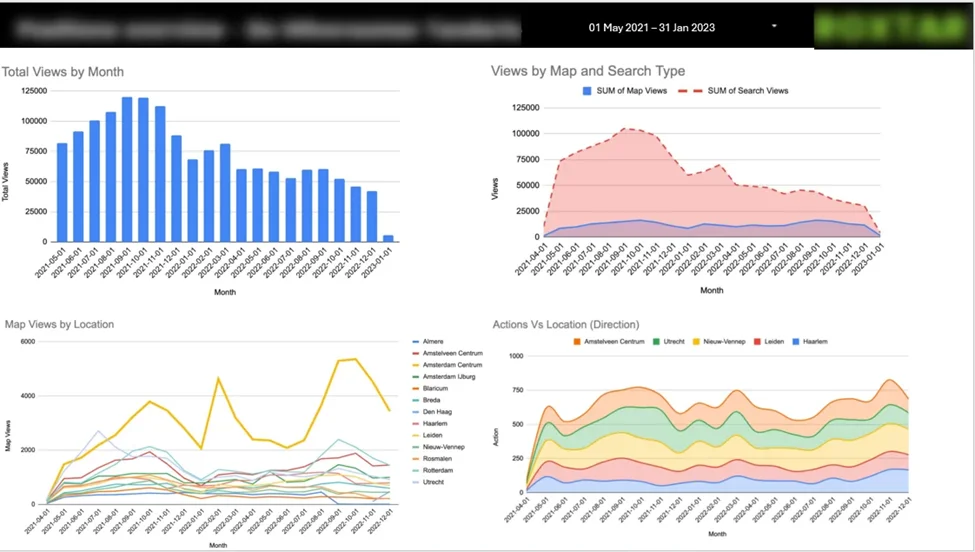
A Google My Business dashboard our marketing analysts built for a multi-location phone repair chain consolidates data from multiple Google Business Profile accounts into one report. A top-level view highlights monthly profile visibility across Maps and Search, making it easy to track trends and compare performance between locations.
What it includes:
Great for: agencies managing local SEO and multi-location brands who need visibility into local search performance, customer engagement, and location-level conversions.
Choosing the right marketing dashboard is essential for your agency’s efficiency and growth. When evaluating options, keep these key factors in mind:
1. Ease of Use and Setup
Choose a dashboard that is intuitive and doesn’t require coding. Your team should be able to connect data sources, create reports and share them easily. Quick setup saves time and ensures your team can focus on strategy rather than technical challenges.
2. Integrations and Data Sources
The more native integrations a platform offers, the better. Look for dashboards that connect seamlessly to ad platforms, analytics tools, CRMs, and social media channels. Ease of integration ensures you can centralise all marketing data in one place without manual imports.
3. Real-Time Updates and Alerts
Marketing happens fast. Dashboards that update in real time help you monitor campaigns as they evolve. Look for platforms that allow custom alerts when KPIs go above or below thresholds, so your team can respond immediately to trends and opportunities.
4. Custom Views for Different Users
Your dashboard should adapt to multiple audiences. Executives often need high-level performance summaries, while analysts and account managers require granular tables, trend charts, and pivot views. Platforms that support role-based or client-specific dashboards make reporting more efficient.
5. Scalability and Flexibility
Your agency will grow, and your dashboard should grow with it. Ensure it can handle more clients, campaigns, and data sources without compromising speed or usability. Flexibility to adjust metrics, charts, and layouts keeps your reporting relevant as client needs change.
Marketing agencies that rely on manual reporting waste valuable time and risk missing critical performance insights. A well-designed marketing agency dashboard eliminates these inefficiencies by automating data collection, centralising key metrics, and delivering real-time visibility across all marketing channels.
If you’re looking to create a dashboard tailored to your business needs, our team can help. Contact us today to discuss how we can build a custom marketing agency dashboard that delivers the insights you need to scale performance and grow your business.
![]()
![]()
![]()