
After building 300+ Looker Studio dashboards for clients including Google, Neil Patel, and TubeScience (the largest producer of social media ads in the U.S.), we’ve seen firsthand what actually works in digital marketing analytics.
At Vidi Corp, most of our Looker Studio projects are built for marketing teams and agencies, largely because Looker Studio makes it easy to share dashboards with clients without licensing costs.
In this article, we’re showcasing 11 of the best dashboards that our Looker Studio consultants have developed for real marketing analytics use cases, dashboards designed to answer real questions, not just look good.
These aren’t free templates you can download. Instead, they’re proven, client-built examples. If you like what you see, we can build a similar Looker Studio dashboard tailored to your data and goals.
Building effective Looker Studio dashboards requires more than technical skills — it requires a strong focus on clarity, usability, and decision-making impact. As the #1 Business Intelligence consultancy on G2, we place equal importance on how dashboards look and how useful they are in real business scenarios.
In this article, we’ve showcased the best Looker Studio dashboards we’ve built based on these two principles: visual attractiveness and practical usefulness. Each example reflects real client needs and real decision-making workflows.
Below is a review from Kris Sugatan, CEO of the performance marketing agency Sugatan.io, sharing her experience working with our team and the value these dashboards delivered for her business.
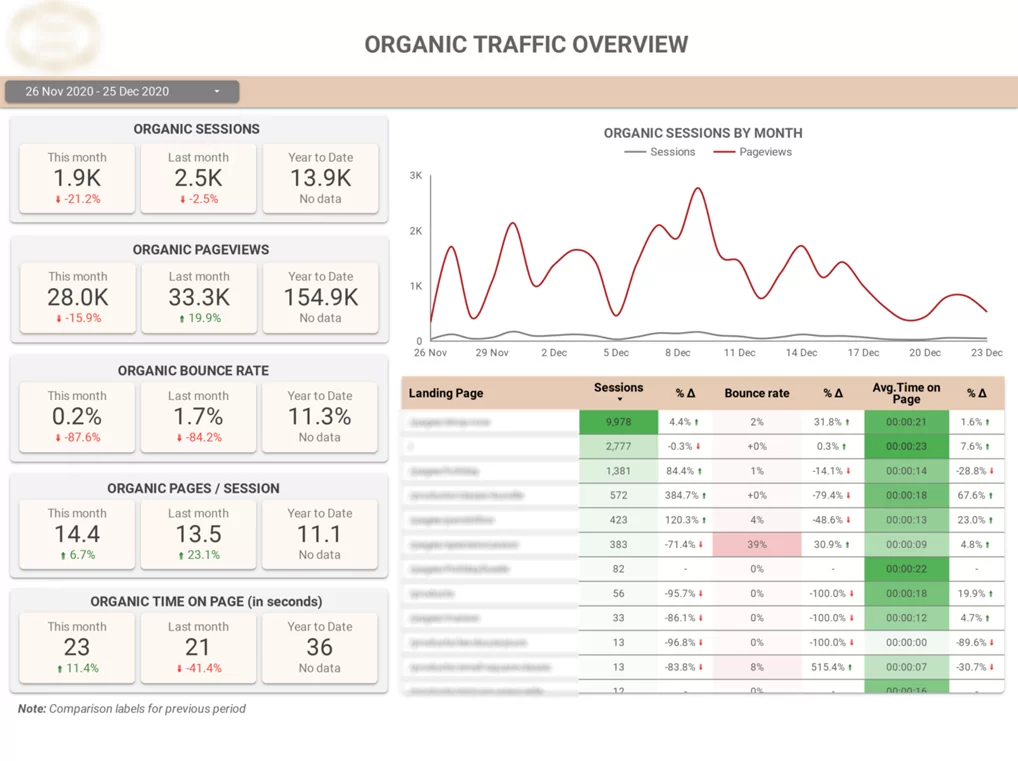
Our marketing analytics consultants built this Looker Studio report for an SEO agency for client reporting. It provides a clear overview of how much organic traffic was acquired, demographic of the visitors and SEO progress over time.
Key Features:
This Looker Studio dashboard connects directly to Google Analytics 4 and focuses specifically on organic search traffic analysing your traffic acquisition efforts.
Built for SEO and marketing teams, the dashboard compares the Organic Search traffic in GA4 to the traffic from all other channels. Our GA4 dashboard also helps you identify which landing pages bring most traffic on the website and which ones show high bounce rates.
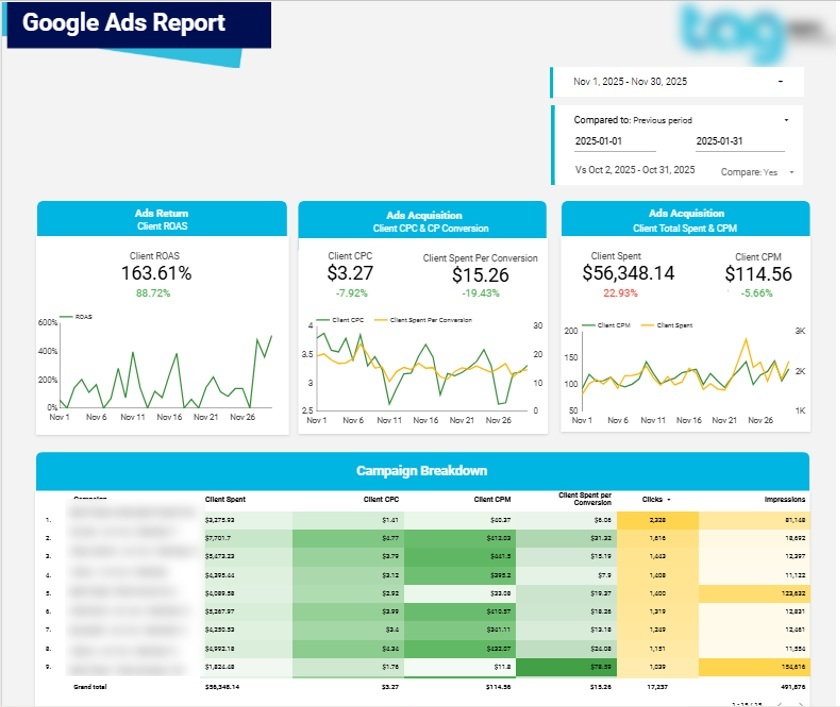
We built this Looker Studio report for a Google Ads agency to support clear and consistent client reporting. It provides a complete overview of Google Ads performance, showing how advertising budgets translate into clicks, conversions, and return on ad spend.
Key Features:
• Period-over-period performance comparisons (optional toggle)
• Daily Google Ads performance trends
• Campaign-level performance analysis
• Conversions broken down by type
• Top-performing keywords by clicks and conversions
• Conversions by city for local performance insights
This Looker Studio dashboard connects natively to Google Ads and focuses on analyzing paid search performance across campaigns, keywords, and locations.
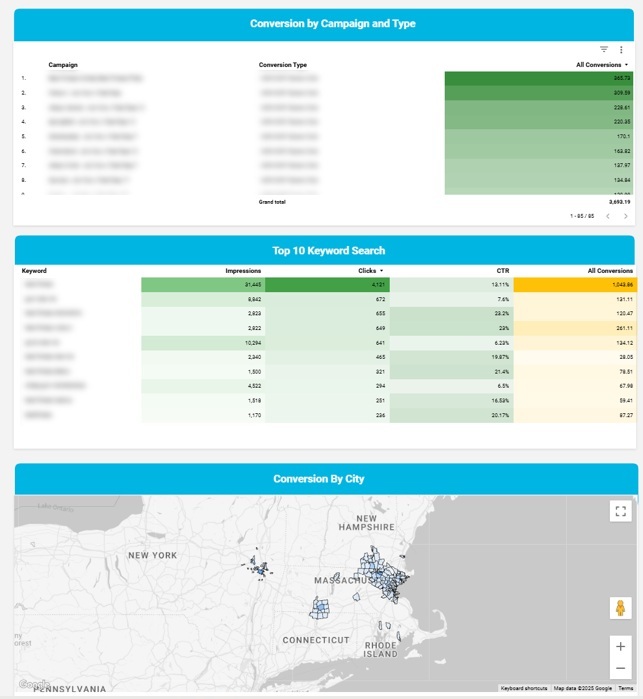
Built for Google Ads specialists and marketing teams, it helps identify which campaigns deliver the best value for money in terms of clicks and ROAS. Clients can clearly see how many conversions of each type are generated by each campaign, while keyword analysis highlights which search terms drive the strongest results.
The geographic breakdown is especially valuable for local businesses such as restaurants, gyms, and service providers.
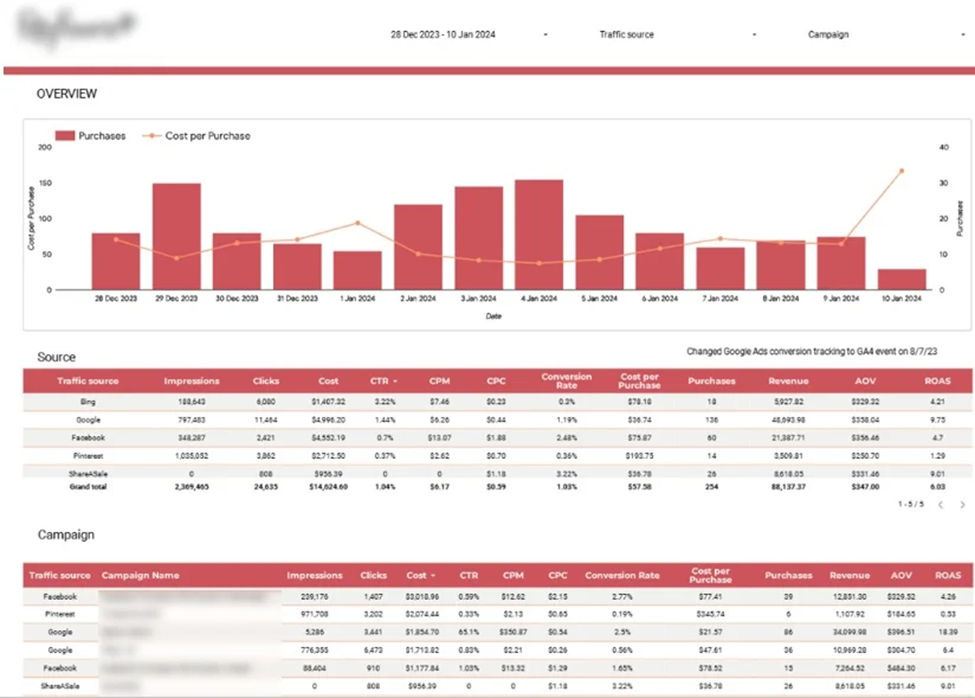
This Looker Studio dashboard was developed help an e-commerce client compare marketing performance across multiple channels. It combines data from Google Analytics, Bing, Google Ads, Facebook, Pinterest, and ShareASale, giving a single view of customer acquisition, conversions, and ROI.
Key Features:
• Daily purchases alongside cost per purchase
• Marketing metrics by channel (impressions, CPM, Cost Per Purchase, ROAS)
• Conversion rates, purchases, and revenue by channel
• Campaign-level breakdown by channel to identify top-performing campaigns
Built for performance marketing specialists, the dashboard highlights which channels are the best for brand awareness, sales, and profitable customer acquisition.
The top section visualizes daily purchases and cost per purchase trends to monitor the customer acquisition costs and make sure that they are below the average order value.
The detailed tables below show channel-level and campaign-level performance, allowing teams to pinpoint which campaigns generate the most revenue, highest ROAS, and strongest overall marketing impact.
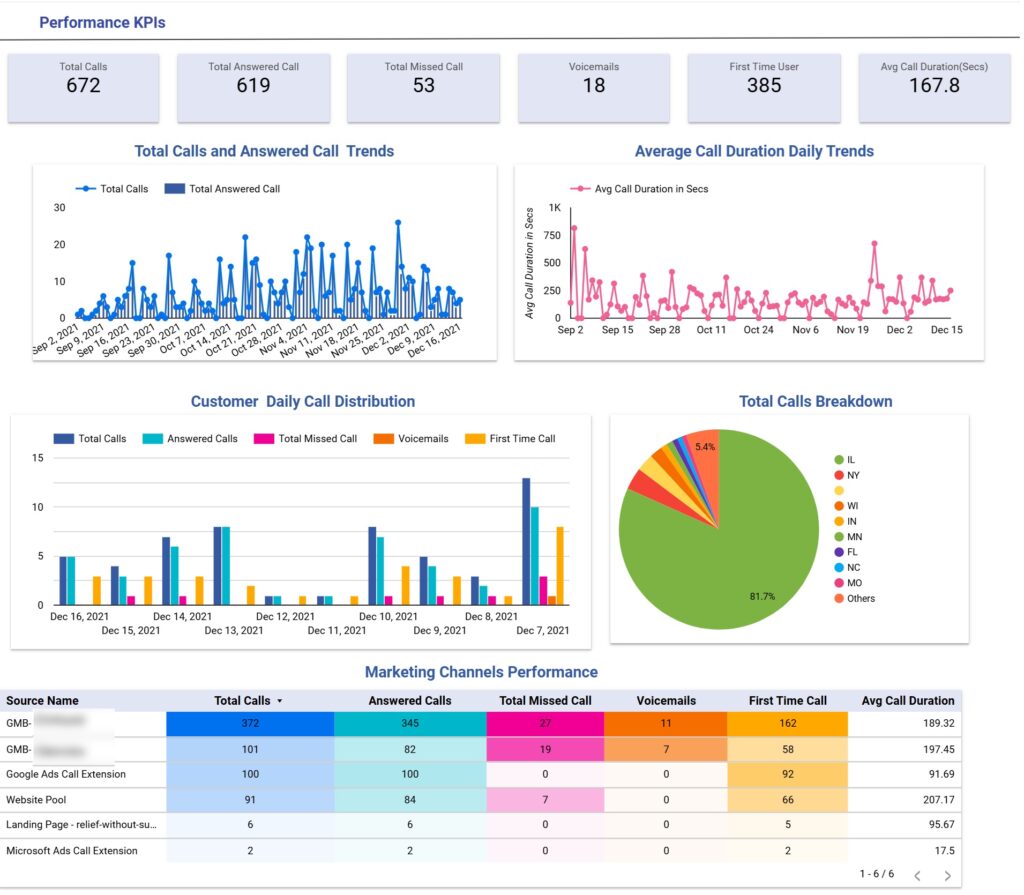
This Looker Studio dashboard was built for lead generation businesses that rely heavily on inbound phone calls, especially local service-based companies such as dental clinics, medical practices, home services, and legal firms. It provides a structured view of call performance and marketing effectiveness, helping teams understand which channels drive the most valuable enquiries.
Key Features:
• Daily trends for total calls, answered calls, and average call duration
• Call status breakdown (answered, missed, voicemail, first-time callers)
• Geographic analysis of calls by state
• Channel-level comparison of call volume and engagement quality
Our consultants developed this dashboard using data from CallRail for a group of dental clinics focused on local patient acquisition. The top section visualises daily call trends, including total calls, answered calls, and average call duration. Below, calls are segmented by status, allowing management to quickly identify missed call rates and first-time enquiries. Geographic breakdowns by state help local businesses focus on priority markets.
The lower section evaluates marketing performance by channel. It compares total calls, answered calls, missed calls, voicemails, first-time calls, and average call duration across traffic sources. This structure allows marketing teams to distinguish between channels that generate high call volume and those that generate more engaged leads, measured by longer average call duration. As a result, budget allocation and campaign optimisation decisions become more data-driven and performance-focused.
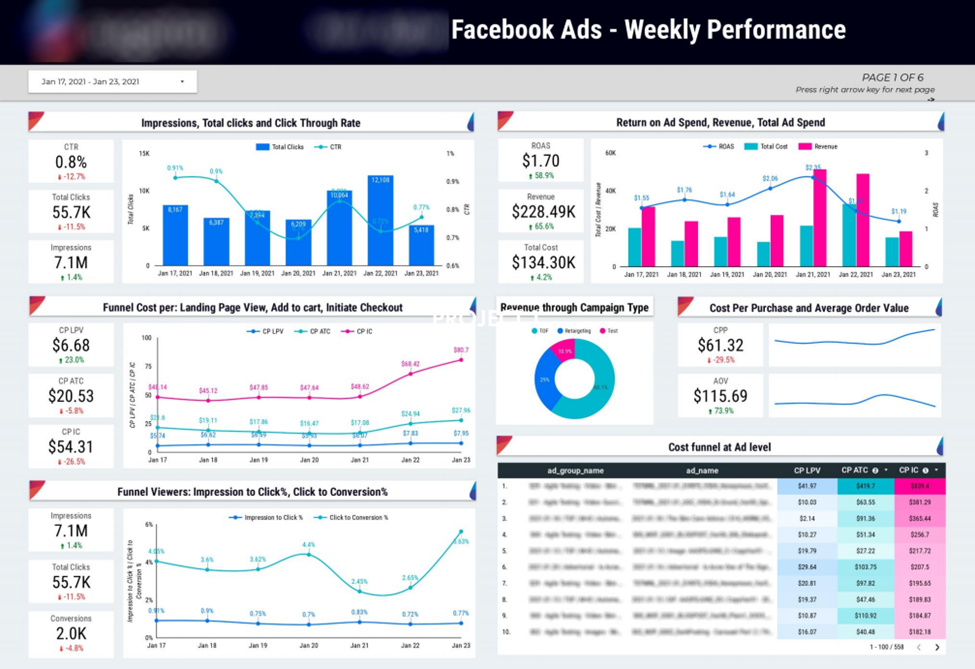
This Looker Studio dashboard was created to help Facebook Ads marketing agency track performance across the entire marketing funnel and measure the cost of driving conversions at each stage.
Key Features:
• Key monetary metrics: ad spend, revenue, and ROAS (with daily trends)
• Impressions, clicks, and CTR analysis to evaluate click-through efficiency
• Conversion funnel cost analysis: landing page views, add to cart, initiate checkout
• Cost per purchase and average order value visualization
Designed for media buyers and account managers, it helps identify how efficiently impressions turn into clicks and conversions. The top section highlights key monetary metrics and daily trends, while funnel analysis shows the cost of each stage, from landing page views to purchases. Trend charts allow teams to see whether performance improves or declines over time, and cost per purchase alongside average order value helps evaluate overall campaign profitability.
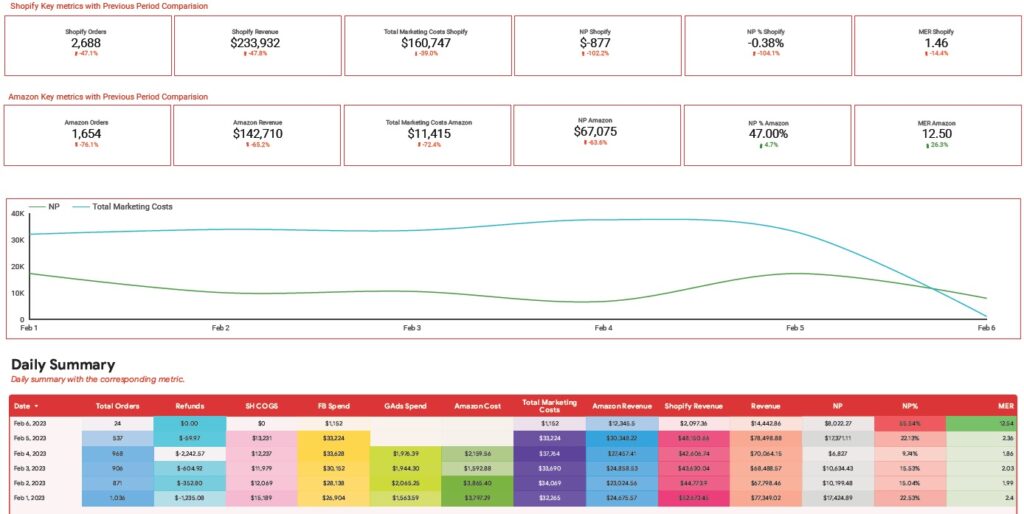
This Looker Studio dashboard was built for an e-commerce brand selling on Amazon and Shopify to give a clear overview of sales performance and marketing efficiency. It combines sales data with advertising expenses from multiple paid platforms, helping teams understand overall marketing profitability.
Key Features:
• Sales performance cards for both Amazon and Shopify
• Daily table showing orders, COGS, revenue, refunds, and advertising spend
• Marketing cost breakdown by platform (Facebook, Google, Amazon)
• Net profit, profit margin, and marketing efficiency ratio calculations
• Line chart tracking daily marketing costs versus net profit
This is a C-level Looker Studio dashboard would be most relevant for e-commerce brand owners as it helps to keep an eye on costs and monitor the profitability of marketing efforts.
If the client notices that the net profit margin falls dramatically, they can immediately attribute the change to paid ads spend from one of the channels or increased refunds. They can then investigate the cause of the issue further by looking into the individual refunds or campaigns.
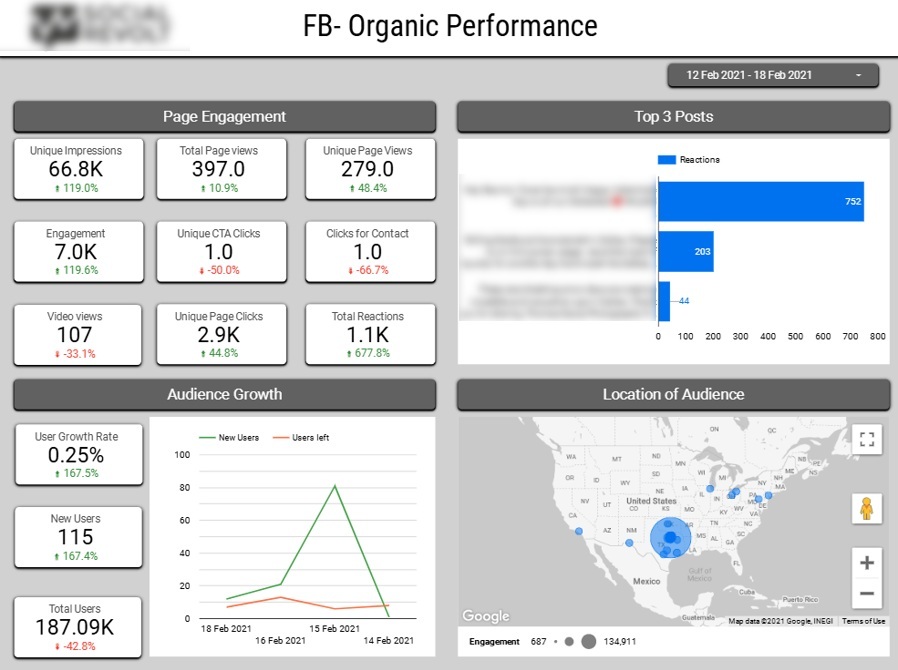
This Looker Studio dashboard was developed for a social media marketing agency to provide clear and transparent performance reporting for clients across their social channels.
Key Features:
• Total impressions, page clicks, reactions, and engagements
• Top 3 posts ranked by number of reactions
• Audience growth tracking, including new followers and unfollows
• Audience location analysis across U.S. states
The dashboard connects directly to Facebook and Instagram and focuses on analyzing content performance and audience growth.
Built for social media marketing professionals, this dashboard helps teams quickly understand which posts generate the highest engagement which highlights the content that resonates most with their audience.
Tracking follower growth and unfollows over time makes it easier to assess the impact of campaigns and posting strategies.
The geographic breakdown of audiences by state supports more targeted content planning and regional campaign optimization, enabling marketers to refine their strategies based on where their most engaged audiences are located.
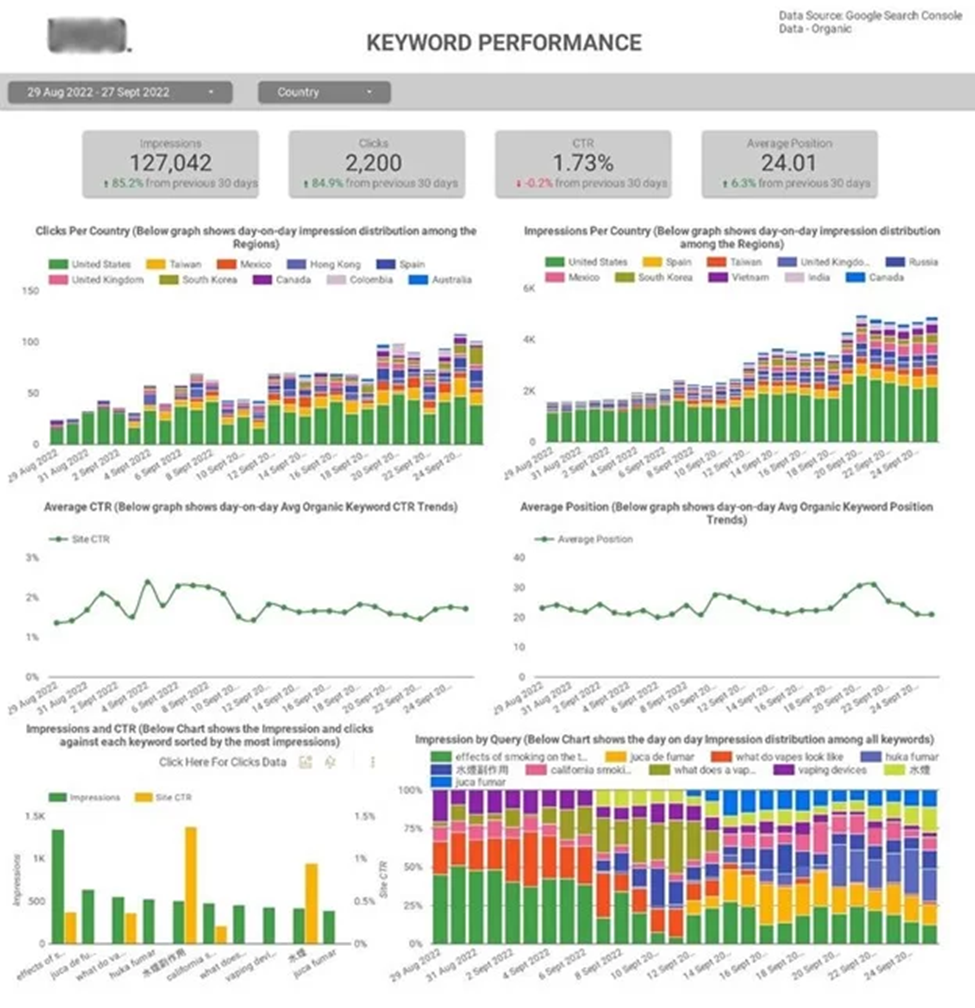
This Looker Studio dashboard was built for SEO and marketing teams to track keyword rankings and measure a website’s visibility on search engine results pages.
Key Features:
• Keyword ranking analysis to monitor SERP visibility
• Identification of keywords that gained or lost positions
• Country-level visibility analysis by impressions and clicks
• Top 10 search queries by impressions and clicks
• Detection of new search queries with growth potential
The dashboard connects directly to Google Search Console and focuses on analyzing search performance and keyword opportunities.
Designed for SEO professionals, this dashboard makes it easy to report performance to clients while identifying clear optimisation priorities. The country-level analysis highlights where most organic traffic originates and which markets perform best. Query-level insights show what topics the website is most visible for, helping shape content strategy.
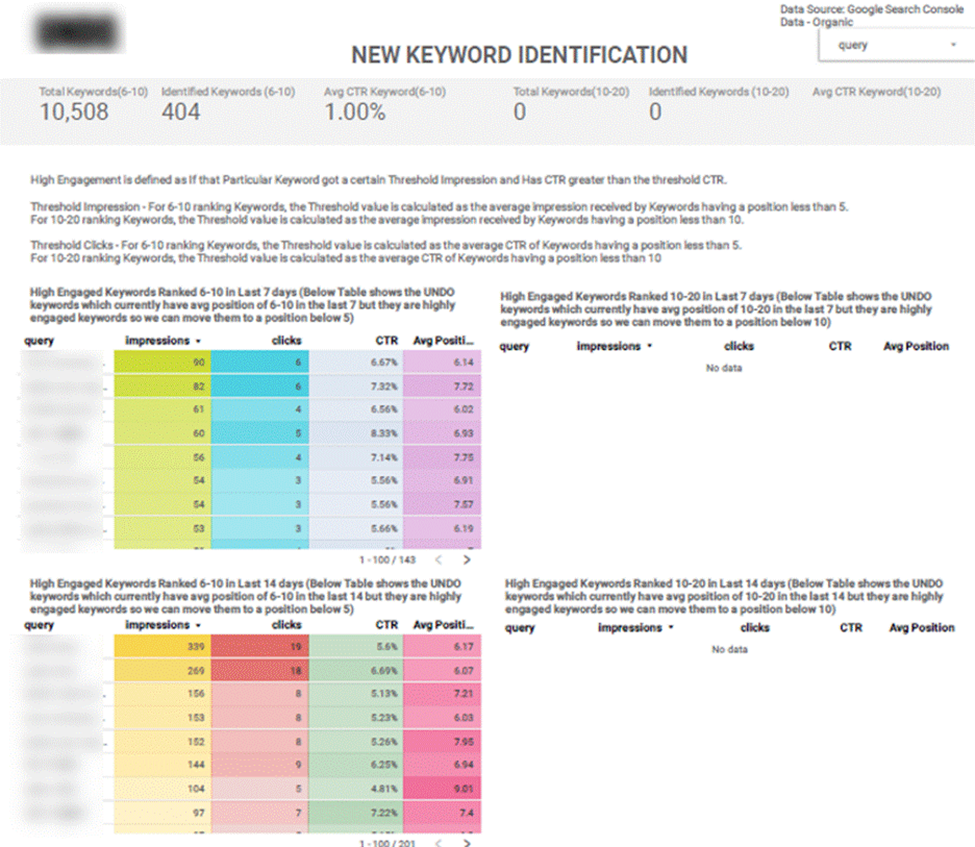
The final section surfaces new search queries with average positions between 6 and 10, allowing SEO teams to prioritise high-potential keywords that are close to ranking on page one and can deliver meaningful traffic growth with targeted optimisation efforts.
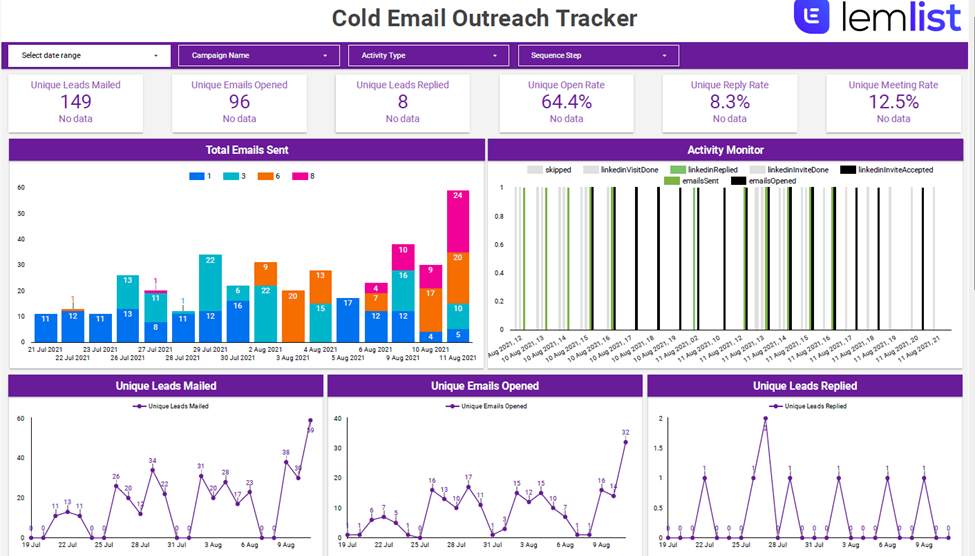
Our data visualization consultants developed this Looker Studio template for an email marketing agency running multi-channel outreach campaigns using Lemlist. It enables real-time monitoring of outreach sequences on email and LinkedIn and allows the agency to instantly update clients on campaign progress and performance.
Key Features:
• Lead outreach metrics: leads emailed, open rate, reply rate, and meeting bookings
• Email volume analysis by sequence step
• Activity monitoring by type (emails sent, LinkedIn profile visits, accepted messages)
• Daily trends for leads emailed, emails opened, and replies
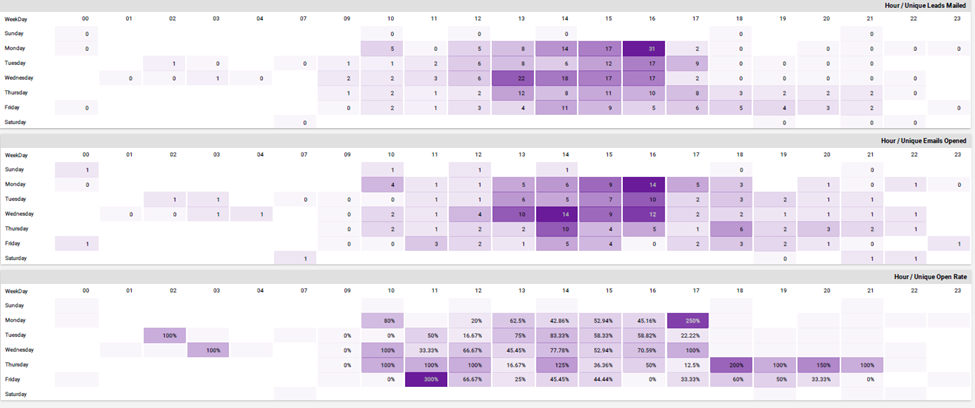
• Performance breakdown by weekday and hour
This email Looker Studio dashboard helps agencies to highlight the value of their work for the clients through reporting consistent replies and booked meetings.
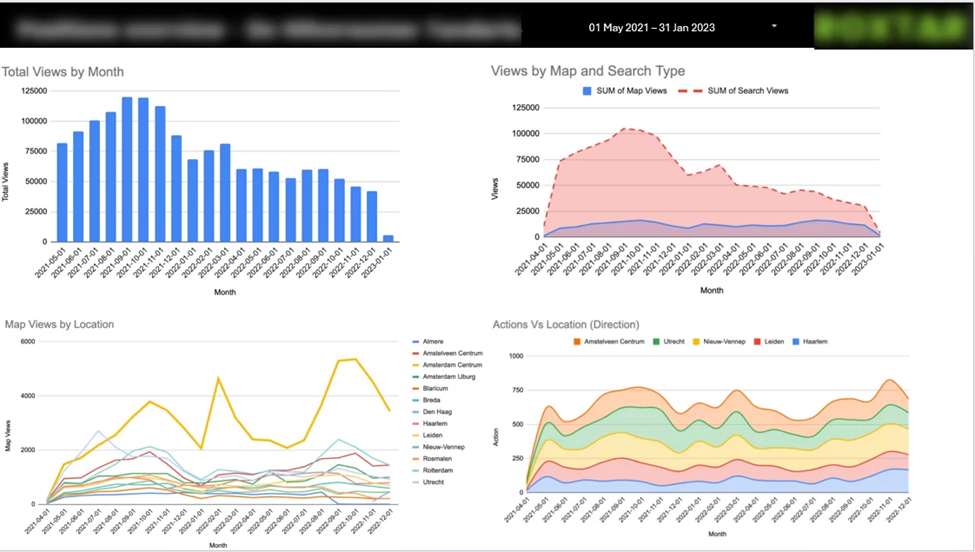
This Looker Studio dashboard focuses on measuring the local search visibility and performance of Google Business Profiles across Google Maps and Google Search.
Key Features:
• Monthly Google Business Profile views split between Maps and Search
• Combined reporting for multiple business locations and accounts
• Breakdown of views and user actions by location
• Analysis of key actions such as calls, website clicks, and direction requests
• Conversion rate analysis based on views versus actions
Created for a phone repair chain in the Netherlands operating across multiple cities, this report consolidates data from 20 Google Business Profile accounts into a single, easy-to-read dashboard. It highlights how visibility changes over time, where customers discover the business (Google Maps or Search), and which locations generate the most conversions.
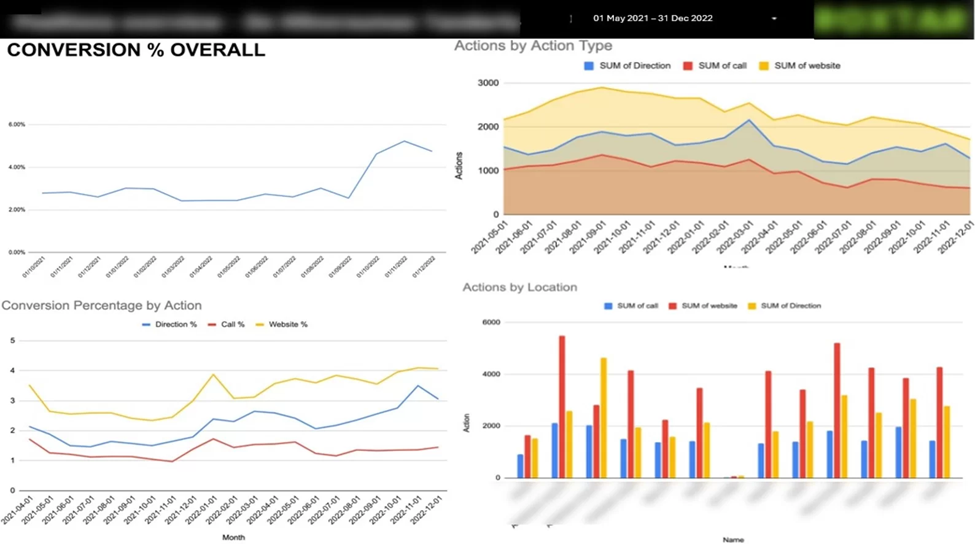
The conversion-focused pages help local SEO specialists identify which actions customers take most often and which cities deliver the strongest results, enabling better prioritisation of optimisation efforts and local marketing spend.
Looker Studio dashboards are powerful tools for turning complex marketing, SEO, and e-commerce data into clear, actionable insights. The examples we’ve shared in this article demonstrate how well-designed dashboards can help businesses track performance, optimise campaigns, and make data-driven decisions with confidence.
If you’re looking to create a dashboard tailored to your business needs, whether it’s for SEO, PPC Ads, social media, email marketing, or e-commerce our team can help. Contact us today to discuss how we can build a Looker Studio dashboard that delivers the insights you need to grow your business.
![]()
![]()
![]()